Design, Development and Evaluation of an Orange Sorter
Based on Machine Vision and Artificial Neural Network
Techniques
R. RASEKHI
1*and M. H. RAOUFAT
1**1- Department of Mechanics of Agricultural Machinery, College of Agriculture, Shiraz University, Shiraz, I.R. Iran
Received 19 October 2013, Accepted 4 May 2013, Available Online 1 June 2014 ABSTRACT-The high production of orange fruit in Iran calls for quality sorting of this product as a requirement for entering global markets. This study was devoted to the development of an automatic fruit sorter based on size. The hardware consisted of two units. An image acquisition apparatus equipped with a camera, a robotic arm and controller circuits. The second unit consisted of a robotic actuator with required electronic circuits. For sorting purposes, an appropriate image processing technique was applied and two models of size thresholds were developed and incorporated in a number of image processing algorithms, which were, in turn, combined with Artificial Neural Network (ANN) techniques for classifying purposes. Multi Layer Perceptron models with various training functions and diverse numbers of neurons were also applied. Each algorithm was used to sort oranges into desired size groups (Small, Medium and Large). The sorter test rig was able to classify the product into three categories with considerably low errors. Although all twelve algorithms had acceptable results, those based on Red and Green segmentation were more satisfactory. For real time evaluation purposes, four algorithms, segmenting based on R color band, and two size threshold models were combined to form 8 comprehensive algorithms, which were used along with the ANN model at the evaluation stage. Results showed that algorithms based on Area, Perimeter and the ANN model, exhibited lower errors. Sorting records of each algorithm were compared to the relevant sorting data brought about by experts. Results show that sorting error can be as low as 1.1%. Although the average capacity of the single sorter was limited to 1 t.h-1, the capacity can be markedly increased by adapting a bank of sorters in parallel mode. The study revealed that orange fruits can be sorted using the introduced techniques at high speed, high accuracy and low costs.
Keywords: Artificial Neural Network, Citrus sorter, Orange Size
INTRODUCTION
Orange (Citrus sinensis) is one of the major fruit products in Iran. According to the FAO, Iran was among the top 10 orange-producing countries in 2007 (FAO, 2007). High production of orange fruit calls for quality sorting of this product for both domestic and global markets.
The use of intelligent machines in agriculture to raise the quality of the produce, to lower production costs and to reduce the manual labor is promising. Adoption of robotic technology is inevitable in modern agricultural systems and can increase the efficiency of post-harvest tasks such as sizing and sorting fruits.
Quality sorting of fruits requires visual inspection. Machine vision can perform this task automatically with lower production costs. Numerous investigations have been carried out in this field. Brosnan and Sun (5) used different computer vision systems for blemish and disease detection of horticultural products. Garcia-Ramos et al. (7) reviewed non-destructive sensors used for fruit firmness determination. Butz et al. (6) compared different technologies for internal qualification of fruits and vegetables.
In recent years, the use of Artificial Neural Networks (ANN) has been increased. The ANN models can be constructed by interconnecting several nonlinear computational elements, known as neurons or nodes, operating parallel to each other, and arranging in patterns similar to biological networks (18). Thai and Shewfelt (20), Bardot et al. (3), Wilkinson and Yuksel (22) used ANN for prediction. Lippmann (11) revealed that ANNs are suitable for modeling complex unstructured human judgment (2). Miller (13) employed Neural network and Bayesian models to grade citrus fruits according to their external quality. Leemans et al. (8) used a new method to grade the blobs by using the image segmentation.
Among the external quality of fruits, size is one of the most important parameters identified by consumers. Furthermore, size information is vital in packing houses. Size can be estimated by image processing techniques (4, 15, 19, 21) or neural network techniques.
and a number of errors. Furthermore, the efficiency of sorting by cup belt is severely affected by its shape and size as well as those of the fruits, which can lead to the misclassification of the fruits.
Considering the existing problems which increase fruit classification errors and also high initial costs of belt conveyors and expensive control systems, this paper describes the development and evaluation of a machine vision system which consists of new control and actuator electronic circuits. The new system is expected to sort the fruits without using complicated and costly equipment. The target system should be able to quantify size and to sort the fruits into size groups in a real-time mode. This study concentrates on the development of appropriate algorithms together with information on their application accuracies. The rig components including the robot elements along with other necessary hardware and software are also described.
MATERIALS AND METHODS
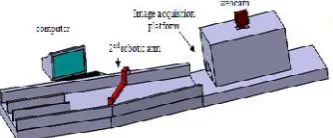
The designed and developed prototype fruit sorter consisted of an image acquisition and processing unit and a sorting unit (Fig. 1). The image acquisition and processing unit included an image acquisition platform with a black background; a webcam (Creative) installed on the top of the platform to acquire the desired image (600800 pixel, RGB), connected to a computer (Pentium 4, Dual CPU, E 2160 at 1.80 GHz). The illumination system inside the platform consisted of six white LEDs*located on the top inner side of
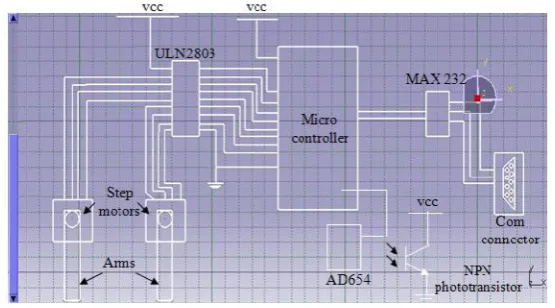
the platform. The LEDs were used to avoid flicker effects. To prevent shadows and to strengthen the light, the inner walls of the platform were painted white. Inside the platform, a robotic arm was accommodated to stop incoming fruits while the acquisition system captured images (Fig. 2). This arm is controlled by a step motor connected to a microcontroller (AVR, ATmega16) and finally to the serial port of the computer. Fig. 3 shows the main parts of the step motor running circuit; transformers, diode bridges and a transistor IC (ULN2803). An interface device (MAX232 IC) was also incorporated in the circuit to enable the connection between the microcontroller and computer through a serial port.
Fig. 1. Schematic view of the sorting test rig
Considering the importance of constant light intensity within the image acquisition platform, a light intensity controller circuit was designed and incorporated in the platform. This circuit included a photo-transistor, a V-F convertor (AD654 IC) and a microcontroller (Fig. 3). As the phototransistor senses the light, it emits voltage which is converted to frequency by a v-f circuit. The microcontroller counts the output frequency periodically. If the frequency is lower than a specific level (in this study 30000 Hz), an alarm LED will switch on as a sign for an immediate remedy.
Fig. 2. Top view of the sorting rig
Fig. 3. Layout of the control circuit
The sorting hardware consists of another robotic arm and step motor connected to the microcontroller introduced earlier (Fig. 1).
A gentle but adjustable slope was considered to promote fruit removal from the sorting table to the fruit bins (Fig. 1).
Performance Tests
Evaluation tests were carried out in three subsequent stages as follows: Preliminary stage
In this stage, a batch of orange fruits (Novel variety)was selected. For each fruit, three perpendicular axial dimensions were measured. The following equation was used to calculate the geometric mean diameter (GMD) of each fruit as a criterion of its actual size.(14).
3
abc
GMD
(1)where a is the longest intercept, b is the longest intercept normal to a and c is the longest intercept normal to a and b (14). The color of the sample orange fruits ranged from green to orange.
The fruits were divided into two groups labeled as “off line” (80 fruits), and “evaluation” (45 fruits) groups.
Development of Image Processing Algorithms and Primary Evaluation
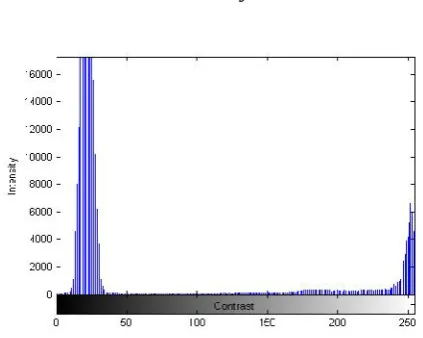
Fig. 4. Typical Histogram of red intensity color of an orange fruit Once the RGB image was changed into a binary image, the mentioned parameters were calculated as follows:
Area:
After making the binary image, the number of “on” pixels represented the area of the fruit in pixels.
Perimeter:
The perimeter of the fruit is represented by the number of pixels on the border of the fruit picture in the binary image.
- Max diameter and Min diameter:
To determine max and min diameters, the coordinates of each pixel of the binary image are first calculated and considered as a data point. Then, a matrix of the two variables of each pixel (x, y) is formed where x is the length and y is the width of each pixel coordinate. Assuming N as the length of vector of each pixel, the following equations are employed to calculate the max diameter and min diameter values:
12 1 2
N x
uxx (2)
12 1
2
N y
uyy (3)
N xy
uxy
(4)xy yy
xx u u
u ) 4
( =
common 2 (5)
common u
u r
common u
u r
MinDiamete 2 2 xx yy (7)
Furthermore, correlations between pixel values, as identified by each program with the corresponding actual size of the fruit (GMD), were established. Each test was carried out in five replications.
To allocate a single fruit into one of the three size groups; Small, Medium and Large; two thresholds ((TH1&TH2) or (TH3&TH4)) had to be identified and expressed in terms of pixels. To identify threshold values, a subroutine program was developed. Although the two thresholds were defined based on Iranian consumer standards as default thresholds, the new program was flexible. In other words, size thresholds are modifiable according to the users’ desires. The subroutine program was able to calculate hreshold values for each algorithm based on the following. The models were arbitrarily defined and found to give rational threshold values:
2 1 MaxS MinM
TH
2 2 MaxM MinL
TH (8)
2
3 MeanS MeanM
TH
2
4 MeanM MeanL
TH (9)
where MaxS, MaxM and MaxL are Maximum pixel values of the Small, Medium and Large groups, respectively,
MinS, MinM and MinL are Minimum pixel values of the Small, Medium and Large groups, respectively, and
MeanS, MeanM and MeanL are Mean pixel values of the Small, Medium and Large groups, respectively.
The above equations can be used to calculate threshold values based on either Area, Perimeter, Max diameter or Min diameter.
The 4 selected algorithms from the off-line stage, that is, the four algorithms segmenting one of four parameters (Area, Perimeter, Max diameter or Min diameter) based on Red color band, were combined with the two relevant thresholds models to form 8 comprehensive algorithms to be used in real time tests.
Therefore, as the subroutine program calculates the relevant threshold values, the values are exported to each of the 8 comprehensive algorithms. These algorithms are capable of measuring fruit parameter and comparing it with the threshold values to conclude fruit size group. For instance, if the algorithm measures Area, the following subroutine can conclude the sorting decision for that particular fruit:
If (Area ≤TH1) Group= Small
Artificial Neural Networks
In this study, a number of Artificial Neural Network (ANN) algorithms, which were combinations of image processing and Artificial Neural Network (ANN) techniques, were developed and used for classification. The Multilayer Feed-forward Neural Network (MFNN) was used for orange classification. The MFNN model can be constructed with more than 1 layer and is able to learn nonlinear and complex relationships by using a training algorithm with a set of input-output pairs (10). For orange fruit classification, a back propagation network model with various training functions including variable learning rate back propagation MLP-GDM, Resilient back Propagation (MLP-RP) and Scaled Conjugate Gradient (MLP-SCG) were used for ANN modeling. A logarithmic sigmoid transfer function (logsig) was applied in the first layer of the network, and a linear transfer function (Purelin) was used in the final layer. For ANN modeling, several hidden layers and nodes can be employed; but generally, one hidden layer has been found to be adequate, and only in some cases, a slight advantage may be gained by using two hidden layers. In order to sort oranges into three size groups, one hidden layer was employed for modeling; however, the number of neurons in the hidden layer differed from 1 to 6.
For training the ANN, the fruit batch of the off-line stage, pre-classified based on the GMD, was used. The batch, consisting of 80 orange fruits, was fed into the sorter unit. Then, the algorithm started to capture images, segment the object and calculate pixel values for the four mentioned parameters (Area, Perimeter, Max diameter and Min diameter) based on the Red color band for each orange through image processing techniques. The data for image processing was then regarded as input information for the series of ANN classifiers. Since the input information had various values, the inputs and outputs were normalized, gaining a value between [0,1] before being fed into the network. Finally, the ANNs were trained based on the pre-classified batch and the training ANNs were qualified to be employed for classifying the oranges in real time conditions.
Real-time Evaluation of Image processing Algorithms and ANNs
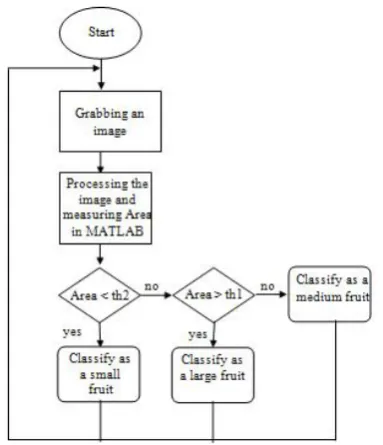
platform simultaneously, to signal the termination of the sorting process and the admission of the next fruit. Fig. 5 illustrates the comprehensive algorithm developed for sorting based on Area and Fig. 6 shows the microcontroller algorithm controlling the two arms.
Fig. 5. Comprehensive sorting algorithm based on area
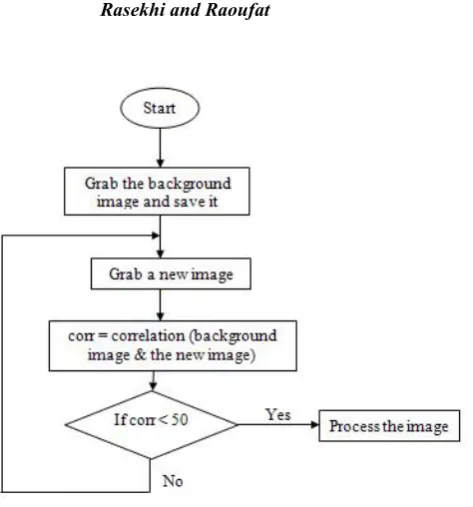
Considering the continuous images captured by the webcam, only pictures containing orange images were imported to the comprehensive algorithms. Two methods were tried to implement this decision.
In the first method, a laser transmitter and receiver was accommodated to sense the presence of the orange fruit. However, preliminary evaluation indicated that this system was inherently associated with long delays and was therefore not chosen for the task.
Fig. 6. Comprehensive microcontroller algorithm for controlling the arms
Fig. 7. Algorithm developed for efficient real time image grabbing
network techniques, were employed to classify the fruits of the evaluation batch into three size groups. For each algorithm and neural network pattern, various layers of perceptron were applied. Finally, sorting records for each neural network algorithm were compared with the relevant sorting data based on GMD and the most accurate algorithm with the optimum layers was found.
Sorting Elapsed Time
To measure the duration of operation, a stopwatch program was developed, based on the CPU frequency of the computer, and could provide information regarding elapsed time when a particular algorithm is processed. This program was also capable of measuring the duration of the arms’ movements (first/ second). The collected data were used to calculate the throughput rate of the test rig.
RESULTS AND DISCUSSION
Three subsequent stages of evaluation tests were carried out to find the sorting accuracy and time required to sort a single fruit as well as the throughput capacity of the sorting unit.
Preliminary Test Results
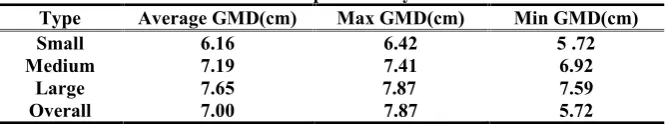
To evaluate the developed algorithms, equal batches of small, medium and large oranges were chosen from the fruit market based on local consumer preferences expressed in terms of GMD. Table 1 shows information on the orange sizes measured/calculated for each batch.
Table 1. GMD of fruit batch used in preliminary evaluation
Type Average GMD(cm) Max GMD(cm) Min GMD(cm)
Small 6.16 6.42 5 .72
Medium 7.19 7.41 6.92
Large 7.65 7.87 7.59
Overall 7.00 7.87 5.72
Off-line Tests Results
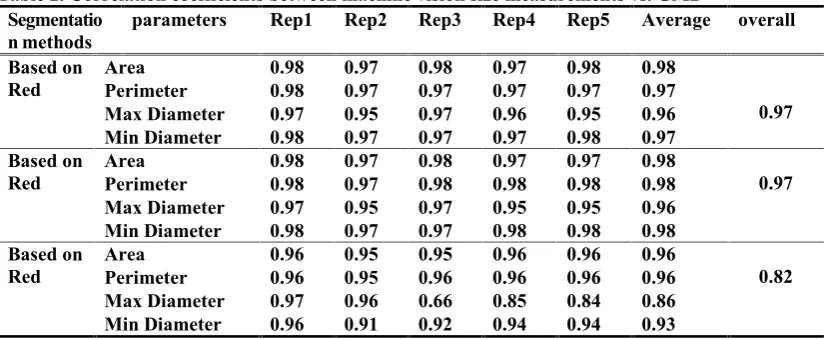
R and G color bands (Table 2), only the four algorithms based on the R color band were employed and evaluated in the real time stage.
Table 2. Correlation coefficients between machine vision size measurements vs. GMD Segmentatio
n methods parameters Rep1 Rep2 Rep3 Rep4 Rep5 Average overall Based on
Red Area 0.98 0.97 0.98 0.97 0.98 0.98
0.97 Perimeter 0.98 0.97 0.97 0.97 0.97 0.97
Max Diameter 0.97 0.95 0.97 0.96 0.95 0.96 Min Diameter 0.98 0.97 0.97 0.97 0.98 0.97 Based on
Red AreaPerimeter 0.980.98 0.970.97 0.980.98 0.970.98 0.970.98 0.980.98 0.97 Max Diameter 0.97 0.95 0.97 0.95 0.95 0.96
Min Diameter 0.98 0.97 0.97 0.98 0.98 0.98 Based on
Red AreaPerimeter 0.960.96 0.950.95 0.950.96 0.960.96 0.960.96 0.960.96 0.82 Max Diameter 0.97 0.96 0.66 0.85 0.84 0.86
Min Diameter 0.96 0.91 0.92 0.94 0.94 0.93
Real-Time Tests Results
As mentioned, real-time evaluation was conducted in which the complete test rig (image acquisition and sorting units) was used.
In this stage, the two models of size thresholds introduced earlier were incorporated in the four image processing algorithms selected for the real time study, therefore, a total of 8 comprehensive algorithms were developed and evaluated. To investigate which combinations of algorithms and thresholds provided a more accurate performance, the outputs of the system’s classifications were compared to the classification data based on GMD and the errors were calculated in 4 replications.
The same evaluating process was then carried out for ANNs and the errors of each Neural Network classifier were computed.
Table 3 demonstrates that the Multi-Layer Perceptron with RP and SCG transferring functions had least errors (1.1%). Since increasing the number of neurons in each layer increases processing time, the number of neurons has to be optimized. The optimum neuron number for MLP-SCG is 4 for the input layer, 3 for the hidden layer and 3 neurons for the output layer. Similarly, the optimum number of neurons for MLP-RP is 4 neurons for the input layer, 3 for the hidden and 3 for the output.
Table 3. Percentage of errors associated with neural network classification as compared to classification based on GMD
Percentage of errors (%)
Neural Network Structure Type of training function
4-6-3 4-5-3
4-4-3 4-3-3
4-2-3 4-1-3
MLP-GDM
37.22 41.11
43.33 MLP-SCG
1.1* 1.1*
1.1* 1.1*
7.78 27.22
MLP-RP
1.1* 1.1*
5.55 1.1*
7.78 28.33
MLP-RP
layer) are shown in Table 4. This table reveals that algorithms #5 (based on Area & TH3, 4), algorithm #6 (based on Perimeter & TH3, 4) and ANN have the least errors (1.1%) and algorithm #3 (based on Max diameter & TH1, 2) has the maximum error rate (7.78%) when sorting the fruits.
Table 4. Percentage of errors associated with classification based on the machine vision and ANN as compared to the classification based on GMD
% error Sorting based on
Average Rep4 Rep3 Rep2 Rep1 1.66 2.2 0.00 0.0 4.44 Area&TH1,2 1.66 4.44 0.00 2.2 0.00 perimeter& TH1,2 7.78 6.67 6.67 8.89 8.89 Max diameter & TH1,2
3.33 6.67 2.2 0.00 4.44 Min diameter&TH1,2 1.1 0.00 0.0 2.2 2.2 Area&TH3,4 1.1 0.00 0.0 2.2 2.2 perimeter& TH3,4 5.55 4.44 2.2 6.67 8.89 Max diameter & TH3,4
6.11 2.2 11.11 4.44 6.67 Min diameter&TH3,4 1.1 0.0 2.2 2.2 0.00 ANN
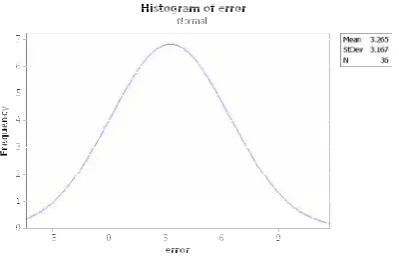
To show the validity of adapting the analysis of variance to error results, Fig. 8 and table 5 are presented, which reveal the presence of a normal distribution within the error output (Table 4).
Fig. 8. Sorting error histogram for normality test
Table 5. Tests of normality for sorting errors
Shapiro - wilk Kolmogorov-Smirnov9 sig df statistic Sig. df statistic error .000 36 .367 000. 36 243
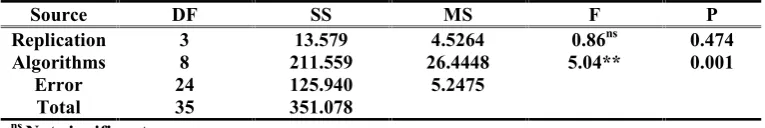
Table 6. Results of the real-time tests’ statistical analysis
P F
MS SS
DF Source
0.474 0.86ns
4.5264 13.579
3 Replication
0.001 5.04**
26.4448 211.559
8 Algorithms
5.2475 125.940
24 Error
351.078 35
Total
nsNot significant
** Highly significant differences (p<0.01)
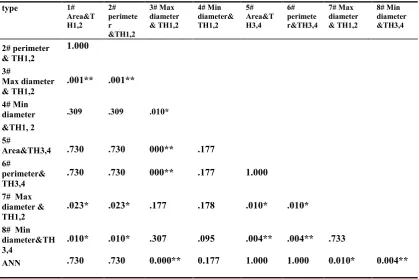
Comparing the sorting mean errors by LSD† (Table 7) indicates that although
algorithms #5 (based on Area & TH3, 4), #6 (based on Perimeter & TH3, 4) and ANN exhibit lower errors (1.1%), there are no significant differences between algorithms #1 (based on Area & TH1, 2 - with 1.66% error), #2 (based on Perimeter & TH1, 2 - with 1.66% error) and #4 (based on Min diameter & TH1, 2 – with 3.33% error). As a result, adoption of each of the above 6 algorithms does not make a difference.
Algorithms #5 and #6 (1.1%) have highly significant differences (0.01p) with algorithms #3 (7.78%) and #8 (6.11%) and have significant difference (0.05p) with algorithm #7 (5.55%). Therefore, algorithms #3 (based on Max diameter & TH1, 2), #7 (based on Max diameter & TH3, 4), and #8 (based on Min diameter & TH3, 4), are not recommended for sorting as compared to algorithms #5 and #6.
To summarize, both threshold models were reliable for sorting and adopting algorithms #1, #2, #4, #5 and #6. In addition, ANN is recommended for sorting purposes because it shows the least possible sorting error.
Throughput Rate
The total time required for real time sorting, including time required for software and hardware operations, was measured during evaluation. The first position of the second arm was considered as the initial point for measuring operation times. Table 8 shows that when image processing algorithms were used, the test rig sorted oranges into three size groups (Large, Medium and Small), in periods of 530, 755 and 935 ms/fruit, respectively. However, when image processing algorithms and ANN were used, sorting speeds were 569, 794 and 974 ms/fruit, for Large, Medium and Small fruits, respectively. The degrees of the second arm’s movement are the main cause of time differences.
Minimum and maximum speeds were about 1fruits/s and 2fruits/s, depending on the uniformity of the fruits. Measuring the throughput rate of the single sorter revealed that it could sort 1t of orange fruits into three size groups in 1 hour, the average speed for sorting the fruits being found to be 1.87 fruits/second. Although the average throughput rate for the single sorter was limited to 1t.h-1, it could easily be increased to
the desired capacity by accommodating a number of sorters in a parallel bank arrangement.
Table 7. Mean error comparisons for various sorting algorithms based on individual errors 8# Min diameter &TH3,4 7# Max diameter & TH1,2 6# perimete r&TH3,4 5# Area&T H3,4 4# Min diameter& TH1,2 3# Max diameter & TH1,2 2# perimete r &TH1,2 1# Area&T H1,2 type 1.000 2# perimeter & TH1,2 .001** .001** 3# Max diameter & TH1,2 .010* .309 .309 4# Min diameter &TH1, 2 .177 000** .730 .730 5# Area&TH3,4 1.000 .177 000** .730 .730 6# perimeter& TH3,4 .010* .010* .178 .177 .023* .023* 7# Max diameter & TH1,2 .733 .004** .004** .095 .307 .010* .010* 8# Min diameter&TH 3,4 0.004** 0.010* 1.000 1.000 0.177 0.000** .730 .730 ANN
Significant differences according to LSD test (p <0.05) Highly significant differences according to LSD test (p<0.01)
Table 8. Details of time requirements for sorting a single fruit
Task Large-orange
Sorting time (ms) sorting time (ms)Medium-Orange sorting time (ms)Small-Orange
Image processing 309 30 30
ANN 69 69 69
Arms movement 500 725 905
Total time for image
processing algorithm 530 755 935
Total time for ANN 569 794 974
CONCLUSIONS
comprehensive algorithms along with the ANN model were used at evaluation stages. Results showed that although algorithm #5 (based on Area & TH3, 4) and algorithm #6 (based on Perimeter & TH3, 4) and the ANN model exhibit smaller errors, there are not significantly different from algorithms #1 (based on Area & TH1, 2), #2 (based on Perimeter & TH1, 2) and #4 (based on Min diameter & TH1, 2). The real time performance revealed that a single test rig unit could sort fruits at minimum and maximum rates of about 1fruit/s and 2 fruits, respectively.
The overall results revealed that image processing and neural network techniques used in the present test rig along with state of the art electrical circuit were capable of sorting orange fruits at high speed, high accuracy and low costs as compared to common sorters which use cup belt technology.
REFERENCES
1. Aleixos, N., J. Blasco, F. Navarron and E. Molto. 2002. Multispectral inspection of citrus in real-time using machine vision and digital processors. Computers and Electronics Agric. 33: 121-137.
2. Applegate, L. M., J. I. Jr. Cash and D. Mill. 1988. Information technology and tomorrow's manager. Havard Business Review 66(6): 128-136.
3. Bardot, I., N. Martin, G. Trystram, J. Hossenlopp, M. Rogeaux and L. Bochereau. 1994. A new approach for the formulation of beverages. Part II; Interactive automatic method. Lebensmittel-Wissenschaft und- Technologie 27(6): 513-521. 4. Blasco, J., S. Cubera, J. Gomez-Sanchis, P. Mira and E. Molto. 2009. Development of a machine for the automatic sorting of pomegranate (Punica granatum) arils based on computer vision. J. Food Eng. 90: 27-34.
5. Brosnan, T. and D.W. Sun. 2004. Improving quality inspection of food products by computer vision: a review. J. Food Eng. 61(1): 3–16.
6. Butz, P., C. Hofmann and B. Tauscher. 2005. Recent developments in noninvasive techniques for fresh fruit and vegetable internal quality analysis. J. Food Sci. 70(9): 131–141.
7. Garcia-Ramos, F. J., C. Valero, I. Homer, J. Ortiz-Caٌavate and M. Ruiz-Altisent. 2005. Non-destructive fruit firmness sensors: a review. Spanish Journal of Agricultural Research 3(1): 61–73.
8. Leemans, V., H. Magein and M. F. Destain. 1998. Defects segmentation on ‘Golden Delicious’ apples by using colour machine vision. Computers and Electronics in Agric. 20: 117-130.
10. Lertworasirikul, S. 2008. Drying kinetics of semi-finished cassava crackers: a comparative study. Lebensmittel-Wissenschaft und-Technologie 41(8): 1360-1371.
11. Lippmann, R. P. 1987. An introduction to computing with neural nets. Institute of Electrical and Electronics Engineering Acoustic. Speech Signal Processing Magazine 4(2): 4–22.
12. Mattone, R., M. Divona and A. Wolf. 2000. Sorting of items on a moving conveyor belt. Part2: Performance evaluation and optimization of pick-and-place operations. Robotic and Computer Integrated Manufacturing 16: 81-90.
13. Miller, W. M. 1995. Optical defect analysis of Florida citrus. Applied Eng. in Agric. ASAE 11(6): 855–860.
14. Mohsenin, N. N. 1996. Physical Properties of Plant and Animal Materials. Gordon and Breach Publishers, 841p.
15. Okamura, N. K., M. J. Delwiche and J. F. Thompson. 1991. Raising grading by machine vision. ASAE, Paper No. 91-7011.
16. Sarkar, N. and R. R. Wolfe. 1985. Feature extraction techniques for sorting tomatoes by computer vision. Trans. ASAE 28 (3): 970-974.
17. Sistler, F. E. 1987. Robotics and intelligent machines in agriculture. IEEE J. Robotic and Automation 3(1): 3-6.
18. Smith, M. 1996. Neural networks for statistical modeling. 1stEd., Itp New Media.
19. Tao, Y., C. T. Morrow, P. H. Heinemann and J. H. Sommer. 1990. Automated machine vision inspection of potatoes. ASAE, Paper No. 90-3531.
20. Thai, C. N. and R. L. Shewfelt. 1991. Modeling sensor color quality of tomato and peach: neural networks and statistical regression. Trans. ASAE 34 (3): 950–955. 21. Varghes, Z., C. T. Morrow, P. H. Heinemann, J. H. Sommer, Y. Tao and R. M.
Crassweller. 1991. Automated inspection of golden delicious apples using color computer vision. ASAE, Paper No. 91-7002.