Anale. Seria Informatică. Vol. VII fasc. 1 – 2009 Annals. Computer Science Series. 7th Tome 1st Fasc. – 2009
C
C
o
o
m
m
p
p
u
u
t
t
e
e
r
r
B
B
a
a
s
s
e
e
d
d
I
I
n
n
t
t
e
e
r
r
p
p
r
r
e
e
t
t
a
a
t
t
i
i
o
o
n
n
o
o
f
f
t
t
h
h
e
e
S
S
t
t
u
u
d
d
e
e
n
n
t
t
s
s
’
’
E
E
v
v
a
a
l
l
u
u
a
a
t
t
i
i
o
o
n
n
o
o
f
f
t
t
h
h
e
e
T
T
e
e
a
a
c
c
h
h
i
i
n
n
g
g
S
S
t
t
a
a
f
f
f
f
T
Ti
ib
be
er
ri
iu
u
M
Ma
ar
ri
iu
us
s
Ka
K
ar
rn
ny
ya
an
ns
sz
zk
ky
y,
,
Ov
O
vi
id
di
iu
u
C
Cr
ri
is
st
ta
a,
,
C
C
ă
ă
t
t
ă
ă
li
l
in
n
Ţ
Ţ
ui
u
ic
ca
an
n
„Tibiscus” University of Timi
ş
oara
ABSTRACT: The goal of this paper is to offer a full support for universities and quality assessment committees in retrieving the feedback from their students regarding to their teaching staff. The computer based application presented before ([Cri07]) collects data from the students. Another part of the application, presented in this paper, processes this data and presents the statistical results concerning each teacher.
KEYWORDS: online evaluation, students, teaching staff, quality assessment.
Introduction
Based on the 222/2008 Project implemented by the Faculty of Computers
and Applied Computer Science from the “Tibiscus” University, winner of
the 2007 Tibiscus Research Competition, the
Online Evaluation
([Ara06,
Cri07, Dra09, TKS08]) is a computer based program that allows:
•
For students, to evaluate their teachers;
•
For teachers, to be evaluated and to obtain a statistical processed
result of the evaluation;
•
For quality assessment committee, to validate the evaluations and to
perform a statistical processing of the valid results;
•
For faculties/universities management, to obtain a feed-back from
their students and to apply adequate measures to increase the quality
of the educational process.
Anale. Seria Informatică. Vol. VII fasc. 1 – 2009 Annals. Computer Science Series. 7th Tome 1st Fasc. – 2009
•
The scientific competence (12 items);
•
The psycho pedagogical competence (20 items);
•
The psychosocial competence (13 items);
•
The managerial competence (13 items).
Collected Data
The application uses a MySQL Database including a ‘rezultate” table
([TKS08]) containing the students’ answers to the questionnaire. Only the
complete questionnaires (58 answers) are memorized into the table so only
the valid records are included to further processing.
This database table contains an ID for the questionnaire (to maintain
an order of the records), a time indicator (shows the moment of the
evaluation), an ID of the evaluated teacher (all answers are included in the
same database) and 58 marks (representing the students’ answers: 1=very
poor, 2=poor, 3=medium, 4=good, 5=very good).
Each student can see his own answers but cannot see others
questionnaires. Only the systems’ administrator can see the entire database
and he also can ask the application to make the statistical processing for a
specified teacher.
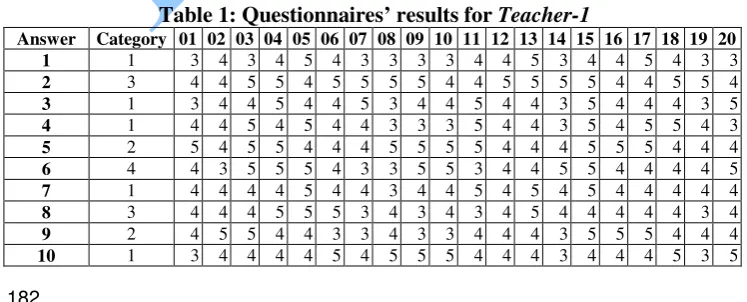
Processed Data
The 58 answers memorized into the database refer to four different
competencies of the teacher. Let’s start with the results for
Teacher-1
presented in Table 1, selected from the entire database using a filter
conditioned by the teachers’ ID:
Table 1: Questionnaires’ results for
Teacher-1
Answer Category 01 02 03 04 05 06 07 08 09 10 11 12 13 14 15 16 17 18 19 20
1 1 3 4 3 4 5 4 3 3 3 3 4 4 5 3 4 4 5 4 3 3
2 3 4 4 5 5 4 5 5 5 5 4 4 5 5 5 5 4 4 5 5 4
3 1 3 4 4 5 4 4 5 3 4 4 5 4 4 3 5 4 4 4 3 5
4 1 4 4 5 4 5 4 4 3 3 3 5 4 4 3 5 4 5 5 4 3
5 2 5 4 5 5 4 4 4 5 5 5 5 4 4 4 5 5 5 4 4 4
6 4 4 3 5 5 5 4 3 3 5 5 3 4 4 5 5 4 4 4 4 5
7 1 4 4 4 4 5 4 4 3 4 4 5 4 5 4 5 4 4 4 4 4
Anale. Seria Informatică. Vol. VII fasc. 1 – 2009 Annals. Computer Science Series. 7th Tome 1st Fasc. – 2009
Answer Category 01 02 03 04 05 06 07 08 09 10 11 12 13 14 15 16 17 18 19 20
11 3 4 4 3 4 5 3 4 3 5 4 4 4 4 4 5 4 4 4 3 5
12 4 4 5 5 4 5 5 4 4 5 5 5 5 5 5 5 4 5 5 4 5
13 1 5 5 5 5 4 5 4 5 5 5 5 5 4 3 5 4 5 5 5 4
14 3 4 4 4 5 5 4 3 5 4 3 5 4 4 4 3 4 4 4 4 4
15 2 4 3 3 4 5 4 4 4 4 4 5 4 4 4 5 4 4 4 4 4
16 3 4 4 3 4 5 5 4 5 3 5 5 3 4 4 5 4 4 5 4 3
17 4 3 4 5 5 5 5 5 4 5 5 4 4 5 4 5 5 5 4 4 4
18 2 4 4 5 5 4 4 4 3 5 4 4 4 4 4 5 4 4 5 4 4
19 3 4 4 5 5 4 4 5 5 5 4 4 4 4 4 4 5 4 4 4 4
20 2 5 5 4 5 4 3 3 3 4 5 4 4 5 4 4 4 5 5 5 5
21 1 4 5 4 4 5 3 4 3 4 3 5 3 5 4 5 4 5 4 5 5
22 4 3 4 5 5 5 5 4 4 3 5 4 4 5 5 5 4 5 4 5 4
23 2 4 4 5 4 4 4 4 5 4 4 5 4 4 4 5 4 5 5 5 4
24 4 5 4 5 5 5 5 5 5 3 5 5 5 4 5 5 4 5 5 5 3
25 1 4 4 3 4 5 3 5 3 3 4 4 3 4 3 5 4 4 5 4 4
26 3 4 4 4 5 5 4 5 5 3 5 3 4 4 4 5 5 4 5 4 4
27 2 5 4 4 5 5 4 4 4 3 4 4 4 5 4 5 4 5 4 4 4
28 1 3 5 5 5 5 3 4 5 4 3 4 4 5 3 4 4 3 3 4 4
29 4 5 4 4 5 5 3 4 4 3 5 3 5 5 4 4 4 4 4 4 4
30 3 4 4 4 5 4 5 5 5 4 5 4 4 5 4 5 4 4 5 4 4
31 4 4 4 3 5 5 4 5 4 4 4 3 4 4 4 5 3 4 5 4 4
32 2 4 5 4 4 4 5 4 4 4 3 4 4 4 4 5 4 5 4 4 4
33 1 4 4 5 4 4 3 4 3 3 5 4 3 4 3 4 4 4 4 5 5
34 4 4 4 5 5 5 5 4 3 4 5 4 4 5 4 5 4 5 4 5 5
35 3 3 5 4 5 4 4 5 5 3 4 4 5 4 5 5 5 4 4 4 5
36 3 4 4 5 5 5 5 5 5 5 3 5 4 4 5 4 4 4 3 4 4
37 4 5 4 5 4 4 4 4 3 5 5 4 4 4 5 5 4 5 4 4 3
38 2 4 4 4 4 4 4 4 3 4 5 5 4 4 4 5 5 5 5 4 4
39 4 3 4 5 5 4 5 4 4 4 3 5 4 4 4 5 4 5 4 4 5
40 1 4 4 5 5 4 4 4 4 4 5 5 4 5 5 5 3 4 4 4 5
41 4 4 4 5 5 4 5 5 3 4 5 5 4 4 4 5 4 5 4 4 4
42 2 4 3 3 4 5 3 3 3 3 5 5 3 4 3 5 4 4 3 3 4
43 1 4 4 5 5 5 3 5 4 4 4 5 4 4 4 5 5 5 5 5 5
44 3 5 5 5 5 4 5 5 5 5 5 5 4 5 4 5 4 5 4 4 4
45 4 4 4 4 5 4 3 4 4 4 5 5 5 5 4 4 4 5 4 4 5
46 2 5 4 5 5 5 5 5 5 5 4 5 5 5 4 5 4 5 5 4 5
47 2 5 5 5 4 5 4 4 5 4 5 5 5 5 4 4 3 5 5 4 4
48 3 5 5 5 5 5 5 4 5 5 5 5 5 5 5 4 4 5 5 4 5
49 2 4 5 5 5 5 5 5 5 5 5 4 4 4 4 4 4 5 4 4 5
50 2 5 5 4 5 5 4 5 5 5 5 5 4 4 5 4 4 5 5 5 5
51 2 5 5 5 4 5 5 4 5 4 5 5 4 5 4 5 5 5 5 5 4
52 2 5 5 4 5 4 5 4 5 4 5 5 5 5 5 5 5 5 4 5 4
53 2 5 4 5 5 5 4 4 5 4 4 4 4 4 5 5 5 5 5 5 4
54 2 5 5 5 4 5 5 5 5 5 5 5 5 4 5 5 5 4 5 5 5
55 3 4 4 4 5 4 5 5 5 5 4 4 5 5 4 5 4 5 4 5 5
56 2 5 5 4 5 5 5 5 5 5 4 4 4 5 5 5 4 5 5 5 5
57 4 5 5 5 4 5 4 5 5 4 5 5 4 5 4 5 4 5 5 5 5
Anale. Seria Informatică. Vol. VII fasc. 1 – 2009 Annals. Computer Science Series. 7th Tome 1st Fasc. – 2009
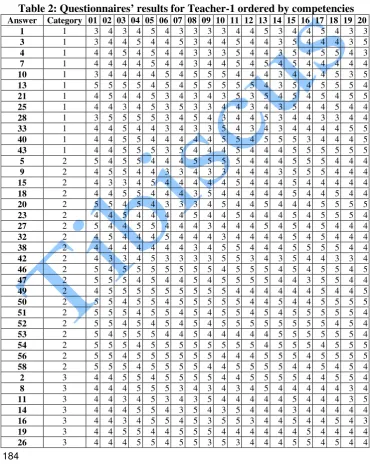
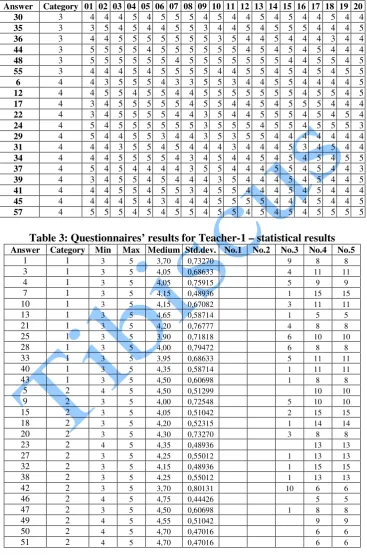
Results
So, first processing step is to order the answers according to the competence
(Table 2) and then to obtain some statistical parameters ad minimum and
maximum, medium value, standard deviation, number of different results
(Table 3).
Table 2: Questionnaires’ results for Teacher-1 ordered by competencies
Answer Category 01 02 03 04 05 06 07 08 09 10 11 12 13 14 15 16 17 18 19 201 1 3 4 3 4 5 4 3 3 3 3 4 4 5 3 4 4 5 4 3 3
3 1 3 4 4 5 4 4 5 3 4 4 5 4 4 3 5 4 4 4 3 5
4 1 4 4 5 4 5 4 4 3 3 3 5 4 4 3 5 4 5 5 4 3
7 1 4 4 4 4 5 4 4 3 4 4 5 4 5 4 5 4 4 4 4 4
10 1 3 4 4 4 4 5 4 5 5 5 4 4 4 3 4 4 4 5 3 5
13 1 5 5 5 5 4 5 4 5 5 5 5 5 4 3 5 4 5 5 5 4
21 1 4 5 4 4 5 3 4 3 4 3 5 3 5 4 5 4 5 4 5 5
25 1 4 4 3 4 5 3 5 3 3 4 4 3 4 3 5 4 4 5 4 4
28 1 3 5 5 5 5 3 4 5 4 3 4 4 5 3 4 4 3 3 4 4
33 1 4 4 5 4 4 3 4 3 3 5 4 3 4 3 4 4 4 4 5 5
40 1 4 4 5 5 4 4 4 4 4 5 5 4 5 5 5 3 4 4 4 5
43 1 4 4 5 5 5 3 5 4 4 4 5 4 4 4 5 5 5 5 5 5
5 2 5 4 5 5 4 4 4 5 5 5 5 4 4 4 5 5 5 4 4 4
9 2 4 5 5 4 4 3 3 4 3 3 4 4 4 3 5 5 5 4 4 4
15 2 4 3 3 4 5 4 4 4 4 4 5 4 4 4 5 4 4 4 4 4
18 2 4 4 5 5 4 4 4 3 5 4 4 4 4 4 5 4 4 5 4 4
20 2 5 5 4 5 4 3 3 3 4 5 4 4 5 4 4 4 5 5 5 5
23 2 4 4 5 4 4 4 4 5 4 4 5 4 4 4 5 4 5 5 5 4
27 2 5 4 4 5 5 4 4 4 3 4 4 4 5 4 5 4 5 4 4 4
32 2 4 5 4 4 4 5 4 4 4 3 4 4 4 4 5 4 5 4 4 4
38 2 4 4 4 4 4 4 4 3 4 5 5 4 4 4 5 5 5 5 4 4
42 2 4 3 3 4 5 3 3 3 3 5 5 3 4 3 5 4 4 3 3 4
46 2 5 4 5 5 5 5 5 5 5 4 5 5 5 4 5 4 5 5 4 5
47 2 5 5 5 4 5 4 4 5 4 5 5 5 5 4 4 3 5 5 4 4
49 2 4 5 5 5 5 5 5 5 5 5 4 4 4 4 4 4 5 4 4 5
50 2 5 5 4 5 5 4 5 5 5 5 5 4 4 5 4 4 5 5 5 5
51 2 5 5 5 4 5 5 4 5 4 5 5 4 5 4 5 5 5 5 5 4
52 2 5 5 4 5 4 5 4 5 4 5 5 5 5 5 5 5 5 4 5 4
53 2 5 4 5 5 5 4 4 5 4 4 4 4 4 5 5 5 5 5 5 4
54 2 5 5 5 4 5 5 5 5 5 5 5 5 4 5 5 5 4 5 5 5
56 2 5 5 4 5 5 5 5 5 5 4 4 4 5 5 5 4 5 5 5 5
58 2 5 5 5 4 5 5 5 5 4 4 5 5 5 5 4 4 5 4 5 4
2 3 4 4 5 5 4 5 5 5 5 4 4 5 5 5 5 4 4 5 5 4
8 3 4 4 4 5 5 5 3 4 3 4 3 4 5 4 4 4 4 4 3 4
11 3 4 4 3 4 5 3 4 3 5 4 4 4 4 4 5 4 4 4 3 5
Anale. Seria Informatică. Vol. VII fasc. 1 – 2009 Annals. Computer Science Series. 7th Tome 1st Fasc. – 2009
Answer Category 01 02 03 04 05 06 07 08 09 10 11 12 13 14 15 16 17 18 19 20
30 3 4 4 4 5 4 5 5 5 4 5 4 4 5 4 5 4 4 5 4 4
35 3 3 5 4 5 4 4 5 5 3 4 4 5 4 5 5 5 4 4 4 5
36 3 4 4 5 5 5 5 5 5 5 3 5 4 4 5 4 4 4 3 4 4
44 3 5 5 5 5 4 5 5 5 5 5 5 4 5 4 5 4 5 4 4 4
48 3 5 5 5 5 5 5 4 5 5 5 5 5 5 5 4 4 5 5 4 5
55 3 4 4 4 5 4 5 5 5 5 4 4 5 5 4 5 4 5 4 5 5
6 4 4 3 5 5 5 4 3 3 5 5 3 4 4 5 5 4 4 4 4 5
12 4 4 5 5 4 5 5 4 4 5 5 5 5 5 5 5 4 5 5 4 5
17 4 3 4 5 5 5 5 5 4 5 5 4 4 5 4 5 5 5 4 4 4
22 4 3 4 5 5 5 5 4 4 3 5 4 4 5 5 5 4 5 4 5 4
24 4 5 4 5 5 5 5 5 5 3 5 5 5 4 5 5 4 5 5 5 3
29 4 5 4 4 5 5 3 4 4 3 5 3 5 5 4 4 4 4 4 4 4
31 4 4 4 3 5 5 4 5 4 4 4 3 4 4 4 5 3 4 5 4 4
34 4 4 4 5 5 5 5 4 3 4 5 4 4 5 4 5 4 5 4 5 5
37 4 5 4 5 4 4 4 4 3 5 5 4 4 4 5 5 4 5 4 4 3
39 4 3 4 5 5 4 5 4 4 4 3 5 4 4 4 5 4 5 4 4 5
41 4 4 4 5 5 4 5 5 3 4 5 5 4 4 4 5 4 5 4 4 4
45 4 4 4 4 5 4 3 4 4 4 5 5 5 5 4 4 4 5 4 4 5
57 4 5 5 5 4 5 4 5 5 4 5 5 4 5 4 5 4 5 5 5 5
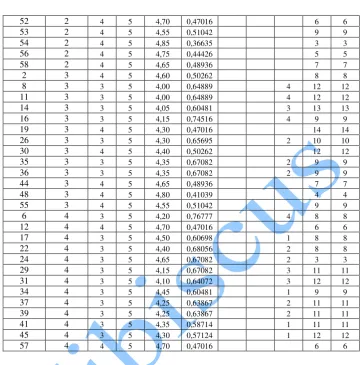
Table 3: Questionnaires’ results for Teacher-1 – statistical results
Answer Category Min Max Medium Std.dev. No.1 No.2 No.3 No.4 No.51 1 3 5 3,70 0,73270 9 8 8
3 1 3 5 4,05 0,68633 4 11 11
4 1 3 5 4,05 0,75915 5 9 9
7 1 3 5 4,15 0,48936 1 15 15
10 1 3 5 4,15 0,67082 3 11 11
13 1 3 5 4,65 0,58714 1 5 5
21 1 3 5 4,20 0,76777 4 8 8
25 1 3 5 3,90 0,71818 6 10 10
28 1 3 5 4,00 0,79472 6 8 8
33 1 3 5 3,95 0,68633 5 11 11
40 1 3 5 4,35 0,58714 1 11 11
43 1 3 5 4,50 0,60698 1 8 8
5 2 4 5 4,50 0,51299 10 10
9 2 3 5 4,00 0,72548 5 10 10
15 2 3 5 4,05 0,51042 2 15 15
18 2 3 5 4,20 0,52315 1 14 14
20 2 3 5 4,30 0,73270 3 8 8
23 2 4 5 4,35 0,48936 13 13
27 2 3 5 4,25 0,55012 1 13 13
32 2 3 5 4,15 0,48936 1 15 15
38 2 3 5 4,25 0,55012 1 13 13
42 2 3 5 3,70 0,80131 10 6 6
46 2 4 5 4,75 0,44426 5 5
47 2 3 5 4,50 0,60698 1 8 8
49 2 4 5 4,55 0,51042 9 9
50 2 4 5 4,70 0,47016 6 6
Anale. Seria Informatică. Vol. VII fasc. 1 – 2009 Annals. Computer Science Series. 7th Tome 1st Fasc. – 2009
52 2 4 5 4,70 0,47016 6 6
53 2 4 5 4,55 0,51042 9 9
54 2 4 5 4,85 0,36635 3 3
56 2 4 5 4,75 0,44426 5 5
58 2 4 5 4,65 0,48936 7 7
2 3 4 5 4,60 0,50262 8 8
8 3 3 5 4,00 0,64889 4 12 12
11 3 3 5 4,00 0,64889 4 12 12
14 3 3 5 4,05 0,60481 3 13 13
16 3 3 5 4,15 0,74516 4 9 9
19 3 4 5 4,30 0,47016 14 14
26 3 3 5 4,30 0,65695 2 10 10
30 3 4 5 4,40 0,50262 12 12
35 3 3 5 4,35 0,67082 2 9 9
36 3 3 5 4,35 0,67082 2 9 9
44 3 4 5 4,65 0,48936 7 7
48 3 4 5 4,80 0,41039 4 4
55 3 4 5 4,55 0,51042 9 9
6 4 3 5 4,20 0,76777 4 8 8
12 4 4 5 4,70 0,47016 6 6
17 4 3 5 4,50 0,60698 1 8 8
22 4 3 5 4,40 0,68056 2 8 8
24 4 3 5 4,65 0,67082 2 3 3
29 4 3 5 4,15 0,67082 3 11 11
31 4 3 5 4,10 0,64072 3 12 12
34 4 3 5 4,45 0,60481 1 9 9
37 4 3 5 4,25 0,63867 2 11 11
39 4 3 5 4,25 0,63867 2 11 11
41 4 3 5 4,35 0,58714 1 11 11
45 4 3 5 4,30 0,57124 1 12 12
57 4 4 5 4,70 0,47016 6 6
Next, data are aggregated depending on the competence and, again,
the statistical parameters as minimum and maximum, medium value,
standard deviation, number of different results are determined; further, the
general results are processed (Table 4):
Table 4: Questionnaires’ results for Teacher-1 – aggregated results
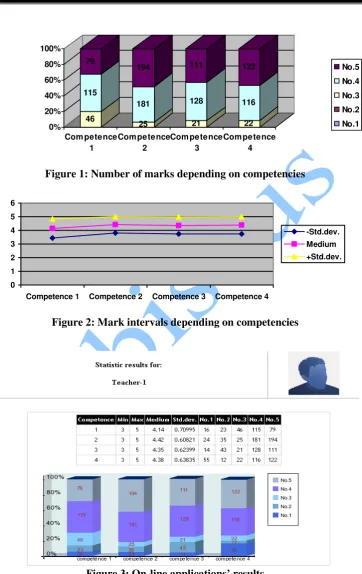
Category Min Max Medium Std.dev. No.1 No.2 No.3 No.4 No.51 3 5 4,14 0,70995 46 115 79
2 3 5 4,42 0,60821 25 181 194
3 3 5 4,35 0,62399 21 128 111
4 3 5 4,38 0,63835 22 116 122
TOTAL 3 5 4,34 0.64857 114 540 506
Anale. Seria Informatică. Vol. VII fasc. 1 – 2009 Annals. Computer Science Series. 7th Tome 1st Fasc. – 2009
46 115
79
25 181 194
21 128 111
22 116 122
0% 20% 40% 60% 80% 100%
Com petence 1
Com petence 2
Com petence 3
Com petence 4
No.5 No.4 No.3
No.2 No.1
Figure 1: Number of marks depending on competencies
0 1 2 3 4 5 6
Competence 1 Competence 2 Competence 3 Competence 4
-Std.dev. Medium +Std.dev.
Figure 2: Mark intervals depending on competencies
Anale. Seria Informatică. Vol. VII fasc. 1 – 2009 Annals. Computer Science Series. 7th Tome 1st Fasc. – 2009