Assessing effects of deficit irrigation techniques on water productivity of
tomato for subsurface drip irrigation system
Mahmoud S Hashem
1,2*, Tarek Zin El-Abedin
1,3, Hussein M Al-Ghobari
1(1. Agricultural Engineering Department, College of Food and Agriculture Sciences, King Saud University, Riyadh 11451, Saudi Arabia; 2. Agricultural Engineering Research Institute (AEnRI), Agricultural Research Center, Giza, Egypt;
3. Agricultural Engineering Department, College of Agriculture, Alexandria University, Alexandria, Egypt)
Abstract: Water resources are subjected to ever-increasing supply constraints due to extensive agricultural water demand for irrigated lands. Therefore, water-saving irrigation strategies need to be explored. The present study was conducted to explore the possibilities of using regulated deficit irrigation (RDI) and partial root zone drying irrigation (PRD) methods as water-saving irrigation techniques for subsurface irrigation. The objective of this study are to assess the effects of RDI and PRD irrigation on the water productivity of vegetable crops (tomato) under SSD systems in arid climatic conditions, and to compare the responses of tomato crops to PRD, RDI, and FI under an SSD system in terms of productivity, crop quality, and the amount of water saved. The field experiment was conducted during the fall 2014-2015 and 2015-2016 seasons in an experimental field located on an educational farm owned by the Faculty of Food and Agriculture Sciences Department, King Saud University, Riyadh, Kingdom of Saudi Arabia. An area of 102.7 m2 (13 m × 7.9 m) was allocated for the experiment to
manage three treatments: RDI, PRD, and full irrigation (FI). The RDI and PRD treatments received 70% of the irrigation water volume of FI. Each was replicated three times. The most important results indicated that the soil water content (SWC) for the RDI and PRD treatments was lower than that of the FI treatments. FI had the highest stomatal conductance values (gs), while PRD had the lowest stomatal conductance values. The photosynthetic rate (An) was lower under RDI and PRD
compared to FI. However, there was no significant change in An between treatments for most readings taken during both time
periods, which means that the water saving treatments (PRD and RDI) did not affect the net photosynthesis rate, thereby enhancing irrigation water use efficiency (IWUE) under DI treatments. The water-saving irrigation techniques decreased transpiration rate (T) compared to the FI treatment. The values of the abscisic acid (ABA) contents were higher under PRD and RDI than FI. The marketable yield under the FI treatment yielded the highest values. The fruit quality parameter results showed that the RDI and PRD treatments increased the total soluble solids, vitamin C, and titratable acidity of tomato compared to the FI treatment. Most of the minimum IWUE values were associated with FI. These results indicate the effects of deficit levels on IWUE.
Keywords: full irrigation (FI), regulated deficit irrigation (RDI), partial root zone drying (PRD), irrigation water use efficiency (IWUE)
DOI: 10.25165/j.ijabe.20181104.3846
Citation: Hashem M S, El-Abedin T Z, Al-Ghobari H M. Assessing effects of deficit irrigation techniques on water productivity of tomato for subsurface drip irrigation system. Int J Agric & Biol Eng, 2018; 11(4): 156–167.
1 Introduction
The main user of water resources is irrigated agricultural land, which consumes approximately 70% of the total water withdrawal[1]. However, the irrigated land area must be increased
by more than 20% and that all irrigated crop yield must be increased by 40% by year of 2025 to secure the food for 8 billion people[2]. Therefore, water resources should be used with a higher
degree of efficiency or productivity. Improvement in agricultural water management is the best way to increase the utilization of limited water resources. Applying efficient water management strategies is critical to increasing water productivity. In addition
Received date: 2017-09-22 Accepted date: 2018-03-16
Biographies: Tarek Zin El-Abedin, Professor, research interests: irrigation systems engineering and water management, Email: tkamalzein@ksu.edu.sa; Hussein M Al-Ghobari, Professor, research interests: irrigation systems engineering and water management, Email: hghobari@ksu.edu.sa.
*Corresponding author: Mahmoud S Hashem, Research Assistant, research interests: Irrigation systems engineering and water management. Mailing address: 13747 Aljafra, Qalubia, Egypt. Tel: +20-1119896517, Email: mahmoudsabry375@gmail.com.
to the assessment of crop management strategies, the improvement of irrigation systems and schemes can lead to more efficient and sustainable agricultural water management[3].
Subsurface drip irrigation (SSD) is a new and highly efficient irrigation method that is well suited for arid land environments. SSD involves the application of water below the soil surface through emitters, and features discharge rates generally in the same range as drip irrigation[4]. SSD has been proven to be an efficient
irrigation method capable of offering the following advantages: high water use efficiency (WUE), lower soil erosion, fewer weed and disease problems, efficient fertilizer application, design flexibility, maintenance of dry areas for tractor movement at any time, lower labor costs than conventional drip irrigation systems, reduced evaporation and deep percolation losses, and surface runoff elimination. In addition, SSD can be a suitable irrigation method in arid and semi-arid regions because of its potential to precisely apply water and nutrients through a field both in quantity and position. However, there are also potential disadvantages with SSD; these disadvantages involve poor or uneven surface wetting and risky crop establishment[5,6].
irrigation (PRD) are water-saving irrigation methods that reduce the amount of irrigation provided to crops. The amount of irrigation reduction is crop-dependent and is generally accompanied by no or minor yield losses, which increases the productivity of the water. RDI and PRD strategies require the ability to control both the amount and the placement of irrigation water, in order to maintain a desired soil moisture deficit for all or part of the crop-growing season. PRD differs from RDI in that it simultaneously maintains both a wet and a dry portion of the root zone, whereas RDI strategies create a moisture deficit throughout the root zone[7].
The benefits of PRD are based on two theoretical premises[8].
The first is that fully irrigated plants usually have widely opened stomata. A small narrowing of the stomatal opening may substantially reduce water loss and have a minor effect on photosynthesis. The second premise is that in the location where part of the root system is in dry soil, the plant will respond by sending a root-sourced signal to the shoots where stomata may be inhibited, thus reducing the water loss. Stikić et al.[9] reported that
the potential benefits of deficit irrigation (DI) methods include increased WUE, reduced irrigation and production costs, control of vegetative growth and canopy density, increases in nutrient use efficiency (especially N), and improvement in fruit or yield quality (tomato, grape, potato, pepper, apple, maize, etc.).
Hossein et al.[10] reported that transpiration efficiency (TE)
increased by increasing the degree of water stress. Moutonnet et al.[11] pointed out that the impact of DI on crop yield can be
insignificant where water stress is applied to the crop during specific growth stages that are less sensitive to moisture deficiency. In an experiment on watermelon, Özmen et al.[12] concluded that
yield and quality were not significantly affected by DI. In addition, Hossein et al.[10] showed that PRD and RDI strategies
with mild and severe water stress did not affect the growth of pomegranate fruits. Veit-Köhler et al.[13] found that small
reductions in water supply resulted in higher quality tomato due to higher concentrations of sugars, titratable acidity (TA), and vitamin C (VC). Nangare et al.[14] reported that although regulated DI did
not affect the yield at RDI with 80% from FI, there was a loss of approximately one fourth of the marketable fruit yield with RDI with 60% from FI compared to the FI. In addition, they concluded that the quality parameters of the tomatoes, such as hardness, total soluble solid (TSS), acidity, and color, were considerably improved by DI.
Many vegetable crops have high water requirements, and in most countries, irrigation is necessary for the successful production of vegetable crops. Research has focused on achieving a better understanding of crop physiology and management in arid climatic conditions, with the aim of improving the water efficiency of plants in those regions. Tomatoes (Solanum lycopersicum L) are one of the most common and important types of vegetables in the world, and they have high water requirements. In Saudi Arabia, tomato crops are usually grown during the fall and spring seasons, and are considered to be the largest crop in that country[15]. Improved
irrigation methods can conserve water without compromising yield or quality. The objective of this study as mentioned in the abstract.
2 Materials and methods
The experiment was conducted in an experimental field located on an educational farm owned by the Faculty of Food and Agriculture Sciences at King Saud University in Riyadh, Kingdom of Saudi Arabia. The site is located at 24.44°N, 46.36°E, and an elevation of approximately 665 m above sea level, and the climate is typical of arid areas. The soil was prepared according to the standard methods for plowing, grading, and leveling.
The soil of the experimental site was sandy loam. Soil samples were taken every 20 cm up to a total depth of 60 cm in order to perform physical and chemical analyses according to standard methods[16]. The physical analysis investigation includes
soil texture, field capacity (FC), wilting point (WP), saturated
hydraulic conductivity (KS), saturation moisture content (Sat), and
bulk density (ρb). The chemical analyses examined anions; cations, (pH); electrical conductivity (EC); organic matter; total N content; and available N, P, and K. Physical, chemical, fertility, and organic properties of soil are listed in Tables 1-3.
Table 1 Physical properties of soil
Depth/ cm
Particle size/%
Texture FC/% WP/% KS/mm·h-1 Sat/% ρb/g·cm-3 pH EC
Sand Silt Clay
0-60 69.20 17.55 13.24 Sandy loam 22.97 12.97 26.00 40.13 1.63 7.45 2.9
Table 2 Fertility-related properties of soil
Depth/cm CaCO3/%
Fertility/mg·kg-1
Organic matter/%
N P K
0-60 18.68 16.00 0.57 61.43 0.09
Table 3 Chemical properties of soil
Depth /cm
Cation/meq·L-1 Anions/meq·L-1
Ca2+ Mg2+ Na+ K+ HCO
3- CO3- CI- SO4
-0-60 11.73 3.87 10.96 0.47 1.27 0.00 11.00 24.77 An area of 102.7 m2 (13 m×7.9 m) was allocated for the
experiment to manage three treatments, each of which was repeated three times. A subsurface drip was applied to the established field, which was divided into three plots. Each plot was divided into three rows, and each row contained 26 plants spaced 0.5 m apart as shown in Figure 1. The drip line was buried at a soil depth of 0.1
Figure 1 Experimental layout Implementing PRD irrigation systems necessitates that every
row of vegetables be served by dual dripper lines, each of which was operated independently. The irrigation under PRD treatment was shifted from one side of the plants to the other every seven days[17], in order to achieve a long-term PRD effect on abscisic acid
(ABA) signaling, leaf gas exchange, and WUE in tomato crop. The irrigation operation was automatically controlled through a Rain Bird automatic controller (ESP – LXME controllers). This controller was connected to computer software that connected with computer software manufactured by Rain Bird Corporation in the US (Q™ V2.0 Central Control Software) that monitored and adjusted the watering schedules for the controllers and the site from a compatible Windows® PC. The water requirement for irrigation was calculated automatically as potential crop evapotranspiration (ETC) from the ETo FAO Penman–Monteith
equation based on climatic data obtained from a meteorological station[18]. The standard Kc for every growth stage (initial, middle,
and end) of the tomato crop was taken from FAO-56.
To monitor the soil moisture content in the experiments, we used capacitance probes from Australia Corporation called Sentek Technologies. These probes are EnviroSCAN™ probes, and each one includes five sensors installed at depths of 10 cm, 20 cm, 30 cm, 40 cm, and 50 cm. We installed four EnviroSCAN devices in the field. We used one EnviroSCAN device for the treatments that utilize a single drip line (FI and RDI), and two EnviroSCAN devices for the treatment that utilizes dual drip lines (PRD). The two devices were placed 40 cm apart in a diagonal direction. The soil water data is sampled at a certain frequency, which was set at every 15 min between readings in this experiment. The data is then stored in the custom built EnviroSCAN™ logging system.
The experiment was conducted during the 2014–2015 and 2015–2016 fall seasons, and the subject crop was tomato (Lycopersicon esculentum L). The tomato is an herbaceous plant that grows above the surface of soil. Tomato seeds were germinated in Jiffy 7 pellets (one seed per pellet) in a greenhouse under a controlled environment, and the seed was planted four weeks before transferring to the open field. The greenhouse is located in the Dirab area near Riyadh, in the research and agricultural experiments center at the College of Food and Agriculture Sciences, King Saud University. The pellets were observed every day for their ability to maintain moisture and to
observe whether any problems occurred. After four weeks, the seedlings were transferred to the sustainable land on the experimental field after the field-preparation steps were completed (watering, lining, digging, etc.). The planting distance was 50 cm within the line, and 70 cm between lines.
The actual planting date in the first year was September 23, 2015, and harvesting occurred from December 19, 2015, to January 23, 2016. In the second year, the actual planting date was September 23, 2016, and the harvesting period was from December 25, 2016, to January 25, 2017. The period of growth was divided into four growth stages as shown in the in Table 4.
Table 4 Time of every growth stage (d)
Initial Development Mid-season Late season
26 30 30 38
Common cultural practices regarding fertilizer application and insect and disease control were implemented. The tomato crop was harvested seven times in the 1st year and eight times in the 2nd
year. We manually collected the fruits from each line, weighed them, and then counted them to find the fresh weight of the fruit per plant.
After starting treatments for tomato, the stomatal conductance (gs) (mol/m2·s), net photosynthesis rate (A
n) (μmol/m2·s), and
transpiration rate (T) (mmol/m2·s) were measured using a
LI-6400XT portable photosynthesis system (LiCor Inc., Lincoln, Nebraska, USA). These measurements were taken six times (from November 11, 2015, to December 16, 2015) during the treatments period for the 1st year, and six times (from November 23,
2016, to December 28, 2016) during the treatment period for the 2nd year. The gas-exchange measurements were taken for each
plot and three replicates were taken from each plot. The measurements were taken between 6:00-12:00 AM local time. Within each plot, third fully expanded upper canopy leaflets were chosen for measurements. A total of nine plants were sampled per round, which took approximately a half hour to complete.
In order to collect the xylem Abscisic Acid [ABA] sample from the tomatoes, a new and promising approach was adopted, wherein xylem sap was collected from the cut stems[19]. One
sap was collected using an appropriate pipette. Previous studies have shown that this overpressure does not artificially change the xylem [ABA] (µmol/m3) due to a higher dilution of sap[17].
Xylem ABA samples were immediately frozen in liquid nitrogen and subsequently stored at −80ºC until analysis. All samples were used to determine ABA content through an enzyme-linked immunosorbent assay (ELISA)[20].
Fruit weight per plant and the total fresh fruit yields (all the collected fruits) were also determined. Harvest-ripe fruits were manually picked and weighed twice a week, starting on December 19 to the 1st year and December 25 to the 2nd year, and continued
until the end of the experiment to the both of them. The dry weight of the tomato fruits was determined after oven drying for 48 h at 80ºC. Therefore, the yield component characteristics included the following: total fresh fruit yield (Mg/hm2) and total
dry fruit yield (Mg/hm2).
Samples of five ripe fruits (from the third-fourth trusses) representing each sub-plot were picked for analysis of the fruit quality traits. These traits include TSS %, VC (mg/100 g FW), and TA%. An extract was obtained by blending and filtering the flesh of each fruit sample. TSS (%) was deliberated via a digital refractometer (PR-101 model, ATAGO, Japan). For determining TA, 10 g of extracted juice was taken and carefully mixed with 50 mL of distilled water. The mixture was then titrated with 0.1 N NaOH until the pH value reached 8.1. The volume of the sodium hydroxide added to the solution was multiplied by a correction factor of 0.064 to estimate TA as the percentage of citric acid equivalents in the fruit juice[21]. VC (mg/100 g FW, as
ascorbic acid) was measured in tomato extract using 2.6 dichlorophenol-indophenol dye[22]. TSS content (%) was also
determined by following standard analysis methods[23]. Therefore,
the fruit quality characteristics include the TSS %, VC (g/100 g FW), and total acidity (TA %).
The most important indicator of the benefit of any treatment is the irrigation water use efficiency (IWUE) as a function of yield (kg) (Y) and water consumption (m3) (WC). WC was measured
by the flow sensor installed in the field. Data taken from the present study were subjected to an analysis of variance (ANOVA) using the SPSS program. An LSD test at p<0.05 was applied to find any significant difference between irrigation treatment means.
3 Results and discussion
The soil water distribution of different patterns in response to tomato irrigation treatments (FI, RDI, and PRD) under SSD over two years was continuously monitored using EnviroSCAN probes. This offered a nondestructive and less tedious method for the continuous monitoring of water content within and below the root zone. Consequently, data were recorded for the soil water content values, which were plotted against days after initial planting. This period of time was divided into four growth stages as mentioned in Table 4, and as shown in Figures 2 and 3. The soil water content was measured at five soil depths (10 cm, 20 cm, 30 cm, 40 cm, and 50 cm), and the average soil water content of these depths was calculated and drawn as shown in Figures 3 and 4. The FC and permanent wilting point were also plotted simultaneously to show the status of plant stress due to irrigation treatment. In general, the initial stage and 85% of the developmental stage were nearly identical to each other, as shown in Figures 2 and 3 for the 1st and
2nd years respectively, whereas all treatments received the same
amount of water (100% of ET).
Figure 2 SWC distribution under different irrigation treatments in the 1st year
Obviously, the amount of soil water content in the root zone decreased immediately after the DI treatments were applied, which is less than the FI treatment. At the same time, the rate of the soil water content constantly decreased as the plant growth increased and consumed more water.
The soil water content data under different treatments showed different patterns of water distribution in response to watering tomato treatments (Figures 2 and 3). This was caused by the different amounts of water applied to each treatment and growth stage. The soil water content was influenced by root development and water extraction[24].
It can be seen from Figures 2 and 3 that the soil water content for the RDI and PRD treatments was lower than that for the FI treatments during the 1st and 2nd year. Over the two year period,
the daily soil water content of FI was close to the water FC. Correspondingly applied DI treatments result in decreasing soil water content and remained at approximately 17%-21% for the 1st
year, while it ranged between 18.5%-22% for the 2nd year.
Therefore, the soil water content in the PRD root-zone was alternately increased and decreased for both PRD lines in opposite directions (Figures 2 and 3).
Davies and Hartung[25] concluded that in the RDI technique, a
portion of the water volume is applied and some roots are exposed to drying soil. If not rewetted, these roots can die and signaling may diminish. However, in the PRD technique, a portion of the water volume is applied alternately to each half of the root system.
Half of the roots are exposed to drying soil at any one time before the irrigation is switched. Figures 2 and 3 show that the irrigation switch was applied every seven days to keep the roots alive, and signaling was sustained. Thus, the differences in soil water content between the PRD wet and dry sides were noticed during the DI treatment application. The results demonstrate that the soil water content in each PRD root-zone alternately increased and decreased. This result is in agreement with the results obtained by several earlier researchers on PRD[26,27]. A similar pattern of soil
water dynamics has also been observed in PRD-treated tomato and other crops[28]. A higher rate of water uptake in the last stage
could be a result of increased root contact area or improved root hydraulic conductivity after re-watering the dry side, as was shown by Kang et al.[29].
Figures 4 and 5 show the dry and wet curves, and the average between them represents PRD treatments in the 1st and 2nd year,
starting from the 1st day until the last day after transplanting. We
drew the dry curves by taking the soil moisture content measurements at the section of the roots that had been subjected to DI from the start of the deficit treatment until the last irrigation; we drew all these measurements as a dry curve, and then we drew the corresponding moisture curve. These figures illustrate that the average water content of the dry and wet sides of the PRD were close to that of the RDI treatment and slightly higher in all treatments except under SSD in the 2nd year, and thereby increasing
IWUE under this treatment as shown in Figure 13.
Figure 4 Dry and wet PRD curves, average PRD SWC curve, FI and RDI SWC distribution in 1st year
Figure 5 Dry and wet PRD curves, average PRD SWC curve, FI and RDI SWC distribution in the 2nd year
The un-watered side of the root zone in PRD showed a reduction in soil water content, but there was still enough water available on the wet side of the root zone to supply sufficient water
to the roots of the plant to maintain plant growth, although at a lower level compared to the FI treatment.
probes can also be used to determine the effective rainfall that has entered the soil profile. Soil water distribution figures showed the changes in the soil water content throughout the soil profile being monitored prior to and following rain. Thus, it was observed that there was rain 64 d after transplanting (DAT) in the 1st year and
68 DAT in the 2nd year.
The effect of irrigation treatments on stomatal conductance (gs) is shown in Figure 6. In the 1st year, the values of gs in different
irrigation treatments in this study varied mostly between 0.17- 0.96 mol/m2·s. In the 2nd year, the values of gs in different
irrigation treatments varied mostly between 0.32-0.88 mol/m2·s.
In both years, RDI and PRD showed stomatal conductance values lower than the FI treatment, as shown in Figure 6. This indicates their stomatal closure because the gs indicates the degree of stomatal opening. This may occur because of the lower water content in both the RDI and PRD than the FI treatment, as mentioned previously. Consequently, the stomatal conductance started to decrease when there was no water stress on the plant. Therefore, the gs considers a common and important plant response to soil drying. These results were consistent with the findings of Nardella et al.[30], who reported that the process of stomatal closure
was one of the first events in plant response to water stress and soil drying. Stomatal closure helped plants to prevent excessive water loss due to transpiration and led to better water balance. In the present study, the difference between PRD and RDI in regulating stomatal conductance was hardly detected, which is consistent with Liu et al.[31] and Wang et al.[32].
1st year
2nd year
Note: The data points represent mean ± standard error of the mean (n=3). Figure 6 Stomatal conductance for the irrigation treatments
During the 1st year, the RDI and PRD decreased gs by 33.22%
and 43.65%, respectively, compared to FI. In the 2nd year, the
results showed that the RDI and PRD decreased the average value
of gs by 5.21% and 11.3%, respectively. This indicated that FI
had the highest gs values, and the PRD had the lowest gs values of all treatments; however, it was not at 62 DAT at the 1st year. PRD
may have led to stomatal closure because the frequent changes in irrigation from one side of the plants to the other may have caused
a larger portion of the root system to be exposed to drying soil. This was indicated from the soil water content presented in Figures 2-5. The larger portion of roots exposed to drying soil with PRD may have resulted in more ABA arriving in the leaves and affecting stomatal opening, and thus reducing water loss.
Many studies indicate that it is possible to manipulate stomatal aperture and bring about an improvement in plant WUE under water-limited conditions[33,34,35].
In the 1st year, an ANOVA showed that was no significant
difference between RDI and PRD, but there was a significant difference (p>0.05) between DI treatments and FI at 62 d, 69 d, and 82 d after transplanting (DAT). In the 2nd year, it was not
significant effects to irrigation treatments on gs.
The results of the net photosynthesis rate (An) across the
measurements are shown in Figure 7. Generally, the Antrend
increased up to the mid-season, and then decreased and became constant for the two final readings. As we have seen, both years exhibited a similar pattern for which the third reading was the highest (as shown in Figure 7). During the 1st year, the average
values of An for different irrigation treatments varied mostly
between 29.9 and 8 µmol/m2·s. During the 2nd year, the average
An values for different irrigation treatments changed between 24.4
and 5.10 µmol/m2·s.
1st year
2nd year
Note: The data points represent mean ± standard error of the mean (n=3). Figure 7 Net photosynthesis rate for the irrigation treatments
The trend shown in Figure 7 is consistent with the plant growth curve; the first stage ended at 26 DAT, the development stage ended at 56 DAT, and the mid-season lasted for 30 d, so the trend of An as shown in Figure 7 decreased at the mid stage where the
fruit began to grow. It was observed that the water-saving irrigation techniques (RDI and PRD) decreased the average values of An compared to the FI treatment. In the 1st year, the values
were reduced by 10.53% and 20.42% for RDI and PRD, respectively, and in the 2nd year, the values were reduced by
14.61% and 12.64%.
The decrease in An under DI treatments may have occurred
was lower than that in the FI treatment, as mentioned previously. This resulted in an increase in stomatal aperture, which decreased the CO2 intake, which then decreased An under DI. Spence et al.
(1986) reported that the stomatal aperture decreases under water stress conditions, which causes a reduction in CO2 intake, which
decreases An under DI[36].
The results were consistent with previous studies[37], that
showed lower An values under drought stress conditions in tomato
plants. They concluded that the photosynthetic rate (An) was
affected by irrigation treatments. They also reported that for both RDI and PRD plants, An was lowered compared to FI. Yang et al.
(2012) pointed out that the PRD reduced the leaf photosynthetic rate of tomato by 4.5%-7.4% when compared to the FI treatment[38].
Obviously, there was no significant effect on An between
treatments at most readings taken over the two year period, which means that the water saving treatments (PRD and RDI) had no effect on the net photosynthesis rate. Therefore, WUE is enhanced under DI treatments.
Figure 8 shows the effects of the irrigation treatments on the transpiration rate (T) of the tomato plants over the two year period. The figure illustrates that RDI and PRD treatments decrease the transpiration rate. The T values in 1st year ranged between 1.00
and 4.4 mmol/m2·s. However, the T values in the 2nd year varied
from 1.32 to 4.2 mmol/m2·s. Generally, in both years, thetrend in
transpiration rate increased up to the mid-season and then decreased.
1st year
2nd year
Note: The data points represent means ± standard error of the mean (n=3). Figure 8 Transpiration rate for the irrigation treatments Figure 8 illustrates that the lowest value of the transpiration rate in the 1st year (1.00 mmol/m2·s) was observed with PRD.
However, the highest value (4.44 mmol/m2·s) was obtained with FI.
In the second year, the lowest value (1.32 mmol/m2·s) was obtained
with PRD, and the highest value (4.2 mmol/m2·s) was obtained
with FI. It was observed that the water saving irrigation
techniques (RDI and PRD) decreased the average value of T by 33.2% and 42.0%, respectively, in the 1st year, compared to the FI
treatment. In the 2nd year, the results showed that the
measurements under RDI and PRD decreased the average value of T by 13.11% and 19.7%, respectively, compared to the FI treatment. This occurred because the water content decreased under DI treatments, the ABA concentration increased and triggered the closure of stomata[39]. This curtailed the transpiration water loss
and increased WUE.
The results were consistent with previous studies[14,39], that
showed lower T values under drought stress conditions in tomato plants.
The summary of the ANOVAs showed that the PRD treatment resulted in the lowest transpiration rate among the treatments, but no significant difference between RDI and PRD was observed in terms of their effect on the transpiration rate over the two-year period. These results indicate that the RDI and PRD are good ways to reduce the transpiration rate, and thereby conserve water.
The effects of the irrigation treatments on the xylem ABA of tomatoes are shown in Figure 9. The results show that the water-saving treatments increased the ABA content of tomato crop when compared to the FI treatment.
Note: Different letters inside the columns showed significant differences between irrigation treatments at p<0.05. The bars indicate the means ± standard error of the mean (n=3).
Figure 9 Values of xylem [ABA] on December 1 (67 DAT) for the different irrigation treatments in both years
Figure 9 illustrates that the [ABA] content of tomato crop was the highest under the PRD treatment for both years. The RDI treatment, which received the same amount of irrigation water as the PRD treatment, had an intermediate [ABA] value that fell in-between the FI and PRD treatments; however, it was closer to PRD than to FI. During the 1st year, the xylem [ABA] for PRD
and RDI increased by 19.42% and 16.94% compared with FI, respectively. In the 2nd year, the xylem [ABA] values for PRD
and RDI exceeded FI by 14.23% and 9.21%, respectively.
This increase in ABA concentration occurred because the soil water status in the root zone under the PRD and RDI treatments was low compared to the FI treatments, and this significantly influenced the xylem [ABA] concentration in the xylem. The results were consistent with the findings obtained by Wang et al.[32],
who found a significant negative linear relationship between root water potential and the xylem [ABA] concentration.
Liu et al.[40] concluded that when the soil water deficit becomes
severe, hydraulic signals from the change in hydrostatic pressure become significant. This triggers synthesis of ABA in the leaves and may influence the control of the physiological responses of the plant to the drought through a decreased relative leaf expansion rate, gs, and leaf turgor, whereas it increased leaf ABA and xylem
greater detail to explain that alternative events in PRD allow for increased ABA concentration, and they reported that ABA pulses accumulated in the dry side during the dry period of alternation events[42]. Therefore, it was observed that the ABA concentration
under PRD was higher than RDI in most measurements taken in our study. Accumulated evidence has indicated that, given the same irrigation volume, PRD frequently results in higher ABA concentration in the xylem than RDI, which has been considered to contribute to better stomatal control over plant water use[43,44].
Partial stomatal closure and reduced leaf area occurred due to increased ABA. These are the main physiological responses to decreased transpiration in plants under PRD, which enhances WUE[45]. This confirmed earlier reports[46,47], that suggested ABA
may indeed be an important indicator of chemical signaling that can regulate stomatal control. An increased concentration of ABA in the xylem flowing to plant shoots triggers the closure of stomata[39], and thereby curtails the transpiration water loss and
increases WUE[48,44]. The ANOVA showed that there was a
significant response (p<0.05) to different irrigation treatments on [ABA] content in both years. The results are consistent with Kirda et al.[27], who reported that ABA content was consistently the
highest under PRD throughout the growth season. Akhtar et al.[37]
concluded that leaf ABA contents were higher under RDI and PRD compared to FI.
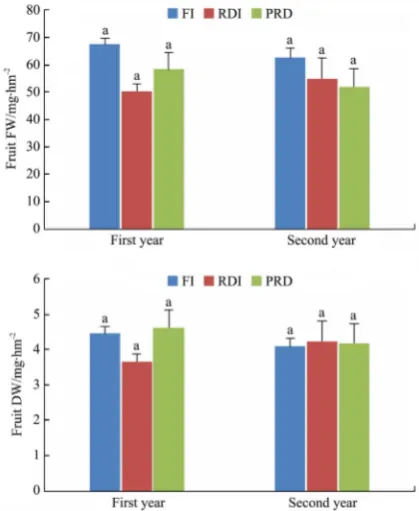
Fresh dry fruit tomato yield per hectare (FW, DW) for the different irrigation treatments are shown in Figure 10. Generally, the highest tomato fruit yield was obtained under the full irrigation (FI) treatment in the 1st and 2nd year.
Note: Different letters inside columns showed significant differences between irrigation treatments at p<0.05. Bars give the means ± standard error of the mean (n=3).
Figure 10 Fresh and dry fruit yield per hectare for the different irrigation treatments
The lowest fruit yield in the 1st year was obtained under RDI
(50.35 Mg/hm2), while in the 2nd year the lowest fruit yield was
obtained under PRD (52.05 Mg/hm2). During the 1st year, yield
reduction under RDI and PRD treatment was 23.48% and 13.43%, respectively. The yield reduction under RDI and PRD treatment in the 2nd year was 12.18% and 16.89%, respectively, compared
with FI.
The explanation for this reduction is that as the soil dries, the rate of root absorption falls short of the transpiration rate of the plant; this creates an internal water deficit that affects photosynthesis and results in reduced leaf area, cell size, and intercellular volume, which reduces soil moisture accumulation. This internal water deficit had a greater effect on the fruit growth stage, and at this time, the expanding fruit tissues require a great deal of water.
One can suppose that higher a fresh weight of FI fruits was the result of a longer ripening period that allowed for a higher accumulation of water compared to DI fruits[49]. The results
obtained by several researchers support the results obtained in this study. For example[50,27,22], pointed out that the marketable yield
under the FI treatment provided the highest values compared with RDI and PRD. Kuscu et al.[51] reported that the highest
marketable tomato yields were observed with FI, and decreasing the irrigation rate generally improved the dry matter of fresh tomato fruits. The potential of DI strategies to produce higher yields per unit of irrigation water applied has been highlighted by references [52, 53], however, when the tomato was exposed to water
stress beyond a certain level, it adversely affected the marketable yield[27,51].
According to dry fruit yield responses, the results showed that the DI treatments increased the dry fruit yield in most measurements in general. Obviously, the irrigation method had no effect on the dry fruit yield. The results obtained in the 1st year
showed that the dry fruit yield was the lowest for RDI (3.69 Mg/ha), and was the highest (4.62 Mg/hm2) for PRD, as shown in Figure 10.
The results in the 2nd year showed that the lowest value of dry fruit
yield was achieved with FI (4.10 Mg/hm2), and the highest value
was achieved with RDI (4.24 Mg/hm2). The water stress applied
to the crop led to an increase in dry matter and sugar concentrations of ripe fruit. These phenomena have been explained by the fact that water stress did not affect the quantity of dry matter accumulated by the fruit, although it greatly reduces its accumulation of water[54]. Ho et al.[55] explained this phenomenon
by an increase in the phloem sap concentration, as well as by a decrease in its flux, both resulting from a reduction in the water available in the plant. Because the phloem flux was largely responsible for the increase in tomato size[56], the decrease of this
flux accompanied by an increase in its sugar concentration resulted in fruits that were smaller but featured higher dry matter content.
ANOVAs in both years determined that drip irrigation methods (SD and SSD) and irrigation treatments had no significant effect (p>0.05) on fresh, dry fruit yield. Zegbe et al.[57] pointed out that
total fresh mass of fruit and total dry mass of fruit were not affected by the regime treatments. The reduced vegetative growth suggests that photosynthetic assimilates were predominantly partitioned to fruit growth so that significant yield reduction was prevented under RDI and the PRD treatments. To explain the minimal effect on yield imposed by DI treatments, it is suggested that chemical signals that limit vegetative growth do not reach the fruit due to a limited xylem connection between the shoot and the tomato fruit[45].
treatments could be attributed to a lower fruit water content, while the net dry matter accumulation was less affected, i.e., the lower water content in the stressed tomato fruits favor higher TSS.
In the first year, the results showed increasing TSS for RDI, followed by PRD (28.89% and 23.01%), respectively compared with FI. The second year showed that TSS with both RDI and PRD was increased by 8.82% and 15.87%, respectively, compared to FI. Among the three treatments utilized in the first year, RDI under SSD had the highest TSS, with a value of 7.45%. In the second year, PRD with SSD had the highest TSS, with a value of 6.57%. The FI treatment had the lowest value in both years.
Note: Different letters inside the columns showed significant differences between irrigation treatments at p<0.05. Bars give the means ± standard error of the mean (n=3).
Figure 11 Total soluble solids, vitamin C, and titratable acidity for the different irrigation treatments
Both RDI and PRD treatments had higher TSS concentrations than the FI treatment in both years, as shown in Figure 11. This agrees with the findings of various researchers[14,37,58]. TSS
increasing could be due to a higher conversion of starch to sugars under water deficit[59]. Also, this phenomenon can be explained
by a decrease in water accumulation by the fruit without any significant modification in the quantity of accumulated sugars[60].
This last aspect may have an important positive implication for the tomato processing industry because it is well known that tomatoes
with high TSS content improve processing efficiency[61].
Ozbahce and Tari[62] found there was also a negative linear
relationship between TSSs and irrigation water amount. VC is an important antioxidant that represents the nutritional quality of fruit[38]. The results illustrated that the VC in tomato
fruit was considerably increased under water saving treatments. A concentration effect due to less water content, such as for TSS, explains this behavior. The VC in the 1st year increased by
25.13% and 13.97% for RDI and PRD, which is more than that of FI. In the 2nd year, the VC increased by 25.97% and 20.09% for
RDI and PRD, respectively. The FI treatment had the lowest value in both years. These results showed that water stress can positively affect the VC content in tomato fruit, as observed by findings of Patanè et al.[22]. They proved that the VC content of
the tomato fruit is greater under limited soil water conditions. In addition, the results were consistent with the results obtained by Nahar et al.[63] and Yang et al.[38], who reported that alternate drip
irrigation increased the percentage of VC content in tomato fruit compared to conventional drip irrigation, as explained in the TSS.
The study results showed that the TA in tomato fruit was considerably increased under DI treatments. This may be due to the fact that the water content was lower in fruit under DI treatments. The 1st year results showed increasing TA with RDI
and PRD, by 20% and 25% respectively. In the 2nd year, the TA
was increased by 12.44% and 12.8% for RDI and PRD.
The results were consistent with Nangare et al.[14], who pointed
out that the tomato acidity under DI treatment values was improved compared to FI. Also, Patanè et al.[22] reported that DI treatments
significantly enhanced TA compared to FI treatment. The major advantage of DI was an improvement in quality in terms of TSS, VC, and acidity[13]. Reduced irrigation treatments (RDI and PRD)
resulted in generally improved fruit quality in relation to FI, as reported by Mitchell et al.[54]. An ANOVA showed that there was
a significant difference in TSS (p<0.05), VC (p<0.05), and TA (p<0.05) of tomato between different treatments in both years.
The goal of DI is to increase IWUE by reducing the amount of water applied via watering or by reducing the number of irrigation events[27]. Thus, the irrigation water applied (IWA) amount was
recorded for the tomato under all treatments (FI, RDI, and PRD) during the two year period, as shown in Figure 12.
The IWUE values determined for all irrigation treatments for two years are presented in Figure 13. Among all treatments over the two years, there are no significant effects (p>0.05) on IWUE values. Similarly, the effects of water stress on the IWUE have been pointed out by several researchers, and they noted that there were not any significant differences in IWUE among the different water regimes that they used[50,64].
During the first year, although there were no significant differences between treatments on the IWUE, the PRD (21.53 kg/m3) increased by 6.11%, while RDI (18.95 kg/m3)
decreased by 6.6% compared with FI (20.29 kg/m3), as shown in
Figure 13.
During the second year, the values of FI (14.10 kg/m3), RDI
(15.28 kg/m3) and PRD (14.35 kg/m3) increased the IWUE by
1st year
2nd year
Figure 12 Irrigation water applied (IWA) per hectare
Note: Different letters inside the columns show significant differences between irrigation treatments at p<0.05. Bars give the means ± standard error of the mean (n=3).
Figure 13 IWUE for the different irrigation treatments Topcu et al.[66] reported that the PRD practice and RDI
increased the IWUE compared to the FI. The increase in IWUE values under the two water DI practices could be attributed to the partial stomatal closure seen under the RDI and PRD treatments, and can lead to a decrease in T and possibly to an increase in WUE[67].
Liu et al.[68] pointed out that higher IWUE with lower irrigation
depth may be attributable to the efficient use of the available soil water in the root zone. The non-hydraulic (chemical) signals can improve water use efficiency by inducing partial stomatal closure and therefore reducing transpiration without detectable changes in plant water status[69]. Deep percolation beyond the root zone due
to over-irrigation may also decrease the IWUE value. The IWUE is an important indicator that reflects the effective use of water resources in crop production[51].
4 Conclusions
From all of the above field experimental results, regulated deficit irrigation (RDI) and partial root zone drying irrigation (PRD) have proven the efficiency in reducing stomatal conductance values, and enhancing the irrigation water use efficiency, and dry fruit yield as compared to full irrigation (FI). Also, RDI and PRD treatments increased the total soluble solids, vitamin C, and titratable acidity of tomato compared to the FI treatment.
Acknowledgement
This Project was funded by the National Plan for Science, Technology and Innovation (MAARIFAH), King Abdulaziz City for Science and Technology, Kingdom of Saudi Arabia, Award Number (11-WAT1978-02).
[References]
[1] Huffaker R, Hamilton J. Conflict. In: Irrigation of agricultural crops (Lascano, R.J., and Sojka, R.E. eds.), 2nd edition, Agronomy Monograph no. 30. ASA-CSSA-SSSA publishing, 2007; 664p.
[2] Lascano R J, Sojka R E. Preface. In: Irrigation of agricultural crops (Lascano, R.J., and Sojka, R.E. eds.), 2nd edition, Agronomy Monograph no. 30. ASA-CSSA SSSA publishing, 2007; 664p.
[3] Mancosu N, Snyder R L, Kyriakakis G, Spano D. Water scarcity and future challenges for food production. Water, 2015; 7(3): 975–992. [4] ASABE-Standards. Soil and Water Terminology. S526.3. ASABE, St.
Joseph, MI. 2007.
[5] Ayars J E, Fulton A, Taylor B. Subsurface drip irrigation in California—Here to stay?. Agricultural Water Management, 2015; 157: 39–47.
[6] Camp C R. Subsurface drip irrigation: a review. Transactions of the ASAE, 1998; 41(5): 1353.
[7] White S C. Partial rootzone drying and deficit irrigation in cotton for use under large mobile irrigation machines (Doctoral dissertation, University of Southern Queensland).
[8] Kang S, Zhang J. Controlled alternate partial root-zone irrigation: its physiological consequences and impact on water use efficiency. Journal of experimental botany, 2004; 55(407): 2437–2446.
[9] Stikić R, Stričević R, Jovanović Z, Matović G, Savić S, Rovčanin S, et al. Deficit Irrigation Methods Management Practices for Horticulture and Viticulture. Faculty of Agriculture, University of Belgrade, Serbia 18 ps. 2010.
[10] Parvizi H, Sepaskhah A R, Ahmadi S H. Physiological and growth responses of pomegranate tree (Punica granatum L. cv. Rabab) under partial root zone drying and deficit irrigation regimes. Agricultural Water Management, 2016; 163: 146–58.
[11] Moutonnet P. Yield response factors of field crops to deficit irrigation. InDeficit irrigation practices 2002.
[12] Özmen S, Kanber R, Sarı N, Ünlü M. The effects of deficit irrigation on nitrogen consumption, yield, and quality in drip irrigated grafted and ungrafted watermelon. Journal of Integrative Agriculture, 2015; 14(5): 966–976.
[13] Veit‐Köhler U, Krumbein A, Kosegarten H. Effect of different water supply on plant growth and fruit quality of Lycopersicon esculentum. Journal of Plant Nutrition and Soil Science, 1999; 162(6): 583–588. [14] Nangare D D, Singh Y, Kumar P S, Minhas P S. Growth, fruit yield and
quality of tomato (Lycopersicon esculentum Mill.) as affected by deficit irrigation regulated on phenological basis. Agricultural Water Management, 2016; 171: 73–9.
[15] Fiaz S, Noor M A, Aldosri F O. Achieving food security in the Kingdom of Saudi Arabia through innovation: Potential role of agricultural extension. Journal of the Saudi Society of Agricultural Sciences, 2016, Sep 23. [16] Black C A. Methods of Soil Analysis Part 1 and 2. American Society
of Agronomy, Inc.; USA; 1965.
[18] Allen R G, Pereira L S, Raes D, Smith M. Crop evapotranspiration-Guidelines for computing crop water requirements-FAO Irrigation and drainage paper 56. FAO, Rome, 1998; 300(9): D05109.
[19] Ahmadi S H, Andersen M N, Plauborg F, Poulsen R T, Jensen C R, Sepaskhah A R, Hansen S. Effects of irrigation strategies and soils on field-grown potatoes: Gas exchange and xylem [ABA]. Agricultural Water Management, 2010; 97(10): 1486–1494.
[20] Asch, F. Determination of Abscisic Acid by Indirect Enzyme Linked Immunosorbent Assay (ELISA). Technical Report, Laboratory for Agrohydrology and Bioclimatology, Department of Agricultural Sciences, the Royal Veterinary and Agricultural University, Taastrup, Denmark, 2000.
[21] Turhan A, Şeniz V. Estimation of certain chemical constituents of fruits of selected tomato genotypes grown in Turkey. African Journal of Agricultural Research, 2009; 4(10): 1086–1092.
[22] Patanè C, Tringali S, Sortino O. Effects of deficit irrigation on biomass, yield, water productivity and fruit quality of processing tomato under semi-arid Mediterranean climate conditions. Scientia Horticulturae, 2011; 129(4): 590–6.
[23] AOAC. Official Methods of Analysis, 16th Edition, 5th Reversion. AOAC Inter-national, Gaithersburg, MD, method 942.15 and 967.21. 1999.
[24] Chaudhary T N, Bhatnagar V K. Wheat root distribution, water extraction pattern and grain yield as influenced by time and rate of irrigation. Agricultural Water Management, 1980; 3(2): 115–124. [25] Davies W J, Hartung W. Has extrapolation from biochemistry to crop
functioning worked to sustain plant production under water scarcity. InProceeding of the Fourth International Crop Science Congress 2004 Sep 26 (Vol. 26).
[26] Du T, Kang S, Zhang J, Li F, Hu X. Yield and physiological responses of cotton to partial root-zone irrigation in the oasis field of northwest China. Agricultural Water Management, 2006; 84(1-2): 41–52. [27] Kirda C, Cetin M, Dasgan Y, Topcu S, Kaman H, Ekici B, Derici M R,
Ozguven A I. Yield response of greenhouse grown tomato to partial root drying and conventional deficit irrigation. Agricultural water management, 2004; 69(3): 191–201.
[28] Zegbe J A, Behboudian M H, Clothier B E. Responses of ‘Petopride’processing tomato to partial rootzone drying at different phenological stages. Irrigation Science, 2006; 24(3): 203–210. [29] Kang S, Zhang L, Hu X, Li Z, Jerie P. An improved water use efficiency
for hot pepper grown under controlled alternate drip irrigation on partial roots. Scientia Horticulturae, 2001; 89(4): 257–267.
[30] Nardella E, Giuliani MM, Gatta G, De Caro A. Yield response to deficit irrigation and partial root-zone drying in processing tomato (Lycopersicon esculentum Mill.). Journal of Agricultural Science and Technology. A. 2012; 2(2A): 209.
[31] Liu F, Song R, Zhang X, Shahnazari A, Andersen M N, Plauborg F, Jacobsen S E, Jensen C R. Measurement and modelling of ABA signalling in potato (Solanum tuberosum L.) during partial root-zone drying. Environmental and Experimental Botany, 2008; 63(1-3): 385–391.
[32] Wang Y, Liu F, Jensen C R. Comparative effects of deficit irrigation and alternate partial root-zone irrigation on xylem pH, ABA and ionic concentrations in tomatoes. Journal of experimental botany, 2011; 63(5): 1907–1917.
[33] Liu F, Jensen C R, Shahanzari A, Andersen MN, Jacobsen S E. ABA regulated stomatal control and photosynthetic water use efficiency of potato (Solanum tuberosum L.) during progressive soil drying. Plant Science, 2005; 168(3): 831–836.
[34] Mitchell R A, Mitchell V J, Lawlor D W. Response of wheat canopy CO2 and water gas‐exchange to soil water content under ambient and
elevated CO2. Global Change Biology, 2001; 7(5): 599–611.
[35] Serraj R, Allen L H, Sinclair T R. Soybean leaf growth and gas exchange response to drought under carbon dioxide enrichment. Global Change Biology, 1999; 5(3): 283–91.
[36] Spence R D, Wu H I, Sharpe P J, Clark K G. Water stress effects on guard cell anatomy and the mechanical advantage of the epidermal cells. Plant, Cell & Environment, 1986; 9(3): 197–202.
[37] Akhtar SS, Li G, Andersen M N, Liu F. Biochar enhances yield and quality of tomato under reduced irrigation. Agricultural Water Management, 2014; 138: 37–44.
[38] Yang L, Qu H, Zhang Y, Li F. Effects of partial root-zone irrigation on physiology, fruit yield and quality and water use efficiency of tomato under different calcium levels. Agricultural Water Management, 2012; 104: 89–94
[39] Zhang J, Davies W J. Changes in the concentration of ABA in xylem sap as a function of changing soil water status can account for changes in leaf conductance and growth. Plant, Cell & Environment, 1990; 13(3): 277–285.
[40] Liu F, Jensen C R, Andersen M N. Hydraulic and chemical signals in the control of leaf expansion and stomatal conductance in soybean exposed to drought stress. Functional Plant Biology, 2003; 30(1): 65–73.
[41] Saab I N, Sharp R E. Non-hydraulic signals from maize roots in drying soil: inhibition of leaf elongation but not stomatal conductance. Planta, 1989; 179(4): 466–474.
[42] Dodd I C, Theobald J C, Bacon M A, Davies W J. Alternation of wet and dry sides during partial rootzone drying irrigation alters root-to-shoot signalling of abscisic acid. Functional Plant Biology, 2006; 33(12): 1081–1089.
[43] Dodd I C, Egea G, Davies W J. Abscisic acid signalling when soil moisture is heterogeneous: decreased photoperiod sap flow from drying roots limits abscisic acid export to the shoots. Plant, Cell & Environment, 2008; 31(9): 1263–1274.
[44] Wang Y, Liu F, Andersen M N, Jensen C R. Improved plant nitrogen nutrition contributes to higher water use efficiency in tomatoes under alternate partial root-zone irrigation. Functional Plant Biology, 2010; 37(2): 175–182.
[45] Davies WJ, Bacon MA, Stuart Thompson D, Sobeih W, González Rodríguez L. Regulation of leaf and fruit growth in plants growing in drying soil: exploitation of the plants' chemical signalling system and hydraulic architecture to increase the efficiency of water use in agriculture. Journal of Experimental Botany, 2000; 51(350): 1617–1626.
[46] Van Rensburg L, Krüger H, Breytenbach J, Coetzee J, Van der Merwe C F, Van Aswegen G, et al. Immunogold localization and quantification of cellular and subcellular abscisic acid, prior to and during drought stress. Biotechnic & histochemistry, 1996; 71(1): 38–43.
[47] Wilkinson S, Davies WJ. Xylem sap pH increase: a drought signal received at the apoplastic face of the guard cell that involves the suppression of saturable abscisic acid uptake by the epidermal symplast. Plant physiology, 1997; 113(2): 559–73.
[48] Dodd I C. Soil moisture heterogeneity during deficit irrigation alters root-to-shoot signalling of abscisic acid. Functional Plant Biology, 2007; 34(5): 439–448.
[49] Savić S, Stikić R, Radović B V, Bogičević B, Jovanović Z, Šukalović V H. Comparative effects of regulated deficit irrigation (RDI) and partial root-zone drying (PRD) on growth and cell wall peroxidase activity in tomato fruits. Scientia Horticulturae, 2008; 117(1): 15–20.
[50] Giuliani M M, Gatta G, Nardella E, Tarantino E. Water saving strategies assessment on processing tomato cultivated in Mediterranean region. Italian Journal of Agronomy, 2016; 11(1): 69–76.
[51] Kuscu H, Turhan A, Ozmen N, Aydinol P, Demir A O. Optimizing levels of water and nitrogen applied through drip irrigation for yield, quality, and water productivity of processing tomato (Lycopersicon esculentum Mill.). Horticulture, Environment, and Biotechnology, 2014; 55(2): 103–114.
[52] Costa J M, Ortuño MF, Chaves MM. Deficit irrigation as a strategy to save water: physiology and potential application to horticulture. Journal of integrative plant biology, 2007; 49(10): 1421–34.
[53] Fereres E, Soriano M A. Deficit irrigation for reducing agricultural water use. Journal of experimental botany, 2006; 58(2): 147–59.
[54] Mitchell J P, Shennan C, Grattan S R. Developmental changes in tomato fruit composition in response to water deficit and salinity. Physiologia Plantarum, 1991; 83(1): 177–185.
[55] Ho L C, Grange R I, Picken A J. An analysis of the accumulation of water and dry matter in tomato fruit. Plant, Cell & Environment, 1987; 10(2): 157–162.
[56] Grange R I, Andrews J. Expansion rate of young tomato fruit growing on plants at positive water potential. Plant, Cell & Environment, 1994; 17(2): 181–187.
[57] Zegbe J A, Behboudian M H, Clothier B E. Partial rootzone drying is a feasible option for irrigating processing tomatoes. Agricultural Water Management, 2004; 68(3): 195–206.
Stellacci A M, Todorovic M. Combined effect of deficit irrigation and strobilurin application on yield, fruit quality and water use efficiency of “cherry” tomato (Solanum lycopersicum L.). Agricultural Water Management, 2016; 167: 53–61.
[59] Kramer P. Water Relations of Plants. Academic Pres. Inc New York, 1983.
[60] Guichard S, Gary C, Longuenesse J J, Leonardi C. Water fluxes and growth of greenhouse tomato fruits under summer conditions. InIII International Workshop on Models for Plant Growth and Control of the Shoot and Root Environments in Greenhouses 507 1999 Feb 21, pp.223–230.
[61] Johnstone PR, Hartz TK, LeStrange M, Nunez JJ, Miyao EM. Managing fruit soluble solids with late-season deficit irrigation in drip-irrigated processing tomato production. HortScience, 2005; 40(6): 1857–1861. [62] Ozbahce A, Tari AF. Effects of different emitter space and water stress
on yield and quality of processing tomato under semi-arid climate conditions. Agricultural Water Management, 2010; 97(9): 1405–1410. [63] Nahar K, Ullah SM, Islam N. Osmotic adjustment and quality response
of five tomato cultivars (Lycopersicon esculentum Mill) following water deficit stress under subtropical climate. Asian Journal of Plant Sciences,
2011.
[64] Rinaldi M, Garofalo P, Rubino P, Steduto P. Processing tomatoes under different irrigation regimes in Southern Italy: agronomic and economic assessments in a simulation case study. J Agrometeorol, 2011; 3(3): 39–56.
[65] Chen J, Kang S, Du T, Qiu R, Guo P, Chen R. Quantitative response of greenhouse tomato yield and quality to water deficit at different growth stages. Agricultural water management, 2013; 129: 152–162.
[66] Topcu S, Kirda C, Dasgan Y, Kaman H, Cetin M, Yazici A, Bacon M A. Yield response and N-fertiliser recovery of tomato grown under deficit irrigation. European Journal of Agronomy, 2007; 26(1): 64–70. [67] Sepaskhah A R, Ahmadi S H. A review on partial root-zone drying
irrigation. International Journal of Plant Production, 2012; 4(4): 241–258.
[68] Liu X, Shao L, Sun H, Chen S, Zhang X. Responses of yield and water use efficiency to irrigation amount decided by pan evaporation for winter wheat. Agricultural water management, 2013; 129: 173–180.