The ICT Competencies of Part-Time Students at a Tertiary Institution in Barbados
Paul A. Walcott
[email protected] The University of the West Indies, Cave Hill Campus, Barbados
Leah Garner-O’Neale
[email protected] The University of the West Indies, Cave Hill Campus, Barbados
Colin Depradine
[email protected] The University of the West Indies, Cave Hill Campus, Barbados
Doi:10.5901/ajis.2013.v2n2p37
Abstract
Many schools and institutions worldwide have integrated ICT competencies into their curricula because it is argued that ICT competence is necessary for economic development and social change. In developing nations such as the Caribbean, however, due to the digital divide, it is questionable whether citizens possess the ICT competencies necessary for economic growth. This paper describes a study which investigated whether students at a tertiary institution in Barbados possessed some of the important ICT competencies necessary for the development of the country’s economy. One hundred and five part-time students were asked to self-report their perceived ICT competencies on a survey instrument which queried their abilities in the use of productivity tools (word processor, spreadsheet and presentation) and their computer maintenance and security skills. The results showed that both males and females were most highly skilled in the use of word processing software, although females were more competent. Females were also more competent than males in the use of presentation software. Alternatively, females’ weakest competence was computer maintenance, while males’ weakest was the use of presentation software. Furthermore, there were significant differences in: the computer maintenance and security skills of males and females; the use of word processors and spreadsheets based on age; and all the productivity tools skills based on students’ self-rated overall computer skills. Although it appears from this study that students possess some of the basic ICT skills such as word processing, there are significant gender and age differences in skill levels which may affect Barbados’ ICT development.
Keywords: ICT Competencies, ICT Skills, Productivity tools, Barbados
1. Introduction
Despite changes in the meaning of the term ICT competency from the operation and usage of computers to mastering software applications (Seungeun, Soojin, Daiyong, Hansung, Seungbum & JaMee, 2011) it appears that it is synonymous with ICT skills, computer competencies, computer skills, computer ability and computer literacy (Walcott, Grant, Lorde, Depradine & Bladh, 2011). Kim & Lee (2013) described ICT skills as those necessary “for living in a modern information-based society (Kim & Lee, 2013, p1),” while Seungeun et al (2011) described the term as the mastering of application software (word processing, presentation, spreadsheet and Internet) and being able to use information well.
It is argued that ICT competence is necessary for economic development and social change worldwide (Kozma, 2005), therefore ICT skills training has been integrated into the curricula of many schools and institutions globally. Many developed countries are reaping the benefits of ICT innovations in areas such as education and health care and are experiencing economic growth and competitive advantage as a result.
& Zalles, 2003). Yet many developing countries are placing great emphasis on development through ICT in an effort to boost their economies and help to alleviate poverty. Barbados, the most easterly island in the Caribbean, is no exception.
As a developing nation it has placed ICT at the centre of its development plan. In its National ICT Strategic Plan for 2010-2015 (http://www.carib-is.net/sites/default/files/Official_Barbados_National_ICT_Strategic_Plan_Final.pdf) the Government of Barbados emphasised the need for continued education and learning in order to exploit new technologies and improve the quality of life of its citizens. Barbados has recognised that in order to compete in global markets it must effectively utilise ICT (http://www.reform.gov.bb/page/newspdf/why%20a%20national%20strategic %20plan.pdf).
In light of the National ICT Strategic Plan it is important for Barbados to determine the current competencies of its citizenry in order to establish whether current ICT-based educational programmes are effective. This study dovetails well with this effort since it attempted to determine the ICT competencies of students at one of the tertiary-level institutions on the island. The ICT competencies examined were the use of productivity tools (word processor, spreadsheet and presentation), as well as computer maintenance and security skills.
This study is fundamentally important since it will help to inform stakeholders about the level of ICT competency of students at the tertiary institution allowing the creation of an intervention strategy aimed at improving students’ ICT skills, if necessary. Since the results for a study of this type (for Barbados) has never been reported in the literature before, these results will serve as a baseline for future studies.
In the remaining sections of this paper the purpose of this research and the research questions will be detailed. A literature review on the ICT competencies of students will follow along with the methodology of the study. Finally the results of the paper will be presented and discussed, and conclusions highlighted.
2. Purpose of the Research
This study investigated the self reported ICT competencies of part-time students at a tertiary institution in Barbados. It sought to determine the level of competency of the students specifically in their usage of productivity tools as well of their ability to maintain and secure their computers. It also sought to determine if there were any significant differences in their ICT competencies based on their sex (male or female); age and self-rated overall computer skills. In addition, it sought to determine to what extent these factors jointly predict the students’ ICT competencies in productivity tools, maintenance and security of their computers.
3. Research Questions
The research questions that facilitated this research were:
1. What is the level of competency of part-time students in the use of the following productivity tools: word processor, spreadsheet and presentation tools?
2. What is the level of competency of part-time students when maintaining their computers? 3. What is the level of competency of part-time students when securing their computers?
4. Are there any significant differences in word processing skills, spreadsheet skills, presentation tool skills, maintenance skills and security skills across sex, age, and self-rated computer skills?
5. To what extent do sex, age and self-rated computer skills jointly predict the students’ level of competence in productivity tools, maintaining their computers and securing their computers?
6. What is the relative contribution of sex, age and self-rated computer skills to the students’ level of competence in productivity tools, maintaining their computers and securing their computers?
4. Literature Review
Prensky (2001a, 2001b) coined the terms digital natives (also referred to as the Net Generation) and digital immigrants to distinguish between students who were born during the digital age (the digital natives) and those who were born before that time that adopted many of the new technologies (the digital immigrants). He argued that digital natives had acquired and perfected these ICT skills “through years of interaction and practice (Prensky, 2001a, p2)” and that their brains as a result were likely to be physically different (Prensky 2001b).
Prensky’s description of the Digital Native culture is the generalization that all today’s students fit the stereotype of the kid glued to the computer or the television 20 hours a day. A typical classroom is more diverse, with students coming from a range of backgrounds (p. 3).”
Oblinger (2003) used the term 'Millennial' to describe a student that was born during or after 1982 who was comfortable with technology. She argued that Millennials had distinct learning styles characterised by preferences for “teamwork, experiential activities, structure and the use of technology,” and noted that a single approach would not be successful when teaching these students. She also reasoned that it was important for institutions to determine ways to meet Millennials’ expectations.
Despite the supposition that digital natives, Millennials or the Net Generation (whichever label is used) are tech-savvy a study of 273 New Zealand tertiary students by Sherry & Fielden (2005) did not fully support this conclusion. Among other things this study investigated the students’ self-rated computer knowledge and their actual knowledge (using a multiple choice test) of the Internet, email, word-processing, spreadsheets and databases. These students represented three age groups, under 21 (Millennials only), 21-25 (including some Millennials), and over 25 (non-Millennials). In terms of self-rated computer knowledge a larger percentage of the Millennials considered themselves to be comfortable/fairly confident and quite competent (on the scale, novice, ok, comfortable/fairly competent, quite competent and expert) than the other two age groups; whereas the 21-25 age group had the lowest self-rated computer knowledge. Alternatively, the test scores revealed that, on average, students of all ages were more competent in the use of MS Word than MS Excel. Furthermore, there was a significant difference in the test scores for MS Word based on age, in favour of the under 21s (the Millennials) who received the highest average score. Although the under 21s had a slightly better average test score for MS Excel there was not a significant difference in these scores among the age groups (Sherry & Fielden, 2005).
A study conducted by Guo, Dobson & Petrina (2008) also found that there were no significant differences between pre-program and post-program teachers’ age groups in term of computer competencies during a study conducted at the University of British Columbia (Canada) during 2001-2004. This provides additional evidence that helps to debunk this general supposition. Similarly, Bayne & Ross (2007) address their concerns from a theoretical point of view noting that these issues, which include the de-privileging of teachers and a marketised vision of higher education, have been overly simplified.
Many other studies have investigated the ICT competencies of students from several countries worldwide including the USA (Caruso & Kvavik, 2005), UK (Rae, 2004; Jones, Ramanau, Cross & Healing, 2010), Europe (Haywood, Haywood, Macleod, Baggetun, Baldry, Harskamp, Teira, Tenhonen & Akademi, 2004), Africa (Danner & Pessu, 2013) and New Zealand (Gibbs, 2008). More recently studies have also emerged from Asian which investigated the ICT skills of Malaysian students (Rasit, Rosli & Ibrahim, 2012; Hew & Leong, 2011). There however appears to be a dearth of published studies for the Caribbean region (other than the authors’ earlier work, Walcott et al, 2011; Grant & Walcott, 2009; and Walcott, Grant & Depradine, 2008). In reviewing these studies attention will be paid only to the ICT skills related to word processing, presentation software, spreadsheets, securing a computer and maintaining a computer.
The results from the ECAR 2005 study of 18,039 students from 63 higher education institutions in the USA suggest that students in the USA rank ordered their ICT skills (from highest to lowest) as word processing, presentation software, spreadsheets, performing computer maintenance and securing their electronic devices (Caruso & Kvavik, 2005).
In the UK the Media Technologies: Access and Use survey 2003 (MTAU2003) was administered at the Open University (OU) in 2003. One of the objectives of this study was to examine how well students used specific ICT applications. A 40 item questionnaire was sent to 5,000 undergraduates and graduates of the OU and 1753 responded. These students rank ordered their ICT skills (from highest to lowest) as word processing tools, spreadsheet, and presentation software (Rae, 2004). In another study of five UK universities in 2010 it was found that the rank order of ICT skills was different between male and females. Female students rank ordered their skills (from highest to lowest) as presentation software, computer maintenance, spreadsheet and computer security, while males’ ordered their skills as computer maintenance, presentation software, and spreadsheet (with computer security having the same rank). In addition, for each of these tools students who were 25 years old and under perceived that there were more competent that their over 25 years old peers; and males were more confident than females in the use of spreadsheets, computer maintenance and security (Jones, Ramanau, Cross & Healing, 2010).
Baggetun, Baldry, Harskamp, Teira, Tenhonen & Akademi, 2004). Both the new and established students rank ordered their ICT skills (from highest to lowest) as word processing software, spreadsheets and presentation software. Although, new male students were reportedly more adept at word processing than new female students, gender effects were usually small.
A study conducted of 182 new (first year) Accounting students at a Malaysian university found that students who had previous completed a diploma programme (where they had already received ICT training) rank ordered their ICT skills (from highest to lowest) as presentation software, word processing software and spreadsheets (Rasit, Rosli & Ibrahim, 2012). Conversely, a study of 208 pre-university Malaysian students, both male and female rank ordered their ICT skills (from highest to lowest) as word processing, presentation software, PC maintenance and spreadsheets (Hew & Leong, 2011). In this study females had a higher competency than males in the word processing skill.
Alternatively, a study of 40 undergraduates from a range of disciplines (excluding Information Technology) at a small New Zealand university found that students rank ordered their ICT skills (from highest to lowest) as word processing (above average), presentation and spreadsheet software (Gibbs, 2008).
Finally a study of 100 undergraduates at a university in Nigeria determined that students’ perceived that their highest competency was in word processing and lowest in the use of presentation tools (Danner & Pessu, 2013).
In nearly all of the countries reviewed students perceived that they were most competent in the use of word processors (Table 1). The exception however was in Malaysia (Rasit, Rosli & Ibrahim, 2012) where the difference appeared to be due to the prior ICT training students received during their diploma programme. On average it also seemed that presentation software ranked second, however ranking of the other tools appeared to be less straightforward especially due to the work by Jones, Ramanau, Cross & Healing, 2010.
Table 1: The ranking of ICT skills according to country
Country Author(s)
Ranking of Skills Word
Processing Presentation Spreadsheet Maintenance Security
USA Caruso & Kvavik,
2005 1st 2nd 3rd 4th 5th
UK Rae, 2004 1st 3rd 2nd
UK Jones, Ramanau, Cross & Healing, 2010
1st (females) 3rd (females) 2nd (females) 4th (females) 2nd(males) 3rd(males) 1st(males) 3rd (males)
Europe Haywood, J., Haywood, D. et al.,
2004 1
st 3rd 2nd
Malaysia
Rasit, M.H., Rosli, K. and Ibrahim,
M.A., 2012 2
nd 1st 3rd
Malaysia Hew & Leong, 2013 1 st (males & females)
2nd (males & females)
4th (males & females)
3rd (males & females) New
Zealand Gibbs, 2008 1st 2nd 3rd
Nigeria Danner & Pessu, 2013 1st 2nd
5. Setting
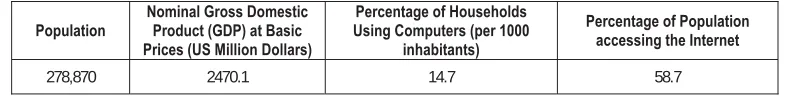
The Anglophone Caribbean comprises of some 6 million inhabitants (a 2000 estimate) distributed over approximately 22 English-speaking countries including Barbados. In Table 2, the population, GDP, percentage of households using computers and percentage of population accessing the Internet of Barbados is presented.
Table 2: The population, GDP and ICT Indicators for Barbados (CARICOM Secretariat Statistical Databases 2005 - 2006).
Population Nominal Gross Domestic Product (GDP) at Basic Prices (US Million Dollars)
Percentage of Households Using Computers (per 1000
inhabitants)
Percentage of Population accessing the Internet
278,870 2470.1 14.7 58.7
The education sector was well developed at the time of the study with opportunities for primary, secondary and tertiary-level education. At the primary tertiary-level through the Edutech 2000 initiative some primary school students were receiving training in the use of productivity tools (such as word processing and presentation tools), the Internet and email. At the secondary level the Caribbean Secondary Education Certificate (CSEC) (www.cxc.org) (for 16 year old students) included the use of productivity tools. In addition, two tertiary level institutions in Barbados also offered training, to some students, in the use of productivity tools. Although other institutions also offered courses in productivity tools, comparatively speaking, only a small percentage of the total students in Barbados completed this training.
The ICT Competencies Questionnaire (ICTCQ) was administered at a tertiary-level Institute in Barbados. This institution had approximately 6,500 undergraduate students across four Faculties and two schools. These Faculties were Pure & Applied Sciences, Humanities and Education, Social Sciences and Law; and the two schools were the School of Education and the School of Clinical Medicine and Research. This institution offered degrees in: law; the social sciences; the arts and education; and the sciences (including computer science) at the undergraduate and post-graduate levels. These degrees included B.Sc., LL.B., B.Ed, M.Ed., M.Sc., M.Phil and Ph.D.
It was not required for all new or established students to complete training in the use of productivity tools although students in the Department of Management Studies were required to complete a course on the use of productivity tools.
6. Methodology
6.1 Research Design
A survey or descriptive research design was used in this study. It was used because it allowed the researchers to collect data regarding the opinion of the participants on a particular topic (Leacock, Warrican & Rose, 2009).
6.2 Sample
A total of 105 part-time sophomore (established) students participated in the study. Of the participants 62 (59 percent) were female and 43 (41 percent) were male; eleven were in the 16-20 age group (Millennials only), 22 in the 21-25 age group (including many Millennials), 27 in the 26-30 age group (non-Millennials), 18 in the 41-50 age group and 2 were above 50 years of age. In addition when asked to rate their overall computer skills 6 (5.7 percent) were in the novice category, 10 (9.5 percent) in the fair category, 50 (47.6 percent) average, 31 (29.5 percent) above average and 8 (7.6 percent) declared themselves as experts.
6.3 Instrumentation
The instrument used in this study was the ICTCQ which was devised by the Scholarship through Action Research on Teaching (START) group. The questionnaire consisted of closed-ended questions and was divided into four sections:
3. Section C: The Security Skill Scale 4. Section D: The Maintenance Skill Scale
Section A consisted of 13 questions that gathered information such as: gender, country of origin, native language, age group and home department; and academic and computer experience, namely: course; year and level of study; full/part time status and major.
Section B consisted of 22 items of which participants were asked to indicate which ones they were capable of doing. These 22 items were subdivided into three productivity tools: 9 items addressed word processing skills such as spell checking, cutting and pasting and creating tables; 6 items addressed spreadsheet skills such as creating fields, and formulae and charts/graphs; and 7 items addressed presentation tool skills such as changing templates, adding animation and sound and/or video.
Section C consisted of 4 items such as scanning for viruses and malware; while Section D consisted of 11 items such as defragmenting drives, and applying patches.
The ICTCQ was piloted and analysed for validity as well as reliability. According to Leacock, Warrican & Rose (2009) validity is the extent to what a test measures what it should, or that it collects the data needed to answer the research questions. To assess validity the test was subject to expert analysis by two highly trained computer science lecturers and one instructional development expert. The Cronbach alpha was used as a measure of internal consistency to determine the reliability of the scales and subscales (Tavakol & Dennick, 2011). The word processing skills subscale had an alpha value of 0.868, the spreadsheet skill subscale Į = 0.859 and for the presentation tool skills subscale Į = 0.929. The security and maintenance skill scales generated alpha values of 0.858 and 0.920, respectively.
6.4 Data Analysis and Scoring Scheme
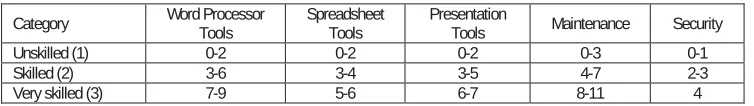
The data collected to answer research questions 1 to 3 was analysed using the mean values and standard deviations. For each productivity tool, and for the maintenance and security skills the respondents were categorized as unskilled (and given a score of 1); skilled (and given a score of 2); or very skilled (and given a score of 3). The scoring for each category can be seen in Table 3. For example, if a participant was able to complete 8 (out of the 9) word processing tasks the participant was considered to be very skilled.
Table 3: Scoring guide for each ICT competency (the number ranges represent the number of tasks the participant can complete)
Category Word Processor Tools Spreadsheet Tools Presentation Tools Maintenance Security
Unskilled (1) 0-2 0-2 0-2 0-3 0-1
Skilled (2) 3-6 3-4 3-5 4-7 2-3
Very skilled (3) 7-9 5-6 6-7 8-11 4
The data collected to answer research question 4 was analysed using the t-test of independent samples for sex and the one way between groups analysis of variance (ANOVA) for age and the participants self- rated overall computer skills. The data collected to answer research questions 5 and 6 was analysed using linear regression. In each case the selected probability level was 0.05.
7. Results & Discussion
7.1 Research Question 1
What is the level of competency of part-time student in the use of the following productivity tools: word processor, spreadsheet and presentation tools?
7.1.1 Word Processor
5.7 percent as unskilled. The mean score was 2.7 (out of 3) with a standard deviation of 0.56.
7.1.2 Spreadsheet
Almost half of the participants (48.6 percent) were found to be very skilled in spreadsheet tools, 21.0 percent were found to be skilled and 30.5 percent unskilled. The mean score was 2.2 with a standard deviation of 0.87.
7.1.3 Presentation
Of the 105 participants, 28.6 percent were found to be very skilled in presentation tools, 22.9 percent were found to be skilled and 48.6 percent unskilled. The mean score was 1.8 with a standard deviation of 0.86.
Of the three productivity tools surveyed, it was found that the participants were more skilled in word processing followed by spreadsheets then presentation tools. This finding is in alignment with the global trend (Table 1) and is in direct agreement with the findings of Rae (2004) in the UK and Haywood et al. (2004) in Europe. However, far too many students reported that they were unskilled in the area of presentation tools (48.6 %). This is a matter of concern because these tools are assumed to be important for the world of work (Alshare & Hindi, 2004) and in fact for this reason many lecturers require students to prepare presentations during their course work.
7.2 Research Question 2
What is the level of competency of part-time students when maintaining their computers?
The data collected revealed that 27.6 percent of the participants were found to be very skilled in maintaining their computers, 33.3 percent were skilled and 39.0 percent were unskilled. The mean score was 1.9 with a standard deviation of 0.81.
When considering the mean score of 1.9, based on Table 3, on average the participants were not skilled in maintaining their computers. This was not surprising since most studies reflect that computer maintenance is one of the lowest ranked ICT skills among students (Caruso & Kvavik, 2005; Hew & Leong, 2011). In the current study defragmenting drives and applying patches were two of the activities relating to maintaining a computer. While every patch may not be a security vulnerability, the inability to apply patches and defragment drives may lead to unstable or poorly performing software. In addition, not performing computer maintenance, such as replacing a non-functioning fan may lead to the damaging of system components and the failure of the computer. This might leave the student without a computer and in even more extreme cases might also lead to loss information (such as assignments that are due).
7.3 Research Question 3
What is the level of competency of part-time students when securing their computers?
When assessing the competency of the students in securing their computers 21.9 percent of the participants were found to be very skilled, 10.5 percent were skilled and 67.6 percent were unskilled. The mean score was 1.5 with as standard deviation of 0.83.
Of all the ICT competencies considered in this study security was the one in which the participants reported they were least skilled. These results point to a problem with the participants’ ability to adequately secure their computer which corroborates the findings of Caruso & Kvavik (2005). When over 67 percent of the participants rated themselves as unskilled in securing their computers, which includes scanning for viruses and malware, this can be potentially problematic not just for the students but also for the University. With more students being online more often this can lead to system vulnerabilities.
7.4 Research Question 4
Are there any significant differences in word processing skills, spreadsheet skills, presentation tool skills, maintenance skills and security skills across sex, age, and self-rated computer skills?
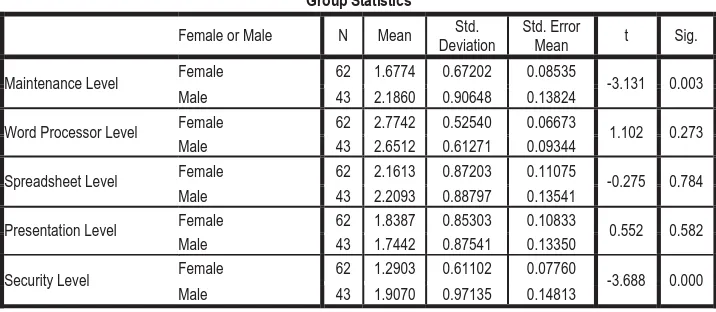
Table 4: Comparison of participants’ mean score in word processing skills, spreadsheet skills, presentation tool skills, maintenance skills and security skills based on their sex
Group Statistics
Female or Male N Mean Deviation Std. Std. Error Mean t Sig.
Maintenance Level Female 62 1.6774 0.67202 0.08535 -3.131 0.003
Male 43 2.1860 0.90648 0.13824
Word Processor Level Female 62 2.7742 0.52540 0.06673 1.102 0.273
Male 43 2.6512 0.61271 0.09344
Spreadsheet Level Female 62 2.1613 0.87203 0.11075 -0.275 0.784
Male 43 2.2093 0.88797 0.13541
Presentation Level Female 62 1.8387 0.85303 0.10833 0.552 0.582
Male 43 1.7442 0.87541 0.13350
Security Level Female 62 1.2903 0.61102 0.07760 -3.688 0.000
Male 43 1.9070 0.97135 0.14813
When a t-test for independent samples was run at the 0.05 probability level it was found that there were no significant differences in the participants' level of competency in word processing (t=1.102, p=0.273); spreadsheet (t=-0.275, p=0.784) or presentation skills (t=0.552, p=0.582) based on sex. This indicates the reported competency of both male and female part-time students in productivity tools were similar. There were significant differences however, in the male and female participants' level of competency in maintaining (t=-3.131, p=0.003) and securing (t=-3.688, p<0.0005) their computers. In each case the male students reported a higher level of competency. This finding is in agreement with that of Atan, Azli, Rahman & Idrus (2002) and Hew and Leong (2011) who also found that the maintenance competence was significantly dominated by males. Although not statistically significant, females reported higher levels of competency in only two skills namely the word processing and presentation tools skills. In terms of word processing skills, Hew and Leong (2011) also found that females were slightly better but these findings however, do not support that of Rajagopal & Bojin (2003) who found that more males were excellent in word processing than females. In terms of presentation skills, the results of this study differed from that of Hew and Leong (2011) but was in agreement in terms of spreadsheet skills since in Malaysia the males were slightly more competent that the females in both presentation and spreadsheet skills.
Table 5 reports the mean and standard deviation of the participants' score in word processing skills, spreadsheet skills, presentation tool skills, maintenance skills and security skills based on their age. When an ANOVA was run at the 0.05 probability level (Table 6), it was found that there was no significant difference in the participants' reported level of competency in presentation tools (F[5,99] =1.125; p=0.352), computer maintenance (F[5,99] =1.685; p=0.145) or security (F[5,99] =1.078; p=0.377) based on their age. There were significant differences however in the word processor (F[5,99] =5.846; p<0.0005) and spreadsheet (F[5,99] =2.493; p=0.036) competencies and it should be noted that in both of these competencies the participants in the 26-30 age group (non-Millennials) received the highest scores and those in the 51-60 age group received the lowest scores. In fact, the 26-30 age group (non-Millennials) received the highest scores in all the ICT competencies other than presentation software were it ranked second, just after the under 21 age group (the Millennials) who ranked first.
Table 5: Comparison of participants’ mean score in word processing skills, spreadsheet skills, presentation tool skills, maintenance skills and security skills based on their age
N Mean Std. Deviation Std. Error
Security Level 16-20 11 1.4545 0.82020 0.24730
21-25 22 1.6364 0.84771 0.18073
26-30 27 1.7778 0.93370 0.17969
31-40 25 1.4800 0.82260 0.16452
41-50 18 1.2778 0.66911 0.15771
51-60 2 1.0000 0.00000 0.00000
Total 105 1.5429 0.83238 0.08123
Maintenance level 16-20 11 2.0000 0.63246 0.19069
21-25 22 1.9545 0.84387 0.17991
26-30 27 2.1852 0.73574 0.14159
31-40 25 1.6800 0.85245 0.17049
41-50 18 1.6111 0.84984 0.20031
51-60 2 1.5000 0.70711 0.50000
Total 105 1.8857 0.81234 0.07928
Word Processor Level 16-20 11 2.7273 0.64667 0.19498
21-25 22 2.9545 0.21320 0.04545
26-30 27 2.9630 0.19245 0.03704
31-40 25 2.6400 0.63770 0.12754
41-50 18 2.2778 0.75190 0.17723
51-60 2 2.0000 0.00000 0.00000
Total 105 2.7238 0.56322 0.05496
Spreadsheet Level 16-20 11 2.4545 0.82020 0.24730
21-25 22 2.0909 0.81118 0.17294
26-30 27 2.5556 0.75107 0.14454
31-40 25 2.0800 0.95394 0.19079
41-50 18 1.7778 0.87820 0.20699
51-60 2 1.5000 0.70711 0.50000
Total 105 2.1810 0.87465 0.08536
Presentation Level 16-20 11 2.1818 0.87386 0.26348
21-25 22 1.7727 0.86914 0.18530
26-30 27 1.9259 0.87380 0.16816
31-40 25 1.7200 0.89069 0.17814
41-50 18 1.6111 0.77754 0.18327
51-60 2 1.0000 0.00000 0.00000
Total 105 1.8000 0.85934 0.08386
Table 6: Significance of the participants’ mean score in word processing skills, spreadsheet skills, presentation tool skills, maintenance skills and security skills based on their age
ANOVA
Sum of Squares df Mean Square F Sig.
Security Level Between Groups 3.721 5 0.744 1.078 0.377
Within Groups 68.336 99 0.690
Total 72.057 104
Maintenance level Between Groups 5.382 5 1.076 1.685 0.145
Total 68.629 104
Word Processor Level Between Groups 7.520 5 1.504 5.846 0.000
Within Groups 25.470 99 0.257
Total 32.990 104
Speadsheet Level Between Groups 8.899 5 1.780 2.493 0.036
Within Groups 70.663 99 0.714
Total 79.562 104
Presentation Level Between Groups 4.130 5 0.826 1.125 0.352
Within Groups 72.670 99 0.734
Total 76.800 104
The mean and standard deviation of the participants' scores in word processing skills, spreadsheet skills, presentation tool skills, maintenance skills and security skills based on their self-rated overall computer skills are reported in Table 7. The ANOVA was run at the 0.05 probability level (Table 8) and it was found that there were significant differences in the participants level of competency in word processing (F[4,100]=18.842, p<0.0005); spreadsheet (F[4,100]=10.963, p<0.0005); presentation (F[4,100]=3.931, p=0.005); computer security (F[4,100]=4.475, p=0.002) and maintenance (F[4,100]=6.863, p<0.0005) based on their self-rated overall computer skills. This indicates that there were significant differences in all the ICT competencies of the participants based on their self-rated overall computer skills.
Table 7: Comparison of participants’ score in word processing skills, spreadsheet skills, presentation tool skills, maintenance skills and security skills based on their self-rated overall computer skills.
N Mean Std. Deviation Std. Error
Security Level novice 6 1.0000 0.00000 0.00000
fair 10 1.2000 0.63246 0.20000
average 50 1.4600 0.78792 0.11143
above average 31 1.6452 0.87744 0.15759
expert 8 2.5000 0.75593 0.26726
Total 105 1.5429 0.83238 0.08123
Maintenance level novice 6 1.0000 0.00000 0.00000
fair 10 1.2000 0.63246 0.20000
average 50 1.9000 0.78895 0.11157
above average 31 2.0645 0.72735 0.13064
expert 8 2.6250 0.74402 0.26305
Total 105 1.8857 0.81234 0.07928
Word Processor Level novice 6 1.3333 0.51640 0.21082
fair 10 2.4000 0.51640 0.16330
average 50 2.8400 0.46773 0.06615
above average 31 2.8710 0.34078 0.06121
expert 8 2.8750 0.35355 0.12500
Total 105 2.7238 0.56322 0.05496
Spreadsheet Level novice 6 1.1667 0.40825 0.16667
fair 10 1.2000 0.63246 0.20000
average 50 2.1400 0.83324 0.11784
above average 31 2.6129 0.71542 0.12849
expert 8 2.7500 0.46291 0.16366
Total 105 2.1810 0.87465 0.08536
Presentation Level novice 6 1.0000 0.00000 0.00000
fair 10 1.5000 0.70711 0.22361
above average 31 2.1290 0.88476 0.15891
expert 8 2.2500 0.88641 0.31339
Total 105 1.8000 0.85934 0.08386
Table 8: Significance of participants’ score in word processing skills, spreadsheet skills, presentation tool skills, maintenance skills and security skills based on their self-rated overall computer skills
ANOVA
Sum of
Squares df Mean Square F Sig.
Security Level Between Groups 10.940 4 2.735 4.475 0.002
Within Groups 61.117 100 0.611
Total 72.057 104
Maintenance level Between Groups 14.783 4 3.696 6.863 0.000
Within Groups 53.846 100 0.538
Total 68.629 104
Word Processor Level Between Groups 14.178 4 3.545 18.842 0.000
Within Groups 18.812 100 0.188
Total 32.990 104
Spread sheet Level Between Groups 24.254 4 6.063 10.963 0.000
Within Groups 55.308 100 0.553
Total 79.562 104
Presentation Level Between Groups 10.436 4 2.609 3.931 0.005
Within Groups 66.364 100 0.664
Total 76.800 104
7.5 Research Question 5
To what extent do sex, age and self-rated computer skills, jointly predict the students’ level of competence in productivity tools, maintaining their computer and securing their computer?
The data presented in Table 9 indicates that there are low but positive correlations between the joint effect of the participants' sex, age and their self-rated over-all computer skills with their level of competence in productivity tools, maintaining and securing their computer. The combined factors accounted for 28.9 percent of the variance in word processing (R2=0.289, p<0.0005); 28.5 percent of the variance in spreadsheet (R2=0.285, p<0.0005); 13.6 percent of the
variance in presentation tools skills (R2=0.136, p=0.002); 29.0 percent of the variance in computer security (R2=0.290,
p<0.0005) and 33.2 percent of the variance in computer maintenance (R2=0.332, p<0.0005). In each case the combined
effect of the factors, sex; age and the participants' over-all self-rated computer skill, on their level of competence in productivity tools, maintaining and securing their computer was significant at the 0.05 probability level.
Table 9: Prediction of the students' level of competence in productivity tools, maintaining their computer and securing their computer based on the combined effect of sex, age and their self-rated computer skills
Skill R R2 Adjusted R2 F[3,101] Sig
Word Processing 0.545 0.289 0.276 14.232 0.000
Spreadsheet 0.534 0.285 0.264 13.411 0.000
Presentation 0.369 0.136 0.111 5.317 0.002
Security 0.538 0.290 0.269 13.736 0.000
Maintenance 0.576 0.332 0.312 16.734 0.000
7.6 Research Question 6
productivity tools, maintaining their computer and securing their computer?
Table 10 shows that the highest contribution to word processing is the self-rated over-all computer skill (ȕ=0.421) followed by their age (ȕ=-0.240) then sex (ȕ=-0.33).
Table 10: Relative contribution of sex, age and participants' self-rated over-all computer skill on their level of competency in word processing.
Coefficientsa
Model
Unstandardized Coefficients
Standardized Coefficients
t Sig.
B Std. Error Beta
1 (Constant) 2.291 0.270 8.472 0.000
Female or Male -0.037 0.096 -0.033 -0.389 0.698
Age of Student -0.104 0.038 -0.240 -2.731 0.007
Rate your computer skills 0.253 0.052 0.421 4.837 0.000
a. Dependent Variable: Word Processor Level
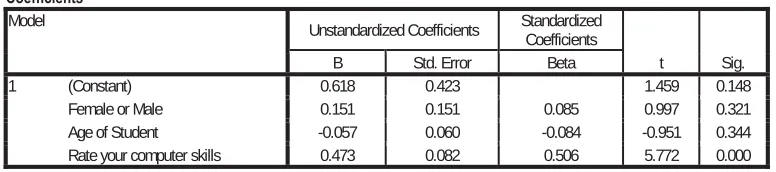
Table 11 shows that the highest contribution to spreadsheet is the self-rated over-all computer skill (ȕ=0.506) followed by their sex (ȕ=-0.085) then age (ȕ=-0.084).
Table 11: Relative contribution of sex, age and participants' self-rated over-all computer skill on their level of competency in spreadsheet.
Coefficientsa
Model Unstandardized Coefficients Standardized
Coefficients
t Sig.
B Std. Error Beta
1 (Constant) 0.618 0.423 1.459 0.148
Female or Male 0.151 0.151 0.085 0.997 0.321
Age of Student -0.057 0.060 -0.084 -0.951 0.344
Rate your computer skills 0.473 0.082 0.506 5.772 0.000
a. Dependent Variable: Speadsheet Level
Table 12 shows that the highest contribution to participants' skills in presentation tools is the self-rated over-all computer skill (ȕ=0.333) followed by their age (ȕ=-0.089) then sex (ȕ=-0.011).
Table 12: Relative contribution of sex, age and participants' self-rated over-all computer skill on their level of competency in presentation tools.
Coefficientsa
Model Unstandardized Coefficients Standardized
Coefficients
t Sig.
B Std. Error Beta
1 (Constant) 1.026 0.457 2.245 0.027
Female or Male -0.019 0.163 -0.011 -0.116 0.908
Age of Student -0.059 0.064 -0.089 -0.916 0.362
Rate your computer skills 0.306 0.089 0.333 3.451 0.001
a. Dependent Variable: Presentation Level
Table 13: Relative contribution of sex, age and participants' self-rated over-all computer skill on their level of competency in securing their computer.
Coefficientsa
Model Unstandardized Coefficients Standardized
Coefficients
t Sig.
B Std. Error Beta
1 (Constant) -0.287 0.402 -0.714 0.477
Female or Male 0.695 0.143 0.413 4.853 0.000
Age of Student -0.059 0.056 -0.093 -1.050 0.296
Rate your computer skills 0.321 0.078 0.361 4.132 0.000
a. Dependent Variable: Security Level
Table 14 shows that the highest contribution to participants' skills in maintaining their computer is the self-rated over-all computer skill (ȕ=0.437) followed by their sex (ȕ=0.369) then age (ȕ=-0.130).
Table 14: Relative contribution of sex, age and participants' self-rated over-all computer skill on their level of competency in maintaining their computer.
Coefficientsa
Model
Unstandardized Coefficients Standardized Coefficients
T Sig.
B Std. Error Beta
1 (Constant) 0.065 0.380 0.172 0.864
Female or Male 0.606 0.136 0.369 4.470 0.000
Age of Student -0.081 0.053 -0.130 -1.524 0.131
Rate your computer skills 0.379 0.074 0.437 5.152 0.000
a. Dependent Variable: Maintenance level
8. Conclusions, Limitations and Future Work
In this study the self-reported ICT competencies of part-time students were investigated. The skills examined were word processing, presentation software, spreadsheets, maintaining a computer and securing a computer. It was found that although a large percentage of the students were skilled or very skilled at word processing (about 94 percent) many of these students were unskilled: in securing their computers (about 67 percent), in using presentation software (about 48 percent), in maintaining their computers (about 39 percent), and in using spreadsheets (about 30 percent).
Furthermore, there were significant differences: in male and female participants’ ability to maintain and secure their computers; between age groups in the use of a word processor and spreadsheet; and participants’ self-rated computer skills and all the competencies investigated.
Although some of these results align well with existing literature others help to provide new incites into an active debate, specifically the fact that significant differences in word processor and spreadsheet competencies were found in favour of non-Millennials.
The generally poor competencies of participants in most of the skills investigated is of grave concern especially since these participants are already part of the workforce and do not have the skills necessary to fuel economic growth as prescribed by the National ICT strategic plan.
Note however that one limitation of this study is that only a small sample of one tertiary institution was investigated. In future work therefore it is necessary to extend the sample to include students entering other tertiary institutions.
References
Atan, H., Azli, N., Rahman, Z and Idrus R. (2002) Computers in distance education: Gender differences in self perceived computer competencies, Journal of Educational Media 27(3), 123-135.
Bayne, S., and Ross, J. (2007). The ‘digital native’ and ‘digital immigrant’: A dangerous opposition. In Paper is presented at the annual conference of the Society for Research into Higher
Education (SRHE), December 2007. <http://www.malts.ed.ac.uk/staff/sian/natives_final.pdf> Retrieved 21.05.13.
Danner, R., B., and Pessu, C., O., A. (2013). A Survey of ICT Competencies among Students in Teacher Preparation Programmes at the University of Benin, Benin City, Nigeria. Journal of Information Technology Education: Research, 12, 33-49.
Caruso and Kvavik (2005). ECAR Study of Students and Information Technology, 2005: Convenience, Connection,Control, and Learning. Educause Center for Applied Research Vol. 6. (Available from http://connect.educause.edu/library/ERS0506.) Gibbs, S. (2008). Internet use equals computer literacy? In Hello! Where are you in the landscape of educational technology?
Proceedings ascilite Melbourne 2008.
Grant, J. M. A., and Walcott, P. A. (2009). Sizing-up Students’ Competencies for Successful Blended Learning, Higher Education in the Anglophone Caribbean, Educación superior y sociedad, 14 (2), 159-170.
Guo, R. X., Dobson, T., and Petrina, S. (2008). Digital natives, digital immigrants: An analysis of age and ICT competency in teacher education. Journal of Educational Computing Research, 38(3):235–254.
Haywood, J., Haywood, D., Macleod, H., Baggetun, R., Baldry, A. P., Harskamp, E., Taira, J. and Tenhonen, P. (2004).A comparison of ICT skills and students across Europe.Journal of eLiteracy, 1, 69-81.
Hew, TS and Leong, LY (2011) An Empirical Analysis of Malaysian Pre-university Students' ICT Competency Gender Differences. International Journal of Network and Mobile Technologies, 2 (1).
Jones, C; Ramanau, R; Cross, S and Healing, G (2010). Net generation or Digital Natives: Is there a distinct new generation entering university? Computers & Education, 54(3), pp. 722–732.
Kim, JM, and Lee, WG (2013). Meanings of criteria and norms: Analyses and comparisons of ICT literacy competencies of middle school students, Computers & Education, 64, 81-94.
Kirkpatrick, H., & Cuban, L. (1998). Should we be worried? What the research says about gender differences in access, use, attitudes, and achievement with computers. Education and Computing, 38(4), 56-61.
Kozma, R. B. (2005). National policies that connect ICT-based education reform to economic and social development. An Interdisciplinary Journal on Humans in ICT Environments, 1(2), 117-156.
Kozma, R., McGhee, R., Quellmalz, E and Zalles, D. (2004). Closing the digital divide: Evaluation of the World Links program.International Journal of Educational Development, 24(4), 361-381.
Leacock, C., Warrican, S., and Rose G. (2009). Research methods for inexperienced researchers. Kingston Jamaica: Ian Randle Publishers.
Oblinger, D. G. (2003). Boomers, gen-xers, and millennials: Understanding the “new students.” EDUCAUSE Review, 38(4), 36-45. Prensky, M. (2001a, September/October). Digital natives, digital immigrants.On the Horizon, 9(5), 1-6. Retrieved April 30, 2003, from
http://www.marcprensky.com/writing/Prensky%20-%20Digital%20Natives, %20Digital%20Immigrants%20-%20Part1.pdf Prensky, M. (2001b, November/December). Digital natives, digital immigrants, part II: Do they really think differently? On the Horizon,
9(6), 1-6. Retrieved April 30, 2003, from http://www.marcprensky.com/ writing/Prensky%20-%20Digital%20Natives,%20Digital%20Immigrants%20-%20Part2.pdf
Rae, S. (2004). Where, when and how do university students acquire their ICT skills? Italics e-Journal, 4, 1, 1–14.
Rajagopal, I and Bojin N (2003) A gendered worlds: Students and Instructional technologies, First Monday18 (1). [Online] Available: http://firstmonday.org/htbin/cgiwrap/bin/ojs/index.php/fm/issue/view/.
Rasit, M.H., Rosli, K. and Ibrahim, M.A. (2012). The ICT Competencies of New Accounting Students of Different Intake Channels: The Case of the Universiti Utara Malaysia. Malaysian Journal of
Educational Technology,12(2), pp. 33-40.
Seungeun, C., Soojin, J., Daiyong, K., Hansung, K., Seungbum, K., JaMee, K., et al. (2011). Measuring achievement of ICT competency for students in Korea.Computers & Education, 56(4), 990–1002.
Sherry, C. A., & Fielden, K. A. (2005). The millennials: Computer savvy (or not?). Paper presented at the Higher Education Research and Development Society of Australia, Sydney, AU
Tavakol, M., and Dennick, R. (2011). Making sense of Cronbach's alpha. International Journal of Medical Education, 2, 53-55. Retrieved from http://www.ijme.net/archive/2/cronbachs-alpha.pdf
VanSlyke, T. (2003). Digital natives, digital immigrants: Some thoughts from the generation gap. Retrieved May 14, 2013, from Commentary Web site: http://www.wisc.edu/depd/html/TSarticles/Digital%20Natives.htm
Walcott, P. A., Grant, J. M. A., and Depradine, C., "Are Students Ready for a Virtual University?", In Proceedings of ED-MEDIA World Conference on Educational Multimedia, Hypermedia & Telecommunications, Vienna, Austria, June 30 - July 4, 2008, pp. 946-951.