Introduction to Control Systems
Problem Set 1 Due : In-class, 10 May 2012
Question 1 Many closed-loop and open-loop control systems can be found in homes. List several examples and provide explanations and justifications for your classifications.
Question 2 One of the important applications of control system is in the air traffic control systems, where engineers are developing an air traffic control system and collision avoidance system by using the Global Positioning System (GPS) navigation satellites. The GPS allows each aircraft to know its position in the air space landing corridor very precisely. Sketch a block diagram depicting how an air traffic controller might use the GPS for aircraft collision avoidance. Provide also necessary justification and explanations.
Question 3 Another interesting application of control system is in the development of an intermittent automobile windshield wiper in which it operates based on the concept of adjusting its wiping cycle according to the intensity of the rain. Sketch a suitable block diagram for a windshield wiper control system.
Note (1) Related articles are attached.
AUTOMATIC AIR COLLISION
AVOIDANCE SYSTEM
Y. Ikeda
B. Nguyen
A. Barileld
B. Sundqvist
S. Jones
JUNE 2002
I
Approved for public release; distribution is unlimited.
© 2002 SICE
This work is copyrighted. The United States has for itself and others acting on its
behalf an unlimited, paid-up, nonexclusive, irrevocable worldwide license. Any other
form of use is subject to copyright restrictions.
AIR VEHICLES DIRECTORATE
AIR FORCE RESEARCH LABORATORY
AIR FORCE MATERIEL COMMAND
WRIGHT-PATTERSON AIR FORCE BASE, OH 45433-7542
suggestions for reducing this burden, to Department of Defense, Washington Headquarters Services, Directorate for Information Operatbns and Reports (0704-0188), 1215 Jefferson Davis Highway, Suite 1204 Arlmgton, VA 22202-4302. Respondents should be aware that notwithstanding any other provision of law, no person shall be subject to any penalty for Ming to comply with a collection of information if it does not display a currently valid 0MB control number. PLEASE DO NOT RETURN YOUR FORM TO THE ABOVE ADDRESS.
1, REPORT DATE (DD-MM-YY)
Jxme 2002
2. REPORT TYPE
Journal Article Preprint
3. DATES COVERED fFrom-To)
4. TITLE AND SUBTITLE
AUTOMATIC AIR COLLISION AVOIDANCE SYSTEM
6, AUTHOR(S)
Y, Bceda (The Boeing Company)
B. Nguyen and A. Barfield (AFRL/VACC) B. Sundqvist (Saab AB)
S. Jones (Lockheed Martin Aeronautics)
7. PERFORMING ORGANIZATION NAME(S) AND ADDRESS(ES)
Lockheed Martin Aeronautics P.O. Box 748
Fort Worth, TX 7610]
The Boemg Company AFRL/VACC
Saab AB
9. SPONSORING/MONrrORING AGENCY NAME(S) AND ADDRESS(ES)
Air Vehicles Directorate Air Force Research Laboratory Air Force Materiel Command
Wright-Patterson Air Force Base, OH 45433-7542
5a, CONTRACT NUMBER
F33615-01-2-3103
5b. GRANT NUMBER
5c. PROGRAM ELEMENT NUMBER
6321IF
5cl. PROJECT NUMBER
486U
5e. TASK NUMBER
17
5f. WORK UNIT NUMBER 00
8. PERFORMING ORGANIZATION REPORT NUMBER
10. SPONSORING/MONITORING AGENCY ACRONYM(S)
AFRLA^ACC
11. SPONSORING/MONITORING AGENCY REPORT NUMBER(S)
AFRL-VA-WP-TP-2002-317
12. DISTRIBUTION/AVAILABILITY STATEMENT
Approved for public release; distribution is unlimited.
13. SUPPLEMENTARY NOTES
To be presented in the Society for Instrument and Control Engineers (SICE) Annual Conference, August 5,2002.
O 2002 SICE. This work is copyrighted. The United States has for itself and others acting on ite behalf an unlimited, paid-up, nonexclusive, irrevocable worldwide license. Any other form of use is subject to copyright restrictions.
The other contract on this report is F33615-01-2-3101 for The Boeing Company.
14. ABSTRACT (Maximum 200 IVords)
This paper presents an algorithm for an Automatic Air Collision Avoidance System under development by the U.S. Ah Force and its Swedish counterpart, Forsvaret Matcrielverk (FMV). The algorithm uses optimal coordmated escape maneuvers to avoid mid-air colhsion, while satisfying the imposed system requirements. In addition, the algorithm can simultaneously accommodate multiple aircraft in a collision course by activating the coordinated escape nmneuvers. On the other hand, the algorithm has logic to allow close formation flight and rejoin without activating the escape maneuver. The algorithm is designed to operate safely against failure and GPS/data link dropout.
IS. SUBJECT TERMS
Air Colhsion Avoidance, Automatic System, Coordinated Escape Maneuver, Nuisance Free, Failure Safe
16. SECURITY CLASSIFICATION OF; a. REPORT
Unclassified
b. ABSTRACT
Unclassified
c. THIS PAGE
Unclassified
17. LIMITATION OF ABSTRACT:
SAR
18. NUMBER OF PAGES
12
19a, NAME OF RESPONSIBLE PERSON (Monitor)
Ba Nguyen
19b. TELEPHONE NUMBER (Include Area Code)
(937)255-1135
Y. Ikeda', B. Nguyen^ A. Barfield^ B. Sundqvist^ S. Jones*
1 The Boeing Company, P.O. Box 516, St. Louis, MO 63166-0516, U.S.A. 2 Air Force Research Laboratory, AFRL/VACC, WPAFB, OH 45433, U.S.A.3 Saab AB, Linkoping, Sweden
4 Lockheed Martin Aeronautics, P.O. Box 748, Fort Worth, TX 76101, U.S.A.
Abstract: This paper presents an algorithm for an Automatic Air Collision Avoidance System under development by the U.S. Air Force and its Swedish counter part, Forsvaret Materielverk (FMV). The algorithm uses optimal coordinated escape maneuvers to avoid mid-air collision, while satisfying the imposed system requirements. In addition, the algorithm can simultaneously accommodate multiple aircraft in a collision course by activating the coordinated escape maneuvers. On the other hand, the algorithm has logic to allow close formation flight and rejoin without activating the escape maneuver. The algorithm is designed to operate safely against failure and GPS / data link dropout.
Keywords: Air Collision Avoidance, Automatic System, Coordinated Escape Maneuver, Nuisance Free, Failure Safe
Introduction: The United States Air Force (USAF) Safety Center has reported that mid-air collisions are the leading cause of fighter aircraft losses. Mid-air collisions pose a threat to aviation safety whether it is air-to-air combat training or a formation rejoin mission. The Swedish AF recently had an incident where the flight lead was almost hit by his wingman during air-to-air combat training. Tomorrow's USAF will use uninhabited air vehicles (UAVs) for a number of missions. High-risk missions are ideal candidates for these vehicles. However, for them to realize their full potential and become an integral part of USAF airspace operations, they must be safe to operate in the same airspace with manned aircraft. For manned aircraft, several air colUsion avoidance systems are in use that alert pilots to potential collisions at distances of several miles. All of these systems require pilot action to avoid the collision. These manual collision avoidance systems often create nuisance events that interfere with the pilot's ability to perform the mission. Pilots quickly become tired of nuisance alerts and turn the systems off.
Currently, the United State Air Force Research Laboratory, The Boeing Company, Lockheed Martin, FMV, and Saab are jointly developing the Automatic Air Collision Avoidance System (Auto ACAS). The program is divided into two phases; a conceptual study phase (phase 1), and a
system design and flight test phase (phase 2). Boeing, Saab and Lockheed Martin completed phase 1 in May, 2001. During this phase, Saab and Boeing developed two different algorithms. The architecture of the Boeing algorithm was presented in Reference 1. The system design and flight test phase started in August 2001 and will be completed in August 2003. Saab and Boeing are jointly developing a generic algorithm as a result of the study phase. Lockheed Martin will tailor the algorithm and integrate it into an F-16 for flight test in July 2003.
designed to meet the requirements follows. Simulation results showing the performance of the algorithm are also presented. Finally, the ACAS algorithm development status is summarized in the concluding remarks.
1. Algorithm Architecture
Figure 1 illustrates the architecture of the algorithm. The algorithm operates with three basic assumptions. First, because all aircraft maneuver to avoid collision, all aircraft must operate with data provided at the same absolute time. For data received over a data link, this means that the data latency must be considered, and dead-reckoning correction must be applied to bring all data to the same absolute time. Second, the computations in each aircraft processor must result in the same escape maneuver, so the algorithm in each aircraft must operate on the same data. Third, the escape angle computed by each aircraft must not be allowed to vary by a large amount as the time to perform the escape maneuver approaches, since the escape solution for all aircraft must be stable.
Aircraft Response Model (AARM) for a zero- bank escape, and two other escapes are computed at a preselected maximum spread angle using the Simplified Aircraft Response Model (SARM).
Data Link Data In
Brings in data for "In-Network" intruders. Out-Network
Brings in data for "Out-Network" intruders such as radar, sensor, or third-party data.
Coarse Filter
Selects up to three intruders (aircraft other than your own) that should be considered the biggest threats to the host (your ovra aircraft). Selected aircraft are evaluated by the remainder of the algorithm.
Dead Reckon
Adjusts intruder and host data so that all aircraft (intruders and host) are evaluated at the same absolute time. Positions are corrected using constant velocities and known data latencies.
Intruder Data In
n=>
'==0
^
Data Link Out-Network
Dead Reckon
Escape Angle Selection
Collision Detection
SARM
C=>
^=>
t=>
^=>
C=>
Coarse Filter
Correct Flight Path
AARM
Roll Logic
Host Data Out Data Link
«==>
maneuverability. If a tanker and a fighter are on a collision coarse, for instance, then the fighter (more maneuverable than a tanker) maneuvers first to get out of the tanker's flight path. In this process, the tanker's flight path is corrected such that it flies straight along the current velocity vector. Flight correction is also made when the host is uninhabited and intruders are inhabited. Due to system requirement No. 8 discussed above, the inhabited aircraft flies a straight path along the current velocity vector and the uninhabited aircraft gets out of the way.
Escape Angle Selection
Compares all possible combinations of each intruder's three escape maneuvers (single straight-line flight for out-network intruders) with the host's three escape maneuvers. Escape maneuvers are provided by the projected aircraft position at 0, 3, and 6 seconds away fi-om the current time using the fly out model. Escape maneuvers are compared along a quadratic fit to the three time points, and the minimum separation distance (MSD) and minimum separation time are computed. Computes the reciprocals of each MSD, and computes the sum of the reciprocals for each multiple-intruder case. Selects the preferred host escape maneuver that corresponds to the minimum of the reciprocal sums. Returns the angle of the preferred host escape maneuver as the Escape Angle.
AARM
Accurate Aircraft Response Model is a detailed model of the host aircraft. Degrees-of-freedom depend on accuracy desired. .Calculates the Escape Maneuver along the Escape Angle provided using aircraft state information. Output is position at 0, 3, and 6 seconds, and velocity at 0 and 6 seconds.
Collision Detection
Computes the Minimum Safety Separation Distance (MSSD) based on host and intruder AARM data plus a radius of uncertainty in current and fiiture positions. The time at minimum separation fi-om Escape Angle Selection is used as a first approximation. The MSSD and time at MSSD are returned. If MSSD is zero, an escape maneuver command is sent to the host flight controls. If the host and closest mtruder are converging, computes the
Determines how much the escape angle solution can vary fi-om fi-ame to flame by limiting the spread between the computed AARM and two SARMs. The logic compares data fi-om older fi-ames with the last frame to determine where to recenter the escape angle search for the current computational frame. The spread of the SARMs is increased if the solution is changing rapidly or decreased if the solution is stable. However, changes in the spread of the SARMs are limited to small amounts as the time until maneuver execution decreases in order to keep the overall solution stable for all aircraft.
SARM
Simplified Aircraft Response Model is a simplified 4-degree-of-freedom model of an aircraft with specific available g and available roll rate supplied by the host aircraft. Calculates the Escape Maneuver along the Escape Angles at the spread provided by Roll Logic. The model uses aircraft state information from the host. Output is position at 0, 3, and 6 seconds.
Data Link Data Out
Sends host data to "In-Network" intruders. 2. Algorithm Description
6 sec
6 sec
Intruder
Figure 2. 6 seconds long flight envelope confining flight paths associated with the 3 possible maneuvers
Host
aht'+bbt+Ch
Intruder
Figure 3. Quadratic Curve Fit using 0, 3, 6 seconds position along a flight path.
Since each approximated flight path is represented by a second order polynomial fiinction in time of the form
a.t'' + b.t + c (1)
the necessary condition for optimality applied to a norm of relative position
Tmin so determined, it is an easy exercise to find the minimum separation distance.
To find the best combination of escape maneuvers between the host and intruders, the minimum separation distance for each possible combination of escape maneuvers is first calculated. Here, each aircraft has three possible choices of escape maneuver in the optimization process. The first one is roll with a bank angle selected in the previous iteration together with simultaneous pull with the maximum allowable normal acceleration (Nz) command. The second and the third ones are rolls with plus and minus delta bank angle around the first one, respectively, together with the simultaneous pull with the maximum allowable Nz command. Thus, there are nine possible combinations of escape maneuvers between a host and an intruder. In addition, this process is repeated for each intruder. Therefore, three (the maximum number of intruders) times nine (number of possible combination of escape maneuver between a host and an intruder) minimum separation distances are calculated. Among all the possible maneuver combinations, the one which gives rise to the minimum reciprocal sum of minimum separation distances is selected as the optimal combination of the escape maneuvers. The reason for minimizing the reciprocal sum of minimum separation distances as opposed to maximizing the sum of minimum separation distances is to penalize the combinations of the escape maneuvers that provide the worst separation distances.
2,2 Escape Maneuver Activation and Termination
The escape maneuver determined via the optimization process is activated when the predicted minimum separation distance becomes smaller than the prescribed minimum safety distance. To increase the accuracy of this prediction, the distance between the host and the intruder is recalculated based on the flight path which is curve fitted by cubic spline using the position and velocity information at 0, 3, and 6 seconds. The escape maneuver is terminated when the separation distance starts increasing, i.e., when the minimum separation has been reached. This satisfies system requirement No.
1 discussed earlier.
non-linear simulation in different collision scenarios are discussed. Basic collision scenarios such as head-on, trail, and beam (90 degree aspect angle) are used to test the performance of the algorithm. A PC-based desktop flight simulator called D-Six (a product of Bihrle Applied Research, Inc) is used to perform simulation. D-Six executes the Auto ACAS algorithm using non-linear 6 DOF equations of motion.
Head-on Collision Scenario: To evaluate a case of high closure rate, a head-on collision scenario was simulated. Host and an intruder both fly at Mach 0.65, 7 km altitude in a head-on collision course, resulting in 430 m/sec closure rate. Figure 4 shows the resulting optimal combination of escape maneuvers (far left), escape maneuver activation status (middle), and the separation distance between the host and intruder (far right). In the far left plots, bank angle and ACAS roll command are shown with a blue curve and a red curve, respectively. It can be seen that both aircraft turned 1 radian or about 60 degree right to avoid collision.. In the middle plots, the status of escape maneuver activation is shown where 1 means active and 0 means non- active. The plots show that it took a little over 2 seconds to complete the escape maneuver. In the far right plots, separation distance (blue) is shown against the prescribed minimum safety distance (red). The plots for both the host and intruder show that the minimum separation achieved is 80m against the minimum safety separation of 100m, resulted in 20 % penetration. Trail Collision Scenario: To evaluate a case of low closure rate, a trail collision scenario was simulated. The host flies at Mach 0.7, 7 km altitude, while the intruder flies at Mach 0.65, 7 km altitude, resulted in 30m/sec closure rate. The far left plots in Figure 5 shows that the host and intruder chose opposite direction for roll of about 60 degree. The middle plots show that time to complete the escape maneuver is less than a second, much less than that for the high closure rate case. The far right plots show that the minimum separation achieved is about 100m, almost no penetration into the safety bubble.
1.00 0.00
■^ -1.00 .2.00 .3.00
p-Slxl.T.
3.00 200 1.00 O.0O -1.00 .2.00 .3.00
IZ
0 12 3 4 Tkne
.•-Dmselect
/
0 1 2 3 4 6 7 Tim
12 3 4 6 7 r«Tie
(a)
fj^--
2 9 4 6 Tttx
2 3 4
140 120 too
20 0
0 12 3 4 6 7 ThK
(b)
Figure 4. Head-on Collision Scenario - (a) Intruder, (b) Host
>Slx1.7
3.0O 2.00 1.00 O.00 .1.00 -2.00 J.0O
.•"flrwwSnri
a-sixi.7
3.00 2.x 1.00 000 .100 .2.00
.*-DftiSstecl
'
i>^'^
' ■ I 1 1
4 Tkne
140 130 icn
4 Time
.«- TkTi^Un.'>nA -t^ r»™4iW^^n (a)
1 ■
T
L^.-- — Z^ —• 1—1 1—1 .11
40 20
(b)
Figure 5. Trail Collision Scenario - (a) Intruder, (b) Host
4. Conclusions
Simulation results to date indicate that the Automatic Air Collision Avoidance System presented in this paper meets the basic requirements. In particular, it seems promising that the system can provide mid-air collision protection for fighter aircraft during combat training and formation flight without interfering with the pilot's mission. There is more logic developed and implemented in the system than is presented in this paper such as logic to accommodate time delay, data dropout, failure
mode, close formation flight and so on. Discussion on these issues is deferred to a future paper due to limited space. The system will be flight tested in July, 2003.
Reference
tinuously on a jet transport aircraft in today’s environ-ment could expect to survive more than 11,000 years of travel before becoming the victim of a mid-air collision. This accomplishment has only recently been realized. As shown in Figure 1, the number of hours flown annu-ally by jet transport aircraft has more than quadrupled since 1970, but the rate of mid-air collisions over that period of time has dropped by an order of magnitude. The result is that today we can expect one mid-air colli-sion every 100 million flight hours. Such an exceptional safety level was achieved through advances in air traf-fic surveillance technology and relentless attention to improving operational procedures. But as the Septem-ber 2006 mid-air collision between a Boeing 737 and an Embraer Legacy 600 business jet over the Amazon jungle in Brazil demonstrates, maintaining safety is an ever present challenge. This challenge has been eased, but not eliminated, with the development and deploy-ment of TCAS.
TCAS is one component of a multi-layered defense against mid-air collisions. The structure of airspace and
A
collision between aircraft is one of the most sudden and catastrophic transportation accidents imaginable. These tragic events are rarely survivable—hundreds of people may die as the two aircraft are destroyed. In response to this threat, Lincoln Laboratory has been pursuing surveillance and alerting system technologies to protect aircraft opera-tions both on the ground and in the air. Recent devel-opments in the Runway Status Lights Program, for ex-ample, greatly reduce airport-surface collision risk due to runway incursions [1]. In the air, other systems have been developed and are currently in use to prevent mid-air collisions. This article focuses on the widely fielded, crucial technology called the Traffic Alert and Collision Avoidance System (TCAS). In the context of integrated sensing and decision support, TCAS illustrates the par-ticular challenge of developing effective decision aids for use in emergency situations involving extreme time pressure.Despite the terrifying prospect of a mid-air collision, aviation travel is incredibly safe. A person who flew
con-The Traffic Alert and Collision
Avoidance System
James K. Kuchar and Ann C. Drumm
n The Traffic Alert and Collision Avoidance System (TCAS) has had
operational procedures provide the first, strategic layer of protection. Traffic flows are organized along airways at segregated altitudes to aid air traffic controllers (ATC) in managing aircraft and predicting potential conflicts well before problems arise. Aircraft are normally kept three to five miles apart laterally or 1000 ft vertically, to provide sufficient safety margins. Air traffic control ensures that separation minima are not violated by is-suing tactical commands (including altitude restrictions and heading change vectors) to the pilots in response to nearby traffic. Should these nominal traffic separation processes fail, the TCAS system aids pilots in visually acquiring potential threats and, if necessary, provides last-minute collision avoidance guidance directly to the flight crew.
It is obviously imperative that TCAS alert the flight crew early enough that evasive action can be taken. But it is also important that TCAS not alert unnecessarily. Collision avoidance alerts represent high-stress, time-critical interruptions to normal flight operations. These interruptions, in addition to distracting the aircraft’s crew, may lead to unnecessary maneuvering that dis-rupts the efficient flow of traffic and may over time also cause pilots to distrust the automation.
This article outlines some of the challenges in achiev-ing this balance. A critical aspect is the need to accu-rately model sensors, system dynamics, and human in-volvement in the collision avoidance process. The wide deployment of TCAS provides a wonderful opportunity to collect feedback on performance and to understand the environment in which the system operates. It also
highlights the fact that TCAS does not operate in a vacuum and any technologi-cal progress needs to mesh into a contin-uously operating environment.
history
Interest in development of a collision avoidance system dates back to at least the mid-1950s, when a mid-air collision occurred between two U.S. air carrier air-craft over the Grand Canyon. For several decades thereafter, a variety of approach-es to collision avoidance were explored, until 1974, when the Federal Aviation Administration (FAA) narrowed its fo-cus to the Beacon Collision Avoidance System (BCAS), a transponder-based airborne system. In 1978, a second mid-air collision occurred near San Diego between an air carrier and a general-aviation aircraft, leading to the expansion of the BCAS effort; in 1981, the name was changed to the Traffic Alert and Collision Avoidance System (TCAS). A third mid-air collision in 1986 near Cerritos, Cali-fornia, prompted Congress in 1987 to pass legislation requiring the FAA to implement an airborne collision avoidance system by the end of 1992. The mandate ap-plied to all large (more than 30 passenger seats) turbine-powered aircraft in the United States. A subsequent law extended the original deadline by one year to the end of 1993. The first commercial TCAS systems began flying in 1990.
Monitoring and safety assessments led to a series of changes resulting in an international version of TCAS— referred to as Version 7, or the Airborne Collision Avoidance System (ACAS). Starting in January 2003, the International Civil Aviation Organization mandated the use of ACAS worldwide for all turbine-powered air-craft with passenger capacity of more than 30 or with maximum take-off weight exceeding 15,000 kg. In Jan-uary 2005, that mandate was extended to cover aircraft with more than 19 passenger seats or maximum take-off weight of more than 5700 kg. Today, more than 25,000 aircraft worldwide are equipped with TCAS.
Lincoln Laboratory’s involvement in BCAS/TCAS dates back to 1974, when the FAA tasked the Labora-tory to develop the surveillance subsystem and MITRE Corp. to develop the collision avoidance algorithms, also known as the threat logic. Lincoln Laboratory’s
sur-FIGURE 1. Worldwide annual flight hours and mid-air collision rate (collision rate based on a ten-year moving average). Flight hour data are from Boeing.
1990 2004
10
0 20 30 40
1995 1985
1980 1975 1970 0 0.02 0.04 0.06 0.08 0.10
2000 Mid-air collision rate
(per million flight hours)
Worldwide annual jet transport flight hours
(millions)
veillance activities continued throughout the next three decades; significant development took place during the BCAS-to-TCAS transition and during the design of TCAS Version 7 [2].
Lincoln Laboratory was involved in two additional TCAS activities besides surveillance development. In the mid-1970s the Laboratory, using first a Lincoln Labora-tory–developed prototype Mode S sensor and then FAA production Mode S sensors, began TCAS-related moni-toring of aircraft in the Boston airspace. Early monitor-ing focused on identifymonitor-ing transmitted data errors that would impact the performance of a collision avoidance system, such as garbled aircraft-reported altitude. Later monitoring focused on assessing the appropriateness of collision avoidance advisories and the impact of these advisories on airspace operation.
In the mid-1990s, the Laboratory undertook a third area of activity—assessing the threat logic. Because of the growing complexity of the threat logic, Lincoln Laboratory and the FAA William J. Hughes Technical Center began developing simulation and analysis tools to perform specific types of threat-logic assessment. This work was a precursor to the much more complex Lin-coln Laboratory simulation tool that we describe later.
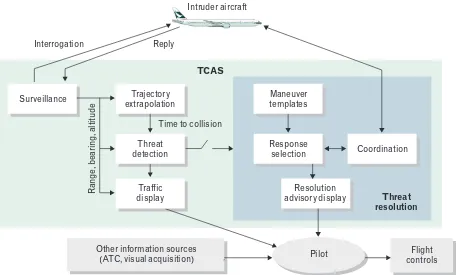
how TcaS Works
TCAS processes are organized into several elements, as shown in Figure 2. First, surveillance sensors collect state information about the intruder aircraft (e.g., its relative position and velocity) and pass the information to a set of algorithms to determine whether a collision threat ex-ists. If a threat is identified, a second set of threat-reso-lution algorithms determines an appropriate response. If the intruder aircraft also has TCAS, the response is coordinated through a data link to ensure that each aircraft maneuvers in a compatible direction. Collision avoidance maneuvers generated and displayed by TCAS are treated as advisories to flight crews, who then take manual control of the aircraft and maneuver accord-ingly. Pilots are trained to follow TCAS advisories unless doing so would jeopardize safety. The following sections provide more detail on the methods used to perform surveillance, threat detection, and threat resolution.
Surveillance
Surveillance of the air traffic environment is based on air-to-air interrogations broadcast once per second from antennae on the TCAS aircraft using the same
frequen-Threat resolution
Coordination Response
selection
Pilot Traffic
display Threat detection Trajectory extrapolation Surveillance
Time to collision Reply
Interrogation
Intruder aircraft
TCAS
R
an
ge
, b
ea
ri
ng
, a
lti
tu
de
Flight controls Other information sources
(ATC, visual acquisition)
Maneuver templates
Resolution advisory display
cy (1030 MHz) and waveform as ground-based air traf-fic control sensors [3]. Transponders on nearby intruder aircraft receive these interrogations and send replies at 1090 MHz. Two types of transponders are currently in use: Mode S transponders, which have a unique 24-bit identifier, or Mode S address, and older Air Traffic Con-trol Radar Beacon System (ATCRBS) transponders, which do not have unique addressing capability. To track ATCRBS intruders, TCAS transmits “ATCRBS-only all-call” interrogations once per second; all ATCRBS aircraft in a region around the TCAS aircraft reply. In contrast, Mode S–equipped intruders are tracked with a selective interrogation once per second directed at that specific intruder; only that one aircraft replies. Selective interrogation reduces the likelihood of garbled or over-lapping replies, and also reduces frequency congestion at 1030/1090 MHz.
Replies from most ATCRBS and all Mode S tran-sponders contain the intruder’s current altitude above sea level. TCAS computes slant range on the basis of the round-trip time of the signal and estimates the bear-ing to the intruder by usbear-ing a four-element directional antenna. Alpha-beta and non-linear filters are used to update range, bearing, and altitude estimates as well as to estimate range rate and relative-altitude rate. Mode S transponders also provide additional data-link
capabili-ties. All aircraft with TCAS are equipped with Mode S transponders so that this data link can coordinate colli-sion avoidance maneuvers.
One of the most difficult challenges in the develop-ment of TCAS is balancing the surveillance require-ments of TCAS and air traffic control ground sen-sors—in particular, managing their shared use of the 1030/1090 MHz frequencies. As the density of TCAS-equipped aircraft grows, transponders in an airspace are interrogated by more and more TCAS units. As a result, transponders now devote more of their time to respond-ing to TCAS and less of their time respondrespond-ing to ground interrogations. Because of concerns about frequency congestion, TCAS uses interference-limiting algorithms to reduce competition between TCAS and ground sen-sors. Each second, TCAS determines the number and distribution of other TCAS units in its vicinity. With that information, TCAS can reduce its maximum trans-mit power (i.e., reduce its surveillance range)—litrans-miting the impact on the victim transponders and, in turn, on the ground sensors.
National and international requirements in this area are quite strict. Interference limiting is intended to en-sure that for any given transponder, no more than 2% of its available time is consumed in communications with all nearby TCAS units. Because TCAS requires a
mini-mum surveillance range to provide adequate collision avoidance protec-tion, however, a limit is imposed on how much the TCAS transmit pow-er can be reduced. As a result, it is possible for a transponder to exceed the 2% utilization figure in high-density airspace. Transponder uti-lization due to TCAS has been the focus of worldwide monitoring, and monitoring results continue to mo-tivate the development of innova-tive TCAS surveillance techniques. Many such techniques were devel-oped for Version 7, including using Mode S interrogation schemes that are different for distant, non-threat-ening intruders than for potential threats, and transmitting sequences of variable-power ATCRBS interro-gations to reduce garble, or overlap, among concentrations of ATCRBS
intruders. In addition, standards are nearing completion for TCAS Hybrid Surveillance. This is a new technique that allows TCAS to make use of passive (Automatic Dependent Surveillance–Broadcast, or ADS-B) trans-missions, thereby reducing TCAS interrogation rates.
Two other issues affect the ability of TCAS to track intruders. First, some older transponders do not report altitude information when interrogated. TCAS can not generate collision avoidance commands against these threats. (Large aircraft, aircraft flying in the vicinity of large airports, and aircraft flying above 10,000 ft are re-quired to be equipped with altitude-reporting ders.) Second, aircraft without a functioning transpon-der cannot be detected or tracked by TCAS at all. Some small aircraft, such as gliders or ultralights, may not carry any electronic equipment or transponders. Pilots therefore must take the responsibility to see and avoid such traffic.
Threat Detection and Display
TCAS’s complex threat-detection algorithms begin by classifying intruders into one of four discrete levels [4]. To project an aircraft’s position into the future, the sys-tem performs a simple linear extrapolation based on the aircraft’s estimated current velocity. The algorithm then uses several key metrics to decide whether an intruder is a threat, including the estimated vertical and slant-range separations between aircraft. Another parameter, called tau, represents the time until the closest point of approach between aircraft.
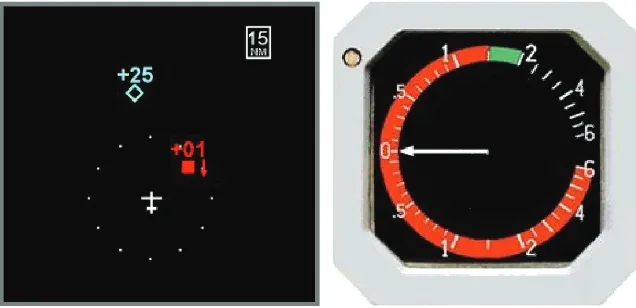
A display in the cockpit depicts nearby aircraft, in-dicating their range, bearing, and relative altitude; an arrow indicates whether the intruder is climbing or de-scending. Such traffic display information aids the pi-lot when attempting to visually acquire traffic out the windscreen. Distant, non-threatening aircraft appear as hollow diamond icons. Should the intruder close within certain lateral and vertical limits, the icon changes to a solid diamond, alerting the flight crew that traffic is proximate but is not yet a threat.
If a collision is predicted to occur within the next 20 to 48 seconds (depending on altitude), TCAS issues a traffic advisory (TA) in the cockpit. This advisory comes in the form of a spoken message, “traffic, traffic.” The traffic icon also changes into a solid yellow circle. The TA alerts the pilot to the potential threat so that the pilot can search visually for the intruder and commu-nicate with ATC about the situation. A TA also serves
as a preparatory cue in case maneuvering becomes re-quired. If the situation worsens, a resolution advisory (RA) warning is issued 15 to 35 seconds before collision (again depending on altitude). The RA includes an aural command such as “climb, climb” and a graphical display of the target vertical rate for the aircraft. A pilot receiv-ing an RA should disengage the autopilot and manually control the aircraft to achieve the recommended vertical rate. Figure 3 shows both the traffic and RA displays.
Threat Resolution
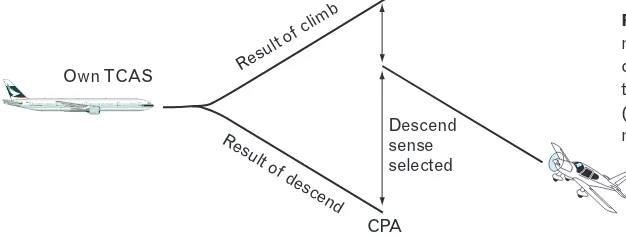
Once the criteria for issuing an RA have been met, TCAS’s threat-resolution algorithms determine what maneuver is appropriate to avoid a collision. First, the algorithm decides the vertical sense of the maneu-ver—that is, whether the aircraft needs to climb or to descend. Second, the system figures the strength of the RA—that is, how rapidly the plane needs to change its altitude. TCAS works only in the vertical direction; it does not select turning maneuvers, because bearing ac-curacy is generally not sufficient to determine whether a turn to the left or right is appropriate.
Figure 4 shows a simplification of the sense-selection process. In general, two maneuver templates are exam-ined: one based on a climb, and one based on a descent. Each template assumes a 5 sec delay before a response begins, followed by a 0.25 g vertical acceleration until reaching a target vertical rate of 1500 ft/min. In the meantime, the intruder aircraft is assumed to continue in a straight line at its current vertical rate. The TCAS algorithm selects the maneuver sense providing the larg-est separation at the predicted closlarg-est point of approach. In the situation shown in Figure 4, TCAS would on the basis of these criteria advise the aircraft to descend.
If the intruder is also TCAS equipped, the sense of the RA is coordinated through the Mode S data link to ensure that both aircraft do not select the same verti-cal sense. Should both aircraft simultaneously select the same sense—say, both select a climb RA—the aircraft with the lower numerical-valued Mode S address has priority and will continue to display its climb RA. The aircraft with the higher Mode S address will then reverse its sense and display a descend RA.
requires the smallest vertical-rate change that achieves at least a certain minimum separation. In the example shown in Figure 5, the TCAS aircraft is currently de-scending at a rate of 1000 ft/min when an RA is issued. Five maneuver templates are examined, with each tem-plate corresponding to a different target vertical rate. The minimum-strength maneuver that would provide the required vertical separation of at least 400 ft would be to reduce the descent rate to 500 ft/min; the pilot would receive an aural message stating that instruction. Descent rates exceeding 500 ft/min would appear in red on the RA display. Note that in Figure 5 if the intruder were 100 ft higher, then the selected RA would instead be “don’t descend.” If the intruder were another 100 ft higher still, the selected RA would be “climb.”
Due to TCAS’s 1 Hz update rate and filtering lags, its estimates may lag the actual situation during peri-ods of sudden acceleration. This lag may in turn lead to an inappropriate RA sense or strength. To help allevi-ate this problem, TCAS refrains from issuing an RA if there are large uncertainties about the intruder’s track.
TCAS also includes algorithms that monitor the evolu-tion of the encounter and, if necessary, issue a modified RA. The strength of an RA can be increased—for ex-ample, changing from “don’t descend” to “climb” (target rate of 1500 ft/min) to “increase climb” (target rate of 2500 ft/min). Under certain conditions, if it becomes clear that the situation is continuing to degrade, TCAS can even reverse the sense of the RA, from climb to de-scend, or vice versa. Coordination of this reversal with a TCAS-equipped intruder aircraft will also be performed through the Mode S data link. Sense reversal is especial-ly challenging because onespecial-ly a few seconds may remain before collision. Any latencies involved in pilot and air-craft response could result in an out-of-phase response that further reduces separation.
Performance assessment
The main functions of TCAS are to identify a poten-tial collision threat, communicate the detected threat to the pilot, and assist in the resolution of the threat by recommending an avoidance maneuver. As an alerting
FIGURE 5. Once TCAS determines whether to advise an aircraft to climb or to descend, it calculates the speed at which the plane must maneuver to avoid collision. TCAS selects the template that requires the smallest change in vertical rate that achieves the required separation.
Own TCAS
Vertical separation (feet) at closest point of approach
600
500
400 Required
minimum separation 300
200
100
Resu lt of c
limb
Resu lt of l
imit d esce
nt 1000 ft/ min Resu
lt o f lim
it d es
ce nt 2
000 ft/m
in
Result of limit desce nt 500 ft/min
Result of don’t descend
Resul t of cli
mb
Resu lt of d
escend
CPA Descend sense selected Own TCAS
system, TCAS operates quietly in the background most of the time. When the algorithms determine that action is needed, TCAS interrupts the flight crew to bring the threat to their attention. This interruption may be vi-tally important if the pilots are not aware of the threat. In some situations, however, aircraft may operate safely close together; in those cases, the TCAS alerts are more of a nuisance than a help. An example is during an ap-proach to closely spaced parallel runways. In good vis-ibility conditions, pilots can be given the authority to maintain separation from parallel traffic by monitoring nearby aircraft visually through the windscreen. TCAS, however, does not know that visual separation is being used and may issue a TA or an RA, thus introducing a distraction on the flight deck when pilots should be especially focused on performing their approach proce-dures. TCAS does inhibit issuing RAs when an aircraft is less than 1000 ft above the ground, both to reduce nuisances at low altitude and to help ensure that any TCAS advisories do not conflict with potential terrain hazards.
TCAS operates in a complex, dynamic environment. Each decision maker (Air Traffic Control, pilots, TCAS itself) uses different information sources and operates under different constraints and with different goals. TCAS may have more accurate range or altitude in-formation about an intruder than flight crews or ATC do. But TCAS cannot observe all the factors affecting a traffic encounter, such as the location of hazardous weather, terrain, aircraft without transponders, or ATC instructions—a major reason that TCAS is certified to operate only as an advisory system. Pilots are ultimately
responsible for deciding on the correct course of action, weighing TCAS alerts with the other information avail-able to them.
TCAS is extremely successful in providing a last-re-sort safety net, and does not necessarily need to operate perfectly to be effective. Still, it is important to iden-tify situations where TCAS may have difficulty—and, if possible, modify the logic to better handle such circumstances.
Lessons from a disaster
On the night of 1 July 2002, a Boeing B-757 oper-ated by the cargo carrier DHL collided with a Russian Tu-154 passenger jet at 34,940 ft over the small town of Überlingen, Germany (Figure 6). The accident de-stroyed both aircraft and killed all 71 crew members and passengers aboard the two planes. What was especially troubling about this accident is that both aircraft were equipped with TCAS.
As with most aviation accidents, a string of events occurred leading up to the collision. First, the nominal separation standards between aircraft were lost through a combination of problems and errors at the air traffic control facility monitoring the aircraft. As a result, the two aircraft were on a collision course much closer to-gether than is normal while cruising at 36,000 ft.
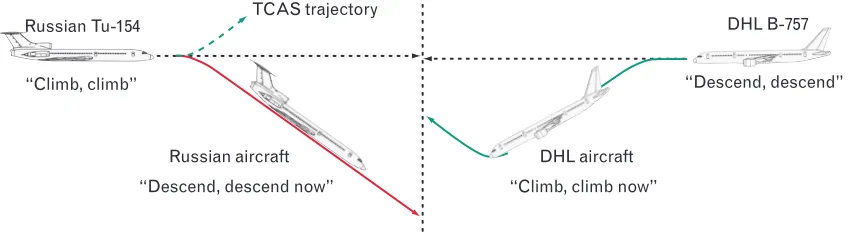
Figure 7 schematically summarizes the event. Forty-three seconds before the collision, ATC instructed the Russian aircraft to descend because of the traffic con-flict. Before the controller finished his verbal instruc-tion, however, TCAS on the Russian aircraft issued an RA advising the pilot to climb. A coordinated descend
Russian Tu-154
DHL B-757
RA was issued on the DHL aircraft at the same time. The DHL pilots followed their RA and began to de-scend; the Russian flight crew followed the ATC instruc-tion and also descended. Shortly thereafter the RAs on each aircraft were strengthened to “increase climb” on the Russian aircraft and “increase descent” on the DHL aircraft. About 35 seconds after the TCAS RAs were is-sued, the aircraft collided.
One of the immediate causes for the accident, as described in the German accident report, was the fact that the Russian flight crew chose to follow the ATC clearance to descend rather than follow the TCAS RA to climb [5]. The Russians’ choice to maneuver opposite to the RA defeated the coordination logic in TCAS. An advisory system like TCAS cannot prevent an accident if the pilots don’t follow the system’s advice. The DHL crew, however, did follow the TCAS RA and yet they still collided. The question thus arises: why didn’t TCAS reverse the sense of the RAs when the situation con-tinued to degrade? Had it done so, the Russian aircraft would have received a descend RA, which presumably it would have followed, since the crew had already decided to descend in response to the ATC clearance. The DHL aircraft would have received a climb RA, which it like-wise would have presumably followed, since its crew had obeyed the original RA. This is not to say that a reversal is always a good idea, however. In many encounters, a reversal would reduce separation and increase the risk of a collision. Because of sensor limitations and filtering lags, it turns out to be quite difficult to trigger reversals when they are needed while avoiding them when they are not needed.
A closer examination of the reversal logic revealed several areas in which earlier design assumptions proved inadequate in situations when one aircraft maneuvers
opposite to its RA. In order for an RA reversal to be issued, the Version 7 threat logic requires four basic con-ditions to be satisfied; these concon-ditions are illustrated in Figure 8. First, a reversal will be triggered only by the aircraft with priority—that is, the aircraft with the lower Mode S address. If the aircraft has a higher Mode S ad-dress than the intruder, the RA sense will be reversed only when directed to do so by the priority aircraft through the data link. Second, the maneuver templates projecting the situation into the future need to predict that insufficient separation between aircraft will oc-cur unless a sense reversal is issued. Third, a maneuver template projecting the response to a reversed-sense RA needs to predict adequate separation between aircraft. Fourth, the two aircraft in danger of colliding must be separated by at least 100 ft vertically. (This last condi-tion is intended to prevent reversals from occurring just as aircraft cross in altitude.)
A closer look at the Überlingen accident, as shown in Figure 9, reveals why TCAS did not issue an RA rever-sal. Responsibility for triggering the reversal rested with the Russian aircraft, which had a lower Mode S address. The Russian aircraft was operating under an active climb RA. The climb-RA maneuver template predicted adequate separation between aircraft, at least until the final few seconds; therefore, TCAS did not issue an RA reversal. Since the Russian aircraft was not actually fol-lowing the climb maneuver, of course, the template’s predictions were invalid.
What is startling, however, is that even if the DHL aircraft had the lower Mode S address (and therefore priority), the planes still probably would have collided. In the hypothetical case in which the DHL aircraft had priority, three of the four conditions required to trig-ger a reversal, as shown in Figure 8, would have held:
FIGURE 7. The Überlingen mid-air collision occurred after the Russian pilot decided to heed the air traffic control instruction to descend rather than the TCAS advisory to climb.
Actu al tra
jectory
TCAS trajec
tory
“Climb, climb” Russian Tu-154
“Descend, descend” DHL B-757 ATC instruction
the DHL aircraft would have had priority; the DHL aircraft’s descend RA would have shown that a collision was still predicted; and the projection of a reversal-climb RA would have predicted adequate separation. How-ever, both aircraft remained within 100 ft vertically of each other throughout the encounter, and so this fourth criterion for permitting a reversal still would not have been met.
To reduce the risk of this type of collision, research-ers funded by the European Organization for the Safe-ty of Air Navigation, or Eurocontrol, have proposed a change to the TCAS threat logic. Eurocontrol’s proposal aims to improve reversal performance in encounters in which both aircraft become involved in a so-called vertical chase, as occurred at Überlingen. The proposal includes two major components. First, when using
ma-neuver templates, TCAS would no longer assume that the TCAS aircraft would follow its RA. Instead, TCAS would check the recent vertical motion of the aircraft; if this motion is not compatible with the RA that had been issued, then TCAS would revert to models using the aircraft’s current vertical rate instead of its predicted mo-tion in response to the RA. Second, the proposal would eliminate the 100 ft separation requirement, allowing TCAS to reverse sense in vertical-chase situations. The combination of these changes would have produced RA reversals in the Überlingen accident—no matter which aircraft had priority. Starting in 2004, the FAA funded Lincoln Laboratory to answer two fundamental ques-tions: how often do RA reversal problems occur in U.S. airspace, and how effective would the European change proposal be?
FIGURE 8. In order for TCAS to reverse its maneuver instruction—e.g., from “descend” to “climb”—four con-ditions must hold. (1) The reversal can be triggered only by the aircraft with priority. (2) The maneuver template must predict that insufficient separation between aircraft will occur if the present RA is followed. (3) A maneu-ver template must predict that a remaneu-versed RA will result in adequate separation between aircraft. (4) The two air-craft in danger of colliding must be separated by at least 100 ft vertically.
4. Must currently be
separated by >100 ft 3. Reversed RA
is adequate
1. Has priority
2. Current RA is not adequate
“Descend, descend”
Russian Tu-154 TCAS trajectory
“Climb, climb”
Russian aircraft DHL aircraft
“Descend, descend” DHL B-757
“Descend, descend now” “Climb, climb now”
TcaS monitoring
Following the Überlingen accident, researchers set about monitoring the European airspace to estimate how common this type of situation was. A total of ten events, including the Überlingen accident, were posi-tively identified in which one aircraft flew opposite to its RA, a reversal did not occur, and either a collision or near miss occurred. Eurocontrol estimated on the ba-sis of the number of flight hours examined that these types of situations occur more than fifty times per year in European skies, and that a mid-air collision in Eu-rope due to this problem might be expected once every four years.
In recent years, several countries—the United States, Britain, France, Germany, and Japan—have been moni-toring TCAS to find out if the system’s advisories are appropriate and to understand the impact that these TCAS advisories have on airspace operation. All U.S. monitoring/analysis has been performed at Lincoln Laboratory, using an FAA production Mode S sensor located in Lexington, Massachusetts. Following the Überlingen accident, the FAA tasked Lincoln Labora-tory to begin monitoring for occurrences of the type of situation described above. To accomplish this, we pass sensor data through a series of software tools (Figure 10) to examine the details of TCAS events occurring in the Boston area airspace.
Procedures for transmitting TCAS RA information to Mode S ground sensors are a part of the basic Mode S and TCAS designs. Whenever TCAS issues an RA to an aircraft within the coverage area of a Mode S sensor, the aircraft’s transponder automatically informs this ground sensor that information is available for read-out. On each radar sweep over the duration of the RA, the sensor requests the aircraft’s RA Report. This report contains the Mode S address of the TCAS aircraft, the type of RA, and (for TCAS Version 7) an identification of the intruder triggering the RA.
Correlation of RA Reports with the TCAS aircraft surveillance data is performed via the aircraft’s unique Mode S address, which is present in both the RA reports and the aircraft surveillance data, as well as via time stamps, which are applied by the sensor and show the time of receipt for all communication and surveillance data. All data—communication and surveillance—are recorded for later playback and analysis.
As shown in Figure 10, Lincoln Laboratory per-forms four types of processing: statistics; pilot response (compliance with RAs); filtering for specific events; and playback. We discuss the first three types in the follow-ing sections. The fourth, the playback feature, allows detailed review of the TCAS logic performance. The 5 sec radar surveillance position reports are converted to 1 sec inputs for TCAS. The data can then be played through one of several different versions of the TCAS
FIGURE 10. A Lincoln Laboratory facility monitors TCAS operations in the United States to find out if the system’s advisories are appropriate and to understand the impact that these TCAS advisories have on airspace operation.
Statistics
e.g., RA number, type location, version
Playback Analysis
Playback radar data through selected TCAS
logic version 6.04A, 7, CP112E
Pilot response Filtering
Filter for close encounters,
reversals
Encounter plots
Opposite Proper
Partial Data
recording computer
RA reports
Mode S sensor
Comm data
logic, allowing comparison of the performance of dif-ferent TCAS versions, or examination of the effect of a proposed logic change. The playback can be stepped through the encounter in 1 sec increments and allows viewing of key TCAS logic parameters at each step.
Figure 11 shows the location of RAs as recorded by the Lincoln Laboratory monitoring program from June 2005 through January 2006. Over this time period, monitoring took place for approximately 190 days, and roughly 200,000 Mode S flight hours were observed within the sensor’s 60-nautical-mile coverage area. We observed a total of 1725 RA events, corresponding to an average of 9 RAs per day, or about one RA every 116 flight hours.
This RA rate is typically an order of magnitude larger than that in European terminal airspace. The higher RA rate in Boston is thought to be due, at least in part, to U.S. air traffic control use of visual-separation pro-cedures when visual meteorological conditions (VMC) prevail, increasing the number of encounters in which aircraft pass each other safely even though they are with-in TCAS RA thresholds. In particular, Figure 11 shows a number of RAs along the parallel approaches to runways 4L and 4R at Boston’s Logan Airport. In VMC, aircraft may be vectored onto final
ap-proaches to these two runways as the pilots accept responsibility of maintaining safe separation from the parallel traffic. In some cases, TCAS may still alert because of the close proximity of aircraft. Many of the RAs elsewhere in the airspace are due to the large density of small general-avia-tion aircraft in the United States that may operate more closely to other air traffic in VMC than is typical in Europe.
When air traffic control al-lows use of visual-separation procedures, pilots may ignore an RA, or move contrary to the RA, because the intruder aircraft is in sight. Pilot non-compliance to an RA may not necessarily com-promise safety in a particular en-counter. It can, however, lead to a degrading situation in which a
FIGURE 11. The location of RA events as recorded by the Lincoln Laboratory monitor-ing program for the time period June 2005 through January 2006. Over this time peri-od, monitoring took place for approximately 190 days, and roughly 200,000 Mode S flight hours were observed within the sensor’s 60 nmi coverage area. We observed a total of 1725 RA events, corresponding to an average of 9 RAs per day, or approximately one RA every 116 flight hours.
reversal will not occur when necessary, such as at Über-lingen. Examination of pilot response is therefore a key component of the Lincoln Laboratory monitoring.
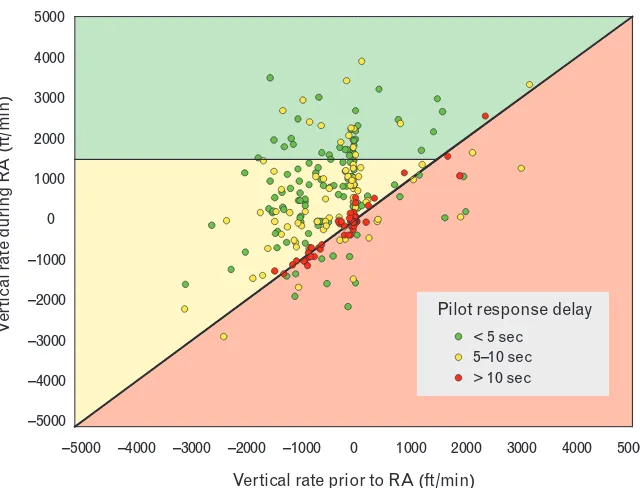
As an example, Figure 12 shows pilot response to climb RAs during the eight-month period from June 2005 through January 2006. For a climb RA, TCAS ex-pects the pilot to begin to maneuver within 5 sec and to achieve a 1500 ft/min vertical rate. If the aircraft is already climbing faster than 1500 ft/min, the RA is instead “maintain climb,” and the pilot is expected to continue at the current rate. The delay in pilot response was estimated as the time required for the vertical rate to change by at least 400 ft/min.
be reasonable in certain cases, the fact remains that ma-neuvering opposite to the TCAS RA invites exactly the kind of vertical chase that happened at Überlingen. The European change proposal would provide an additional safety net should such a vertical chase occur and aircraft continue to move on a collision course.
detecting reversal Problems
A key part of Lincoln Laboratory monitoring efforts since mid-2004 has been to find instances of RA rever-sal problems in the Boston airspace. Automated tools extract encounters in which a TCAS RA occurs and sep-aration between aircraft is small. These encounters are then examined to find those in which the two aircraft moved in the same vertical direction after the start of the RA event.
The Lincoln Laboratory monitoring program detect-ed two RA reversal problem events. Figure 13 diagrams one of these encounters, in which a TCAS-equipped air-craft came within 0.3 nmi horizontally and 100 ft ver-tically of another aircraft that did not have TCAS. As the aircraft neared each other, TCAS issued a descend RA, which the pilot followed. At about the same time,
however, the non-TCAS aircraft also began a descent, presumably on the basis of visual identification of the TCAS aircraft and an attempt to avoid a collision. TCAS then issued an “increase descent” RA, which the pilot again followed. At the same time, the non-TCAS aircraft also increased its descent rate. TCAS maintained the descend sense even after the non-TCAS aircraft had dropped below the TCAS aircraft. TCAS did eventually issue a reversal, instructing the aircraft to climb. How-ever, this reversal occurred essentially as the two aircraft passed each other and was too late to be of benefit. This encounter, which took place in April 2005, is of the same general type as that in the Überlingen accident in that an RA reversal should have been issued earlier. The findings of the Lincoln monitoring program indicate that RA reversal problems occur in U.S. airspace at a rate comparable to that in Europe.
assessing Safety
Safety analysis of TCAS is based in part on a compre-hensive, statistically valid set of data describing TCAS performance across a wide range of encounter situations. Specific problem situations also need to be identified
FIGURE 12. Pilot compliance with climb RAs. Each circle corresponds to one RA event for a TCAS aircraft. The green-shaded region indicates responses that achieved the intended vertical rate; the yellow segment indicates responses that were in the correct direction but did not achieve the intended vertical rate; the red shading indicates responses that were in the wrong direction.
–5000 –4000 –3000 –2000 –1000 0 1000 2000 3000 4000 5000
Vertical rate prior to RA (ft/min) –5000
–4000 –3000 –2000 –1000 1000 2000 3000 4000 5000
0
V
er
tic
al
r
at
e
du
ri
ng
R
A
(f
t/
m
in
)
and judged as to their criticality and likelihood. Exten-sive flight testing is required to support modeling sen-sor performance, automation, human interaction with TCAS advisories, and flight characteristics. However, flight tests alone cannot provide enough data to make a complete system assessment. Thus a combination of modeling based on flight experience and fast-time simu-lation of many encounters is needed.
A key performance metric is the reduction in colli-sion risk achieved by equipping with TCAS. This risk is expressed in terms of Near Mid-Air Collision (NMAC) events, defined to occur when separation between two aircraft is less than 100 ft vertically and 500 ft hori-zontally. The probability of Near Mid-Air Collision is
P(NMAC). The ratio of P(NMAC) when TCAS is used
to P(NMAC) without TCAS is commonly referred to as the risk ratio. Changes in TCAS algorithms, such as those included in the European change proposal, can be evaluated by examining their effect on risk ratio.
Assessment of safety requires more than simply the application of a single analytical model. Several tools must be brought to bear, each focusing on a different as-pect of the overall system. In particular, the collision risk problem can be partitioned into two regimes: an outer loop that encompasses system failures and events that lead up to a critical close-encounter event, and an inner
loop that covers the second-by-second details of an en-counter in a dynamic analysis, given the conditions that were defined in the outer-loop regime (Figure 14).
A fault tree is typically used to model the outer-loop system failures or events that in turn define the envi-ronment for a fast-time inner-loop simulation of a close encounter. For example, the probability that a transpon-der will fail to provide altitude information can be es-timated in the fault tree, and P(NMAC) for that type of encounter can be computed in a detailed fast-time simulation. Results are then combined in the fault tree with corresponding performance data and probabilities for other conditions, leading to a global estimate of sys-tem safety. Researchers can perform sensitivity studies by modifying event probabilities in the fault tree and observe their impact on overall risk, without requiring new fast-time simulations.
The outer-loop regime defines what conditions apply to the set of close encounters that are dynamically simu-lated in the inner loop. Outer-loop conditions include airspace environment (e.g., low altitude, high altitude, U.S. airspace, European airspace); encounter charac-teristics (e.g., speeds, geometry of encounter), intruder aircraft equipage (e.g., transponder-equipped, TCAS-equipped); system component failures; pilot response to TCAS RAs (e.g., failure to respond, normal response);
FIGURE 13. In this encounter, a TCAS-equipped aircraft came within 0.3 nmi horizontally and 100 ft vertically of another aircraft that did not have TCAS. The RA reversal came too late.
Descend RA
D D
D
C C
C C
Reversal: climb RA
2000 2100 2200
A
lti
tu
de
(f
t) 2300
2400 2500
–20 –15 –10 –5 0 5 10 15 20
Descend RA Climb RA
Time from closest point of approach (sec)
25 Intruder (without TCAS)
environmental conditions; and finally, ATC involvement in resolving the close encounter.
The outer-loop modeling requires a valid model of the types of close encounters that may occur. This so-called encounter model specifies a number of variables that are selected randomly in every fast-time simula-tion run. Key variables include the geometry of the encounter, aircraft speeds, and vertical accelerations. The encounter modeling process begins by collecting thousands of hours of air traffic radar data and using a set of filters to extract from these data any close encounters between aircraft. The characteristics of each close encoun-ter are then compiled into a statistical distribution describing the likelihoods
that various conditions are present. When generating encounter scenarios, separate software randomly selects parameter values from these distributions, computes the initial conditions for the simulation, and stores the re-sults in an input file.
The inner-loop dynamic simulation takes the status of system components and the environment and com-putes P (NMAC) over a representative range of encoun-ter situations. Each encounencoun-ter scenario is executed once without TCAS and once with TCAS. Additional runs may be performed to compare the performance of dif-ferent TCAS algorithms. These runs, using identical ini-tial conditions, facilitate making direct estimates of the safety provided by TCAS.
Lincoln Laboratory’s Safety assessment Tool
Lincoln Laboratory recently designed and implemented (using The MathWorks MATLAB, Simulink, and Real Time Workshop software packages) a fast-time Monte Carlo simulation capability called the Collision Avoid-ance System Safety Assessment Tool. This system takes encounter model data as an input and simulates three-dimensional aircraft motion. The simulation includes several integrated sub-models, as shown in Figure 15. These sub-models include TCAS logic, a visual-acquisi-tion model, a pilot-response model, and a vehicle dy-namics model. A sensor noise model is also included. A performance analysis module examines the aircraft
trajectories to determine miss distances and to compute
P (NMAC). To reduce computation time, batch
simu-lation runs are performed with Lincoln Laboratory’s LLGrid parallel computing facility [6]. LLGrid enables simulation of one million encounter situations in ap-proximately 3.5 hours, allowing enough flexibility to interactively investigate changes to TCAS or other col-lision avoidance systems.
The simulation includes flight-certified TCAS code obtained from a TCAS vendor. The logic in the simula-tion is thus identical to that in actual aircraft, provid-ing high fidelity and an ability to replicate the full range of logic behavior. Information from the TCAS logic is passed to a pilot-response model (to respond to RAs), to a visual-acquisition model (triggering improved pilot visual-search efficiency) and to the other aircraft’s TCAS unit (if equipped) to handle maneuver coordination.
A visual-acquisition model estimates the probability that a pilot will see the other aircraft through the wind-screen. This model relies on a technique developed for accident investigations, safety analyses, and regulatory processes [7]. The model’s basis is that visual acquisition is limited by target search time over a given volume of space. In the model, the probability of visually acquiring a threat during one time step is given by
λ β= A
r2 ,
Outer loop
Encounter model
System failures
Aircraft equipage
Encounter conditions
Inner-loop variations in encounter geometry
and sensor noise
Results
Outer-loop
variations in encounter conditions Pilot-response
model
Inner loop
Fast-time simulation
where b is a constant, A is the visual area presented by the target, and r is the range to the target. If the air-craft are on a collision course, r decreases with time, so the acquisition probability increases smoothly until the point of closest approach. The value of A may vary as an aircraft changes orientation. The value of b depends on visibility, contrast, the number of pilots searching, and whether those pilots have been cued by an ATC or TCAS traffic advisory. Values for b have been validated in flight experiments. The visual-acquisition model es-timates the probability of a pilot visually detecting an-other aircraft by a certain time and thus helps identify encounters that might be avoided by visual acquisition.
Aircraft motion normally follows a scripted set of maneuvers as specified by the encounter model. These maneuvers can include vertical or lateral acceleration such as a level-off or turn, plus changes in airspeed. If a TCAS RA is issued, the motion transitions to a new set of control behaviors as defined by a pilot-response model. We use different models to explore a variety of possible pilot behaviors, including pilots who respond exactly as TCAS assumes as well as pilots who respond slowly, move more aggressively than expected, maneuver in the opposite direction as the RA calls for, or make no maneuver at all.
European change—For the Better?
Between 2004 and 2006, the FAA and Eurocontrol conducted an international study to assess the perfor-mance of the European change proposal [8]. Figure 16 shows data from Lincoln Laboratory simulations, as
part of this study, that demonstrate how the European change proposal would affect the measured vertical miss distance between aircraft in encounters similar to Über-lingen—that is, when both aircraft are equipped with TCAS but when one aircraft does not follow its RA.
Clearly, the European proposal would in a vast ma-jority of cases affected by the proposal—92%—result in an increase in vertical separation. A full 22% of the af-fected cases are considered saves; that is, a near mid-air collision would have occurred with the current version of TCAS but would not occur if the proposed change were to be implemented. In only 2% of the affected cases would the situation be reversed, with the proposed change resulting in a near miss, while the current TCAS would not.
Lincoln Laboratory simulations were also run with an encounter model representing European airspace. In encounters involving two TCAS-equipped aircraft in which both pilots respond appropriately to their RAs, TCAS provides a risk ratio of approximately 0.02. That is, if pilots obey the RA, the use of TCAS reduces the risk of mid-air collision by about a factor of 50. If in-stead one pilot does not respond to the RA, the risk ra-tio rises by an order of magnitude, to 0.23.
Figure 17 summarizes the overall impact of TCAS according to the estimated number of years between mid-air collisions over Europe. These estimates, which were based on the Lincoln Laboratory simulation stud-ies, consider two factors: the likelihood with which pi-lots follow their RAs, and the type of TCAS logic be-ing used. With no TCAS at all, one mid-air collision
Radar data
Pilot-response
model Pilot-response
model
Simulation
Airspace encounter model
Filter
Random samples Encounter
model distributions
Metrics
Vertical separation
Risk with TCAS Risk without TCAS
Years between collisions TCAS
TCAS
Aircraft dynamic model
Aircraft dynamic model
could be expected over Europe approximately every three years. With deployment of TCAS Version 7 (blue curve), the years between collisions depend heavily on how often crews conform to RAs. Safety increases sharply as more pilots follow their RAs. Introducing the European change proposal should improve safety even further (green curve). Clearly, aviation safety can be best enhanced through a combination of measures: upgrad-ing the TCAS algorithms while also improvupgrad-ing pilot trainin