March, 2017 Int J Agric & Biol Eng Open Access at https://www.ijabe.org Vol. 10 No.2 151
Optimization of water use structure and plantation benefit of unit
water consumption
using fractional programming and conditional
value-at-risk model
Fu Qiang
1,2,3*, Xiao Yuanyuan
1,2,3, Cui Song
1,2,3, Liu Dong
1,2,3, Li Tianxiao
1,2,3(1. School of Water Conservancy and Civil Engineering, Northeast Agricultural University, Harbin 150030, China; 2. Key Laboratory of Water-Saving Agriculture of Universities in Heilongjiang Province, Northeast Agricultural University, Harbin 150030, China; 3. Key Laboratory of High Efficient Utilization of Agricultural Water Resource of Ministry of Agriculture,
Northeast Agricultural University, Harbin 150030, China)
Abstract: For optimizing the water-use structure and increasing plantation benefit of unit water consumption, a multi-objective model for water resources utilization was established based on fractional programming (FP). Meanwhile, considering the stochasticity of water availability in the study area, the impact of the risk factor (λ) from a quantitative and qualitative perspective was analyzed. The chance-constrained programming (CCP) and conditional value-at-risk (CVaR) models were introduced into five important major grain production areas in Sanjiang Plain, and the crop planting structure under this condition was optimized. The results showed that, after optimization, overall benefit of cultivation increased from 42.07 billion Yuan to 42.47 billion Yuan, water consumption decreased from 15.90 billion m3 to 11.95 billion m3, the plantation benefit of unit water consumption increased from 2.65 Yuan/m3 to 3.55 Yuan/m3. Furthermore, the index of water
consumption, benefit of cultivation and plantation benefit of unit water consumption showed an increasing trend with the increase of violation likelihood. However, through the quantification of λ from an economic perspective, the increasing of λ
could not enhance plantation benefit of unit water consumption significantly.
Keywords: agricultural water-use structure, plantation benefit of unit water consumption, the Sanjiang Plain, fractional programming (FP), chance-constrained programming (CCP), conditional value-at-risk (CVaR)
DOI: 10.3965/j.ijabe.20171002.2961
Citation: Fu Q, Xiao Y Y, Cui S, Liu D, Li T X. Optimization of water use structure and plantation benefit of unit water consumption using fractional programming and conditional value-at-risk model. Int J Agric & Biol Eng, 2017; 10(2): 151–161.
1 Introduction
Water is the origin of life, the key for production and the foundation of ecology. However, with industrial and agricultural development, the human population and the amount of water consumed have increased dramatically.
Received date: 2016-11-03 Accepted date: 2017-03-08
Biographies: Xiao Yuanyuan,Graduate student, research interests: optimization and utilization of agricultural water and soil resources and system analysis, Email: [email protected];
Cui Song,Associate Professor, research interests: optimization and utilization of agricultural water and soil resources and system analysis, Email: [email protected]; Liu Dong, Professor, research interests: optimization and utilization of agricultural water and soil resources and system analysis, Email: liudong5511@sina.
Limited water resources can no longer meet people’s
increasing needs for water. In addition, methods for
water resource development in recent years have caused many ecological and environmental problems, which further exacerbate the problem of water resource scarcity, thereby severely limiting sustainable social, economic and ecological development. Furthermore, China is a
com; Li Tianxiao, Graduate student, research interests: optimization and utilization of agricultural water and soil resources and system analysis, Email: [email protected].
large agricultural country, and approximately 370 billion
m3 of water is used for agriculture, accounting for
approximately 62% of the total amount of water consumed in China. Therefore, optimizing the agricultural water-use structure and increasing plantation benefit of unit water consumption are important preconditions for achieving sustainable social development.
Whether water resources can be sustainably used directly restricts sustainable agricultural development. However, sustainable use of agricultural water resources will also affect the sustainable development of water resources, which in turn will have an impact on the sustainable development of the entire society. As the conflict between the supply and demand for water resources is becoming prominent, optimal allocation of water resources has been extensively investigated, and a number of methods for optimally allocating water
resources have emerged. Lu et al.[1] established a
rough-interval fuzzy linear programming model for
agricultural irrigation systems. Prasad et al.[2]
established a linear planning model for the optimal allocation of water resources and used this model to optimize the allocation of water at different crop growth
stages under different inflow conditions. Huang et al.[3]
established a model that couples two-stage stochastic programming with inexact quadratic programming and used this hybrid optimization model to predict the available amount of water that could be used for irrigation in the irrigated area in the Tarim River Basin in
China. Xie et al.[4] optimized the water resources in the
Nansihu Lake Basin in China using an inexact two-stage
stochastic programming model. Guo et al.[5] developed
an inexact fuzzy chance-constrained nonlinear programming (IFCCNP) model for agricultural water resources management under multiple uncertainties and demonstrated that the IFCCNP model was more suitable for addressing water resources allocation problems under uncertain conditions such as different precipitation and sustainable development conditions. Manoj and
Mathew[6] improved water use efficiency by integrating
fish culture and irrigation in coconut based farming system in Kasaragod District of Kerala (India). Cheng
et al.[7] established a complex adaptive allocation model
for regional water and land resources based on the complex adaptive systems (CAS) theory and used this model to effectively mitigate the conflict between the supply of and demand for regional water resources while improving the ecological benefits. In addition, Cheng et
al.[8] used the agent-based modeling method of the CAS
theory to dynamically simulate four plans for using water resources and predicted the per capita food share, per capita income and water security rate in Heilongjiang Province, China, in 2020 under three climatic conditions.
Fu et al.[9] optimized the allocation of an adaptive water
resources management system using an interval two-stage stochastic programming model and overcame the uncertainties in the water resources system through the use of interval parameters and probability distribution.
Yang et al.[10] developed an improved single-step method
(SSM) based on the two-step method to solve the interval-parameter linear programming model and demonstrated that the SSM could more effectively solve irrigation water allocation optimization problems while taking into account the effect of the risk preference
degree. Mirfenderesgi and Mousavi[11] developed a
hybrid model by combining a particle swarm optimization algorithm with a river basin decision support system and used the hybrid model to optimize the basin-scale allocation of water resources. In addition, to achieve sustainable development, numerous researchers have started studying multi-objective programming
models. Hu et al.[12] established a multi-objective
programming model with economic benefits and water rights as the objective functions and used this model to balance the economic benefits and equity in water use in
the Qujiang River Basin in China. Fu et al.[13] applied a
cloud model to a water resource system using five sustainable water resource utilization schemes for Jiamusi,
Heilongjiang Province, as an example. Li et al.[14]
developed an interval linear fractional programming (FP) irrigation water allocation optimization model, and this model could quantitatively solve multi-objective
problems. Ahmad and Tang[15] created a multi-objective
linear programming water allocation model and introduced a compromise constraint technique and a weighting technique to optimize the allocation of water
March, 2017 Fu Q, et al. Optimization of water use structure and plantation benefit using fractional programming Vol. 10 No.2 153
and economic benefit. Most of the aforementioned studies only focused on the increase in the net benefit of regional water resources and neglect the increase in the net efficiency of water resources and often determined the weight based on subjective factors when handling multiple objectives. In addition, most of the aforementioned studies only sought to maximize the objective functions and neglected the water-use risk. While the FP method can effectively process uncertain information, the conventional FP method uses the expected value as the output objective, neglecting the impact of the stochastic characteristics on the output results of the model and giving no consideration to the risk resulting from the stochasticity of the data. Therefore, the conventional FP method is a risk-neutral method, although the problem of risk is the greatest concern for managers or investors.
To address the aforementioned problems, the present study selects the amount of water used for agricultural purposes and the benefit of cultivation as the objective functions and manages the coordination between these two objectives using FP, thereby avoiding the situation that occurs when using past models to solve optimization problems, in which subjective factors interfere with multiple objectives. In addition, considering the stochasticity of the amount of water that can be supplied, this study also introduces stochastic chance-constrained programming (CCP) and analyzes the optimized results of the agricultural water-use structure at different levels of the violation likelihood. Furthermore, this study also introduces a conditional value-at-risk (CVaR) model into the FP model and quantitatively analyzes the impact of
the risk factor (λ) on the objective functions based on the
economics theory. Using the CVaR model coupled with FP, managers can not only obtain the optimal scheme but can also adjust the model by selecting a risk aversion level to obtain the optimal scheme.
2 Model development for optimizing
agricultural water-use structure
2.1 FP model for optimizing agricultural water-use structure
Linear fractional programming (FP) can effectively
reflect the efficiency of a system and is advantageous in solving multi-objective programming problems, particularly agricultural water-use structure optimization problems. Therefore, this study develops an agricultural water-use structure adjustment and optimization model based on FP. This model can be calculated to obtain the minimum amount of water used, the maximum benefit of cultivation and the maximum plantation benefit of unit water consumption under the constraints of limited water resources and conditions that ensure local grain yields. The model is shown in detail as follows:
0 0
max max
max
= =
′
F F
F
1 1 1 1
1 1 1
[ ( ) ( )]
[ ( ) ( )]
= = = =
= = =
+ −
+
∑ ∑ ∑
∑
∑ ∑ ∑
I J H I
h ijh ijh ijh ijh i
i j h i
I J H
h ijh ijh
i j h
p C Y X SW X GW W
p X SW X GW
(1)
where, F represents the objective function, Yuan/m3; F0
represents the target benefit of cultivation, 100 million
Yuan; F′0 represents the target amount of water used, 100
million m3; ph represents the probability of the occurrence
of the inflow level (h=1, 2, 3,..., H,), 3
1
1
=
=
∑
hh
p ; i
represents a certain region (i=1, 2,..., I); j represents the
crop type (j=1, 2,..., J); Yij represents the unit price of the
jth crop in the ith region, Yuan/kg; Cij represents the water
productivity of the jth crop in the ith region, kg/m3; Xij(SW)
represents the intermediate consumption in the ith region,
100 million Yuan; Xij (gW) represent the amount of
surface water and groundwater that can be used for the jth
crop in the ith region, respectively, 100 million m3.
When using a mathematical model to solve a practical problem, the parameters at the right-hand side of the constraint are oftentimes unpredictable. For example, the amount of water that can be used in a study area is stochastic and can be represented by a probability distribution. However, in many models, a fixed parameter is used to represent the amount of water that can be used to simplify the calculation process, which, to a certain degree, reduces the accuracy of the decision-making process. CCP is an effective method
for solving the aforementioned problem[16,17].
can be used, the present study introduces stochastic CCP,
in which pm is set to 0, 0.01, 0.05, 0.10, 0.15 and 0.20,
respectively. pm=0 is the extreme case of CCP, the left-
and right-hand sides of the constraint completely meet the requirements of the sign of inequality. The constraint conditions are reflected as follows:
1) Constraint of the amount of water supplied by the water sources:
1
Pr ( ) 1 , ,
= ⎧ ⎫ ≤ ≥ − ∀ ⎨ ⎬ ⎩
∑
⎭ Jijh ih m
j
X SW SW p i h (2)
1
Pr ( ) 1 , ,
= ⎧ ⎫ ≤ ≥ − ∀ ⎨ ⎬ ⎩
∑
⎭ Jijh ih m
j
X GW GW p i h (3)
( )+ ( )≤ , ,∀
ij ij ij
X SW X GW W i j (4)
where, m=1, 2, 3,..., k (k represents the number of
constraints); pm (pm∈[0,1]) represents the preset level of
probability of the mth constraint; and SWih, GWih represent
the total amount of surface water and groundwater that
can be used in the ith region at the inflow level of h
respectively, 100 million m3; W
ij represents the amount of
water needed for the jth crop in the ith region, 100 million
m3.
2) Constraint of the minimum amount of water needed:
min
( )+ ( )≤ , ,∀
ij ij ij
X SW X GW W i j (5)
3) Non-negative variable constraint:
( ) 0, ,≥ ∀
ij
X SW i j (6)
( ) 0, ,≥ ∀
ij
X GW i j (7)
where, Wijmin represents the minimum amount of water
needed for the cultivation of the jth crop in the ith region,
100 million m3. In the model, the amount of surface
water that can be supplied and the amount of groundwater that can be supplied are treated as stochastic variables.
The surface water-use coefficient (η1) and the
groundwater-use coefficient (η2) are 0.50 and 0.65,
respectively.
2.2 FP model for agricultural water-use structure adjustment that considers the CVaR
The aforementioned FP model neglects the value-at-risk (VaR). Therefore, the CVaR model is
introduced to quantitatively identify the effect of λ on the
agricultural water-use structure adjustment. The CVaR model is commonly used in financial risk management. Currently, the CVaR model is gradually being popularized in relevant fields, such as environmental science. The CVaR model was proposed based on the VaR model. The VaR model calculates the loss of the worst-case scenario that is expected to occur within the given planning period under normal conditions at a certain confidence level. Because the VaR model lacks subadditivity, the CVaR model with subadditivity is selected to evaluate the VaR of the system. The CVaR model represents the expected value of the portion of the loss that surpasses the loss determined using the VaR model. To facilitate the calculation process, the CVaR
of a stochastic variable at a given confidence level α
(α∈(0,1)) is defined as follows:
1
inf ( )
1 ρ η α ± ⎧ ⎫ = ⎨ + − ⎬
⎩ E PVh h ⎭ (8)
where, η represents the maximum loss of the system at
the given confidence level; ph represents the probability
of occurrence at different levels of h; ±
h
V represents the
auxiliary variables at different levels of h[18,19].
In addition, to investigate the response relationship between the optimal solution of the model and each
parameter, α is often set to 0.90, 0.95 or 0.99 based on the
risk measurement model proposed by Xu and Yu[20].
Based on the actual conditions of the study area, α is set
to 0.95 in the present study. Furthermore, λ[λ∈(0,1)] is
the risk factor that balances the benefit of cultivation and
the risks. Different values of λ can be used as a series of
risk scenarios of analysis. When λ=0, the maximum
benefit of cultivation is generated by the water resources
when the VaR is ignored. As λ increases, the maximum
benefit of cultivation and the amount of water used calculated using the model also change accordingly.
When λ=1, the water allocation target is close to a
relatively large value. Based on the aforementioned analysis, the final expression of the model is obtained as follows:
1 1 1 1
0 0
1 1 1
1
[ ( ) ( )] [ ( ]
max 1
max
min [ ( ) ( )]
λ η α + = = = = = = = + − − + − = = ′ +
∑ ∑ ∑
∑
∑ ∑ ∑
I J H I
h ijh ijh ijh ijh i h h
i j h i
I J H
h ijh ijh
i j h
p C Y X SW X GW W E PV
F F
March, 2017 Int J Agric & Biol Eng Open Access at https://www.ijabe.org Vol. 10 No.2 155
3 Case study
3.1 General information of the study area
Situated in eastern Heilongjiang Province in China
(45˚01'-48˚27'56"N, 130˚13'-135˚05'26"E), the Sanjiang
Plain is an alluvial plain formed by the merging and scouring of three large rivers: the Heilongjiang River, the Ussuri River and the Songhua River. The largest marshland area in China is distributed in the Sanjiang Plain. The Sanjiang Plain has a total land area of 108.90
thousand km2, 53% of which is farmland. The Sanjiang
Plain is the largest food grain production base in China and can consistently provide no less than 20% of commodity grains to China each year and is the key region for achieving the objectives of the “Project of Consolidating and Improving the Hundred Billion-kg Food Grain Production Capacity” of Heilongjiang Province and the targets stipulated in the National Plan for Increasing the Food Grain Production Capacity by 100 Billion kg (2010-2020) for ensuring food security in China. Groundwater is the main source of water used for agricultural purposes in the Sanjiang Plain. More than 90% of groundwater in the Sanjiang Plain is exploited, whereas only approximately 20% of surface water is exploited and used, resulting in a relatively severe imbalance between the use of surface water and groundwater in the Sanjiang Plain.
At the same time, due to low use efficiency of surface water, and unbalanced distribution of surface water, resulting in more serious problem of water shortage in many areas. The present study selects Jiamusi, Jixi, Qitaihe, Hegang and Shuangyashan as study areas based on the acquired data and analyzes and optimizes the
agricultural water-use structure in the Sanjiang Plain. The study area and water systems are shown in Figure 1.
Figure 1 Study area and water system diagram
3.2 Model parameter calibration
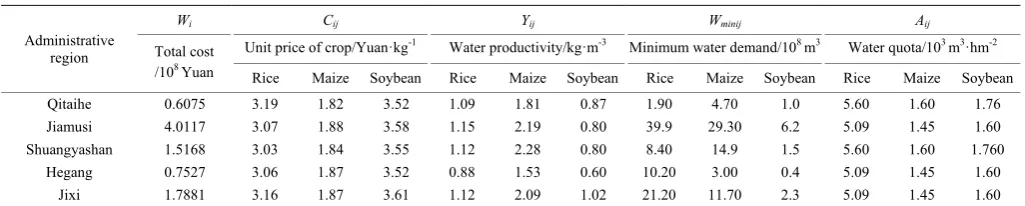
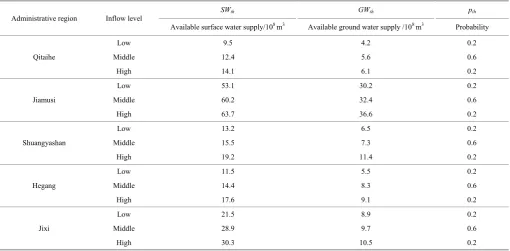
A frequency analysis based on historical precipitation and runoff statistical data in each administrative region in the Sanjiang Plain shows that the probability of the occurrence of medium flows is higher than that of the occurrence of high and low flows; in addition, the probability of the occurrence of high flows is essentially the same as that of the occurrence of low flows, each of which generally follow a normal distribution. Therefore, this study assumes that the probability of the occurrence of high, medium, and low inflow levels in the prediction year is 0.20, 0.60 and 0.20, respectively. In addition, because the wheat acreage in the Sanjiang Plain is less than 10% of the total acreage, the amount of water used for the cultivation of wheat is ignored. Table 1 lists the relevant data for the major crops in the study area in 2014. Table 2 lists the allowable amount of water that can be used in each administrative region at different inflow levels in the prediction year.
Table 1 Basic data on the planting structure in the study area in Sanjiang Plain in 2014
Administrative region
Wi Cij Yij Wminij Aij
Total cost /108 Yuan
Unit price of crop/Yuan·kg-1 Water productivity/kg·m-3 Minimum water demand/108 m3 Water quota/103 m3·hm-2
Rice Maize Soybean Rice Maize Soybean Rice Maize Soybean Rice Maize Soybean Qitaihe 0.6075 3.19 1.82 3.52 1.09 1.81 0.87 1.90 4.70 1.0 5.60 1.60 1.76 Jiamusi 4.0117 3.07 1.88 3.58 1.15 2.19 0.80 39.9 29.30 6.2 5.09 1.45 1.60 Shuangyashan 1.5168 3.03 1.84 3.55 1.12 2.28 0.80 8.40 14.9 1.5 5.60 1.60 1.760
Hegang 0.7527 3.06 1.87 3.52 0.88 1.53 0.60 10.20 3.00 0.4 5.09 1.45 1.60 Jixi 1.7881 3.16 1.87 3.61 1.12 2.09 1.02 21.20 11.70 2.3 5.09 1.45 1.60 Note: Cij is the unit price of the jth crop in the ith area, Yuan/kg, the data are from the Heilongjiang Provincial Government procurement network in 2014 statistical data;
Yij is the water productivity of the jth crop in the ith area, kg/m3, the data is comes from the 2014 Water Resources Bulletin. Wminijis the minimum water requirement for
the jth crop in the ith area, which is derived from the 2014 Water Resources Bulletin. W
i is the ith region of the middle consumption, 100 million Yuan, the data is taken
from the survey data (taken nearly 5-year average). Aij is the jth crop water quota in the ith area, m3/hm2, which is derived from Heilongjiang Province local water use
Table 2 Prediction of water mining yield in the studied administrative regions under different inflow levels
Administrative region Inflow level
SWih GWih pih
Available surface water supply/108 m3 Available ground water supply /108 m3 Probability
Qitaihe
Low 9.5 4.2 0.2
Middle 12.4 5.6 0.6
High 14.1 6.1 0.2
Jiamusi
Low 53.1 30.2 0.2
Middle 60.2 32.4 0.6
High 63.7 36.6 0.2
Shuangyashan
Low 13.2 6.5 0.2
Middle 15.5 7.3 0.6
High 19.2 11.4 0.2
Hegang
Low 11.5 5.5 0.2
Middle 14.4 8.3 0.6
High 17.6 9.1 0.2
Jixi
Low 21.5 8.9 0.2
Middle 28.9 9.7 0.6
High 30.3 10.5 0.2
4 Results and discussion
A program is written using LINGO 11 to solve the agricultural water-use structure optimization model established in this study based on FP and CVaR. The optimization results are analyzed from the perspective of agricultural water-use structure, CCP and CVaR.
4.1 Analysis of agricultural water-use structure 4.1.1 Analysis of the amount of water used for agricultural purposes
Here, the scenario in which p=0 and λ=0 is used as an
example. Table 3 lists the results of the optimization of the water supply structure for agricultural purposes in each region. As shown in Table 3, because the benefit of crops generated of unit water consumption in Qitaihe and Hegang is relatively low (Table 1), the model chooses to only meet the minimum amount of water
needed (0.76 billion m3 of water for Qitaihe and 1.36
billion m3 of water for Hegang) and does not increase the
amount of water used in these two regions. In contrast, because the benefit of crops generated of unit water consumption is relatively high in Jiamusi, Shuangyashan and Jixi, the model chooses to increase the amount of water supplied at the relatively high inflow level to meet the increase in the amount of water needed for the cultivation of crops. Therefore, in balancing the comprehensive benefit of cultivation and the plantation
benefit of unit water consumption, the model chooses to increase the plantation benefit of unit water consumption instead of increasing the benefit of cultivation. The proportional structure of the amount of water supplied from surface water and groundwater in each region is plotted based on Table 3 (Figure 2). As shown in Figure 2, the percentage of the amount of surface water and groundwater used for agricultural purposes in the prediction year is 66.90% and 33.10%, respectively, at the low inflow level, 65.50% and 34.50%, respectively, at the medium inflow level, and 60.80% and 39.20%, respectively, at the high inflow level. There is a severe groundwater overexploitation problem in the Sanjiang Plain—as much as 90% of groundwater resources are being exploited in the Sanjiang Plain, which already poses a serious threat to sustainable development in the Sanjiang Plain. After optimization, the percentage of the annual amount of surface water used for agricultural purposes increases significantly, and the percentage of the annual amount of groundwater used for agricultural purposes decreases significantly at each inflow level. Therefore, these optimization results have certain practical significance for alleviating the groundwater
overexploitation problem. SWih, GWih are the total
amount of surface water and groundwater when the
incoming water is h in the ith area, of 100 million m3; the
March, 2017 Fu Q, et al. Optimization of water use structure and plantation benefit using fractional programming Vol. 10 No.2 157
Table 3 Results of the planting structure optimization model based on fractional programming
Administrative region
Crop strains
Surface water/108 m3 Ground water/108 m3
Low Middle High Low Middle High
Qitaihe
Rice 1.013 0.875 0.846 0.887 1.025 1.054 Maize 3.750 3.467 3.340 0.950 1.233 1.360 Soybean 0.735 0.804 0.031 0.265 0.196 0.969
Jiamusi
Rice 18.089 22.932 15.983 6.811 1.968 8.917 Maize 7.356 8.969 20.024 7.244 15.031 14.576 Soybean 0.955 0.699 0.394 1.245 1.501 1.806
Shuangyashan
Rice 4.500 4.511 3.584 1.900 1.889 2.816 Maize 8.022 10.288 14.857 3.778 4.612 7.843 Soybean 0.679 0.701 0.759 0.821 0.799 0.741
Hegang
Rice 7.011 6.515 6.305 3.189 3.685 3.895 Maize 1.768 1.726 1.385 1.232 1.274 1.615 Soybean 0.168 0.216 0.203 0.232 0.184 0.197
Jixi
Rice 10.780 8.272 8.049 2.720 5.228 5.451 Maize 2.704 7.060 7.766 1.396 1.540 2.334 Soybean 1.016 1.269 1.284 1.284 1.031 1.016
Figure 2 Optimization of water supply structures for the multi-objective model of agricultural water use based on fractional
programming
4.1.2 Analysis of the cultivation scheme
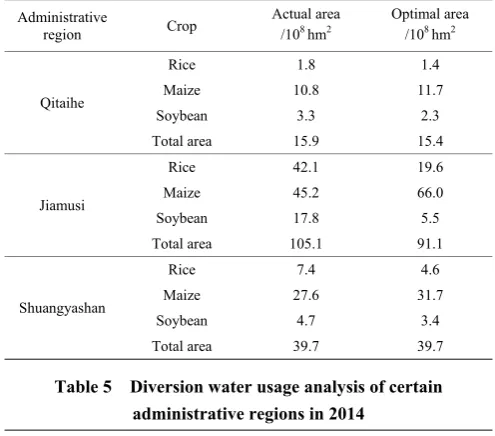
To adjust the planting structure in the Sanjiang Plain by optimizing the agricultural water-use structure, the amounts of water used listed in Table 3 are converted to crop acreages based on the water quotas listed in Table 1, and the results are compared with the actual crop acreages (Table 4). As shown in Table 4, the model adjusts the overall planting structure based on the magnitude of the benefit of different crops generated of unit water consumption in different regions. The model chooses to increase the amount of water supplied for the cultivation of maize, which has a relatively high benefit
generated per m3 of water. As a result, the maize
acreage in Qitaihe, Jiamusi, Shuangyashan, Hegang and
Jixi increases by 9000 hm2, 208 000 hm2, 41 000 hm2,
13 000 hm2 and 13 000 hm2, respectively. The model
chooses to decrease the amount of water supplied for the cultivation of rice and soybean, each of which has a relatively low benefit generated of unit water consumption. Consequently, the rice and soybean acreages decrease to varying degrees. In addition, because the actual amount of water that can be supplied from surface water and groundwater is less than the minimum amount of water needed for the cultivation of crops in Jiamusi, Shuangyashan and Jixi (Tables 1 and 2), water is transferred from external water resources to meet the water requirements for the cultivation of crops in these three regions to varying degrees during the actual cultivation process (Table 5), which significantly
increases the crop cultivation costs. Because the per m3
cost of transferring water from external water resources is higher than the benefit of cultivation of unit water
consumption[21], the model established in this study does
not consider the transfer of water from external water resources and only uses the water resources available in each region; therefore, the optimized crop acreages in Jiamusi, Shuangyashan and Jixi are slightly less than the actual crop acreages.
Table 4 Comparison of planting structure between optimal scheme and actual scheme in 2014
Administrative
region Crop
Actual area /108 hm2
Optimal area /108 hm2
Qitaihe
Rice 1.8 1.4 Maize 10.8 11.7 Soybean 3.3 2.3 Total area 15.9 15.4
Jiamusi
Rice 42.1 19.6 Maize 45.2 66.0 Soybean 17.8 5.5 Total area 105.1 91.1
Shuangyashan
Rice 7.4 4.6 Maize 27.6 31.7 Soybean 4.7 3.4 Total area 39.7 39.7
Table 5 Diversion water usage analysis of certain administrative regions in 2014
Administrative region
Water demand /108 m3
Water supply /108 m3
Diverted water /108 m3
Cost /108 Yuan
Actual benefit /108 Yuan
Jiamusi 77.14 51.10 26.04 104.14 173.08 Shuangyashan 23.47 22.80 0.67 2.34 85.01
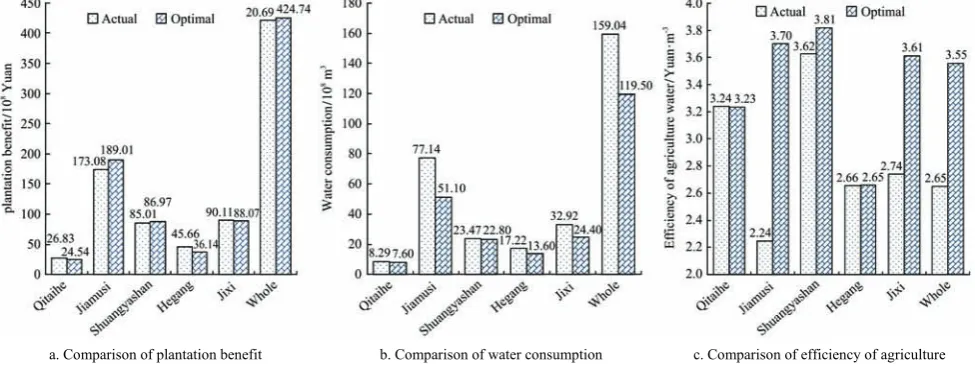
4.1.3 Analysis of the plantation benefit of unit water consumption
Under the constraint of limited water resources and the condition that ensures food security, the amount of water used for the cultivation of crops in each region is optimized and adjusted to obtain the maximum benefit of cultivation of unit water consumption used (Figure 3). As shown in Figure 3, the benefit of cultivation in Qitaihe, Hegang and Jixi decreases by 0.23, 0.95 and 0.20 billion Yuan, respectively, whereas the benefit of cultivation in Jiamusi and Shuangyashan increases by 1.59 and 0.20 billion Yuan, respectively; the overall benefit of cultivation increases by 0.41 billion Yuan compared with the actual benefit of cultivation (Figure 3a). In terms of the total amount of water used, the amounts of water used in Qitaihe, Jiamusi, Shuangyashan, Hegang and Jixi all exhibit a decreasing trend and decrease by 0.07, 2.60,
0.07, 0.36 and 0.85 billion m3, respectively; the total
amount of water used in these regions decreases by 3.95
billion m3 (Figure 3b). The plantation benefit of unit
water consumption in Qitaihe decreases by 0.01 Yuan/m3,
whereas the plantation benefit per m3 of water in Jiamusi,
Shuangyashan, Hegang and Jixi increases by 1.45, 0.19,
0.01 and 0.87 Yuan/m3, respectively; the overall benefit
increases by 0.90 Yuan/m3 (Figure 3c). In summary,
although there is a decrease in the benefit of cultivation in Qitaihe, Hegang and Jixi and a slight decrease in the plantation benefit of unit water consumption in Qitaihe, there is an increase in the overall benefit of cultivation, a decrease in the overall amount of water used and an increase in the overall plantation benefit of unit water consumption. Therefore, when selecting between local and global optimization, the model is inclined to choose global optimization.
a. Comparison of plantation benefit b. Comparison of water consumption c. Comparison of efficiency of agriculture Figure 3 Comparison between the optimization of agricultural water use structure and the actual water use structure in 2014
4.2 Analysis of CCP
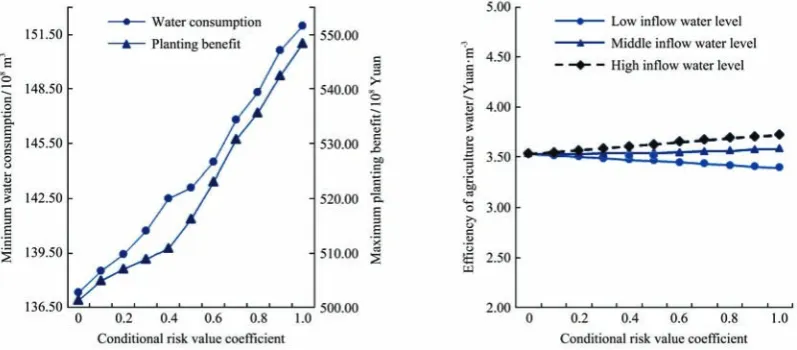
To study the effect of on the optimization results obtained from the model, CCP is introduced into the established model. The results show that the maximum benefit of cultivation, the minimum amount of water used for cultivation and the plantation benefit of unit water consumption obtained using the model change with varying levels (Figure 4). As shown in Figure 4, the overall maximum benefit of cultivation, minimum amount of water used for cultivation and plantation benefit of unit water consumption all exhibit an increasing trend with increasing and increase by 1.12 billion Yuan, 0.27 billion
m3 and 0.008 Yuan/m3, respectively. These changes
occur because the amount of water that can be used increases with increasing, and consequently, the amount
of water that can be allocated to crops increases. In addition, because the benefit of the cultivation of maize generated of unit water consumption is greater than that of the cultivation of other crops in Shuangyashan (Table 1), as increases, the model is inclined to preferentially meet the water requirements for the cultivation of maize,
which results in an increase of 0.13 billion m3 in the
March, 2017 Fu Q, et al. Optimization of water use structure and plantation benefit using fractional programming Vol. 10 No.2 159
Figure 4 Maximum plantation benefit and the minimum water consumption under different violation likelihood levels
4.3 Analysis of the CVaR
To quantitatively calculate the impact of λ on the
optimization results obtained from the model, the CVaR model is introduced. The following operation results are
shown in Figure 5. (1) At the low inflow level, as λ
increases, the overall VaR increases, and the increase in the maximum benefit of cultivation is less than the increase in the minimum amount of water used. As a result, the plantation benefit of unit water consumption
decreases from 3.53 Yuan/m3 to 3.39 Yuan/m3. (2) At
the medium inflow level, when λ<0.5, as λ increases, the
overall VaR increases, and there is no significant difference between the increase in the maximum benefit of cultivation and the increase in the minimum amount of water used; in addition, there is no significant change in the overall plantation benefit of unit water consumption.
When λ>0.5, as λ increases, the VaR of the system
increases, the increase in the maximum benefit of cultivation is greater than the increase in the minimum
amount of water used, and the overall plantation benefit
of unit water consumption only increases by 0.04 Yuan/m3.
(3) At the high inflow level, as λ increases, the overall
VaR increases, the increase in the maximum benefit of cultivation is greater than the increase in the minimum amount of water used, and the plantation benefit of unit
water consumption only increases by 0.19 Yuan/m3.
Thus, a gradual increase in λ results in an increase in the
minimum amount of water used and an increase in the maximum benefit of cultivation but does not lead to a like-for-like increase in the plantation benefit of unit water consumption, i.e., the expectation of decision-makers to increase the plantation benefit of unit water consumption cannot be achieved by increasing the amount of water
used. Therefore, based on decision-makers’ risk preference
and different inflow levels in the prediction year, decision-makers can control the benefit of cultivation and the amount of water used but cannot substantially control the plantation benefit of unit water consumption
5 Conclusions and suggestions
1) The agricultural water-use structure optimization model presented based on FP and the CVaR, which taking the benefit of cultivation as the objective in the numerator and the amount of water as the objective in the denominator of FP, thereby avoiding the subjective factors that exist in the calculation of some multi-objective models. This model can obtain the maximum benefit of cultivation and the corresponding optimal amount of water used for the cultivation of each crop under the condition of the minimum amount of water used, thereby optimizing the agricultural cultivation structure.
2) This study integrated CCP and CVaR into the established model and uses the integrated optimization model to investigate the plantation benefit of unit water consumption and obtain the pattern of the change in the plantation benefit of unit water consumption. The results demonstrate that an increase in results in an increase in the overall amount of water used, an increase in the benefit of cultivation and an increase in the overall plantation benefit of unit water consumption. However, a decrease in the risk aversion level cannot result in a significant increase in the plantation benefit of unit water consumption at different inflow levels.
3) In this study, surface water and groundwater are the only water resources considered. In reality, because some regions have relatively large acreages, the groundwater in these regions has already been severely overexploited. In recent years, these regions have started transferring water from external water resources. This study gives no consideration to the factor of water transfer from external water resources, which, to a certain extent, affects the optimization results. Therefore, it is necessary to improve the model established in the future to formulate more comprehensive schemes.
Acknowledgments
This research has been supported by funds from National Natural Science Foundation of China (51479032, 51579044); Yangtze River Scholars in Universities of Heilongjiang Province and Water Conservancy Science
and Technology Project of Heilongjiang Province (201318, 201503); The Outstanding Youth Fund of Heilongjiang Province (JC201402).
[References]
[1] Lu H, Huang G, He L. An inexact rough-interval fuzzy linear programming method for generating conjunctive water-allocation strategies to agricultural irrigation systems. Applied Mathematical Modelling, 2011; 35(9): 4330–4340. [2] Prasad A S, Umamahesh N V, Viswanath G K. Optimal
irrigation planning model for an existing storage based irrigation system in India. Irrigation and Drainage Systems, 2011; 25(1): 19–38.
[3] Huang Y, Li Y P, Chen X, Ma Y G. Optimization of the irrigation water resources for agricultural sustainability in Tarim River Basin, China. Agricultural Water Management, 2012; 107: 74–85.
[4] Xie Y L, Huang G H, Li W, Li J B, Li Y F. An inexact two-stage stochastic programming model for water resources management in Nansihu Lake Basin, China. Journal of Environmental Management, 2013; 127: 188–205.
[5] Guo P, Wang X L, Zhu H, Li M. Inexact fuzzy chance-constrained nonlinear programming approach for crop water allocation under precipitation variation and sustainable development. Journal of Water Resources Planning and Management, 2014; 140(9): 05014003.
[6] Samuel M P, Mathew A C. Improving water use efficiency by integrating fish culture and irrigation in coconut based farming system: A case study in Kasaragod District of Kerala (India). Int J Agric & Biol Eng, 2014; 7(2): 36–44.
[7] Cheng K, Fu Q, Li T X, Jiang Q X, Liu W. Regional food security risk assessment under the coordinated development of water resources. Natural Hazards, 2015; 78(1): 1–17. [8] Cheng K, Fu Q, Chen X, Li T X, Jiang Q X, Ma X S, et al.
Adaptive allocation modeling for a complex system of regional water and land resources based on information entropy and its application. Water Resources Management, 2015; 29(14): 4977–4993.
[9] Qiang F, Li J, Dong L, Li T X. Allocation optimization of water resources based on uncertainty stochastic programming model considering risk value. Transactions of the CSAE, 2016; 32(7): 136–144. (in Chinese)
[10] Yang G, Guo P, Li M, Fang S Q, Zhang L D. An improved solving approach for interval-parameter programming and application to an optimal allocation of irrigation water problem. Water Resources Management, 2016; 30(2): 701–729.
March, 2017 Fu Q, et al. Optimization of water use structure and plantation benefit using fractional programming Vol. 10 No.2 161 allocation: A comparative analysis of meta-models.
Journalof Hydroinformatics, 2015; 18(3): 446–465.
[12] Hu Z N, Chen Y Z, Yao L M, Wei C T, Li C Z. Optimal allocation of regional water resources: From a perspective of equity–efficiency tradeoff. Resources Conservation & Recycling, 2016; 109: 102–113.
[13] Fu Q, Meng F X, Li T X, Liu D, Gong F L, Osman A, et al. Cloud model-based analysis of regional sustainable water resource utilization schemes. Int J Agric & Biol Eng, 2016; 9(5): 67–75.
[14] Li M, Guo P, Singh V P. An efficient irrigation water allocation model under uncertainty. Agricultural Systems, 2016; 144: 46–57.
[15] Ahmad I, Tang D. Multi-objective linear programming for optimal water allocation based on satisfaction and economic criterion. Arabian Journal for Science and Engineering, 2016; 41(4): 1421–1433.
[16] Guo P, Huang G H. Two-stage fuzzy chance-constrained programming: application to water resources management under dual uncertainties. Stochastic Environmental Research and Risk Assessment, 2009; 23(3): 349–359.
[17] Li Y P, Huang G H, Yang Z F, Nie S L. IFTCIP: An integrated optimization model for environmental management under uncertainty. Environmental Modeling and Assessment, 2009; 14(3): 315–332.
[18] Maceira M E P, Marzano L G B, Penna D D J, Diniz A L, Justino T C. Application of CVaR risk aversion approach in the expansion and operation planning and for setting the spot price in the Brazilian hydrothermal interconnected system. Electrical Power and Energy Systems, 2015; 72: 126–135. [19] Qiu R Z, Huang X Y, Yuan H T. Robust optimization
model of multi-period inventory with uncertain demand distribution. Control and Decision, 2014; 29(9): 1644–1648.
[20] Xu L, Yu B. CVaR-constrained stochastic programming reformulation for stochastic nonlinear complementarity problems. Computational Optimization and Applications, 2014; 58(2): 483–501.