www.sciedu.ca/afr Accounting and Finance Research Vol. 3, No. 3; 2014
Published by Sciedu Press 143 ISSN 1927-5986 E-ISSN 1927-5994
Cash Holdings of S&P Firms Over the Past Decade
Mary Fischer1, Treba Marsh2 & Todd Brown2 1 The University of Texas at Tyler, College of Business & Technology, Texas USA
2 Stephen F. Austin State University, College of Business, Texas USA
Correspondence: Mary Fischer, The University of Texas at Tyler, College of Business & Technology, Texas USA. E-mail: mfischer@uttyler.edu
Received: July 13, 2014 Accepted: August 11, 2014 Online Published: August 13, 2014 doi:10.5430/afr.v3n3p143 URL: http://dx.doi.org/10.5430/afr.v3n3p143
Abstract
Over the past decade, financial research suggests US firms hold a significant amount of cash. This growing amount of cash has attracted attention from economists, the business press and government. A firm’s cash balance could well indicate the firm elects to hold cash rather than invest in suboptimal investments. There are trade-offs between holding too much cash and holding too little. This exploratory study attempts to find financial relationships that explain the cash held by S&P 100 firms over the decade from fiscal year 2002 to 2011.
Keywords: Cash holdings, Firm characteristics, Exploratory study 1. Introduction
At the end of 2012, the U.S. Federal Reserve Flow of Funds Accounts report nonfinancial corporate businesses held a record $1.79 trillion of aggregate liquid assets producing a 2.17:1 working capital ratio (Hodrick, 2013). This high working capital ratio, a measure of liquidity, indicates the cash is not being held just to satisfy obligations from normal business operations.
With the rise and sophistication of modern financial intermediaries, one could assume that holding excessive cash is no longer a necessity. Furthermore, improvements in forecasting and cash control should lower the need to hoard cash. However, recent research (Bates, Kahle, & Stulz 2009) reports firms tend to hold an excessive amount of cash and the theoretical motives seem to be firm characteristics including precautionary, taxes, agency costs and transaction costs. Thus, this study examines the determinants and relationships of cash holdings of the S&P 100 firms over the decade from 2002 to 2011.
Precautionary reasons for holding cash can best be described as the firm is afraid it can fall prey to an adverse, and sometimes unexpected, financial blow. Because of this fear, the firm tends to hold onto more cash. Opler, Pinkowitz, Stulz and Williamson (1999) document firms that have riskier projects tend to hold more cash. Also, Han and Qiu (2007) report firms with a history of volatility tend to hold more cash.
(Rauh & Sufi, 2010).
Jensen (1986) describes how agency theory can provide a reason as to why long-term managers in firms with high free cash-flow are averse to disbursing cash to shareholders. Harford et al. (2008) and Dittmar and Mahrt-Smith (2007) provide evidence that long-term managers are more likely to accumulate excess cash balances. Pinkowitz, Stulz and Williamson (2006) prove cash is valued less when agency problems exist between insiders and outside shareholders. Dittmar, Mahrt-Smith and Servaes (2003) provides evidence that cash holdings are higher in countries with reduced investment opportunities, asymmetric information, and other factors that increase the need to hold cash.
Even though long-term entrenched managers tend to accumulate cash holdings, Mikkelson and Partch (2003) find managerial incentives such as ownership and board characteristics do not explain excessive cash holdings. They report that firms with high cash holdings have expanded investments, R&D, and growth in assets. Opler et al. (1999) document that firms tend to have larger cash holdings when they have more growth opportunities, higher business risk, higher external constrains, less leverage and are smaller in size. Conversely, Kalcheva and Lins (2007) and Harford et al. (2008) find companies with weaker corporate governance have a lower cash level which is supported by Ozkan and Ozkan (2004).
Transaction costs play a large role in firms desire to hold excess cash so they can pay for projects such as R&D or acquire other firms (Kim & Park, 2012). Firms could choose instead to hold excess cash in the form of alternative interest-bearing assets. However, the cost to turn these assets into cash can vary from firm to firm. These transaction costs can be seen as a detriment to holding less cash. Worthy of note, however, is that economies of scale exist for larger firms in these types of transactions and allow larger firms to hold less cash in relation to smaller firms, who by comparison, pay a larger cost (Mulligan, 1997).
In an incomplete market, corporations hold and accumulate cash to avoid risk and have resources for future acquisitions (Keynes 1936). In addition to Bates et al.’s (2009) motives, Keynes argues firms hold cash due to a speculative motive that responds to the risk avoidance and trading incentive. Holding cash reduces the likelihood of experiencing financial distress costs if the firm’s operations do not generate enough cash to satisfy debt payments. In addition, cash may provide funds for investment projects that produce non-monetary benefits but destroy shareholder value (Jensen & Meckling, 1976). Holding too much cash, however, can enhance opportunity while too little cash presents investment disadvantages. Mulligan (1997) supports this argument as he provides evidence supporting the existence of economies of scale.
Why do firms hold so much cash? According to Jensen (1986), when information asymmetry exists between managers and shareholders, firms tend to retain larger amounts of cash rather than paying dividends to shareholders. The level of cash the firm holds is a balance between the costs and benefits of holding cash. Opler et al. (1999) claim firms tend to hold more cash than projected by the firm’s transaction costs. Harford (1999) argues firms accumulate more cash than they need to meet anticipated financing requirements. Harford et al. (2008) and Dittmar and Mahrt-Smith (2007) provide evidence suggesting that entrenched managers are more likely to build excess cash balances. Opler et al. (1999) and Ozkan and Ozkan (2004) report just the opposite, as they find little evidence that managerial entrenchment explains cash holdings
Wang, Ji, Chen and Song (2013) report inflation has a direct influence on the firm’s cash holding by affecting the demand and supply for cash in addition to an indirect affect via the firm’s operating cycle. They find that corporate cash holdings decrease as inflation increases from the perspective of the loss in purchasing power. However, when inflation reaches a certain level, firms increase their cash holdings to guard against bankruptcy (p.13).
Just as some firms hold excess cash, why do some firms hold too little? When firms experience operating losses, the firm must consume cash holdings to sustain itself. Opler et al. (1999) find firms with large changes in cash holdings typically have substantial operating losses and use their accumulated cash holdings to fund the losses. Denis and Sibilkov (2010) support these findings as firms with low or declining free cash flows over prior periods consume accumulated cash reserves. Faulkender and Wang (2006) report firms unable to obtain cash from capital markets have very low cash holdings, while multinational organizations with diversified investment opportunities hold less cash than independent corporations (Duchin, 2010). However, Pinkowitz et al. (2012) report US multinationals increased their cash holdings during the 2000s by roughly the same percentage as US domestic firms.
www.sciedu.ca/afr Accounting and Finance Research Vol. 3, No. 3; 2014
Published by Sciedu Press 145 ISSN 1927-5986 E-ISSN 1927-5994 part of the cash held by S&P 500 firms.
Our findings of cash holdings support Bates et al.’s (2009) documentation of US firms’ cash holding levels tend to rise over time. It also supports the precautionary motive that firms hold cash when adverse investment conditions such as the 2007 financial downturn that resulted in lower investment opportunities. Our findings do not support Dittmar and Duchin’s (2010) investigation that firms’ cash does not change easily, either from high to low or conversely from low to high, as there appears to be volatility during the period of FY 02 thru FY11.
2. This study
In this study, we examine, and expect a relationship between, cash holdings and short-term debt identified as debt maturing in one year with the assumption that cash holdings and short-term borrowings substitute for one another. We also use long-term debt as a proxy variable for risk as firms with higher long-term borrowing hold additional risk and are expected to hold more cash.
Our data consists of a sample of the S&P 100 firms retrieved from Thomson Reuters for the fiscal years 2002 to 2011 consisting of 880 firm-year observations for 88 non-financial US firms. Firms without complete data for the ten years (H. J. Heinz Co., Sara Lee and Sprint) are excluded from the analysis in addition to nine financial firms.
The study’s dependent variable is the firm’s total cash holdings. This value determines the ability of the firm to pay its operating costs and repay debt obligations. The firm’s cash holding strategy provides a trade-off between the costs of holding cash and spending the cash. Firms adjust their cash strategy to changes in purchasing power (Wang et al., 2013).
Nine independent variables are employed in the study based on previous research findings. These independent variables include cash flow, size, leverage, R&D, dividends paid, working capital, short-term debt, long-term debt and liquidity measures.
Cash flow is measured as cash flow relative to total assets. The speed and turnover of firm cash flow influences the firm’s cash holding strategy (Wang et al., 2013). Firms with higher cash flow accumulate more cash as such firms may have better investment opportunities (Bates et al., 2009). A positive relationship is expected between cash and cash flow.
Size is represented by the total sales revenue that represents the economies of holding cash (Mulligan, 1997). Sales revenue is commonly used as a proxy for size in the economic and accounting literature (Graham & Harvey, 2001; Reynolds & Francis, 2000). A positive relationship is expected with cash holdings as increasing sales provide investment opportunities together with precautionary resources. Al-Najjar (2013) argues that firm size is a proxy for financial flexibility and that large firms have less information asymmetry. Total assets are rejected as the size variable due to excessive collinearity. Based on the variable size of the firms in the study, the association between cash holdings and size can be either positive or negative.
Leverage is measured by the debt ratio calculated as total liabilities divided by total assets. Leveraged firms are more likely to hoard cash due to a greater probability of financial distress (Al-Najjar, 2013). If debt is constraining, firms use cash to reduce the leverage (Opler et al., 1999; Lockhart, 2014). Thus, a negative relationship between liquidity and cash held is anticipated.
R&D is a measure of the relationship of R&D expenditures to sales. Firms with greater R&D are assumed to have greater costs of financial distress (Pinkowitz et al., 2012). R&D is typically supported by cash holdings and stock issues (Brown, Fazzari, & Petersen, 2009; Kim & Park, 2012). Since R&D expenditures consume cash and serves as a proxy for growth opportunities and financial distress, a positive relationship between the cash holdings and R&D spending is anticipated.
Dividends paid by firms are based on the firm’s tradeoff of holding cash versus paying dividends (Al-Najjar, 2013). Ozkan and Ozkan (2004) argue that firms can avoid the use of cash holdings to pay dividends by issuing equity or reducing the amount of the dividend payment. However, a firm paying dividends is likely to be less risky and have greater access to capital markets (Opler et al., 1999), so the precautionary motive for holding cash is weaker. Because a firm with few liquid assets can decrease investments by raising funds through a stock issuance or asset sales, a negative association with cash holdings is expected with the cash holdings.
Thus, firms a positive r Short-term for financia debt reduce their risk o expected w Long-term precautiona investment debt. Liquidity i items) to c firms to rel as liquid a relation wit Using the d Ca 3. Analysis Cash holdin the financia cash holdin 7.86 percen Technology holdings re Johnson & findings th
s monitor and i relationship is e
debt is used as ally unconstrai e underinvestm of refinancing with short-term debt borrowin ary cash (Bate ts (Al-Najjar, 2
s a robust mea current liabiliti
ly less on capit assets can be li
th cash holding dependent and
ash it = B0 + B1 it + B7S s
ngs account fo al press and ac ngs grew to $5. nt (Table 1). T y and energy f epresent 12 pe & Johnson) repr at cash holding
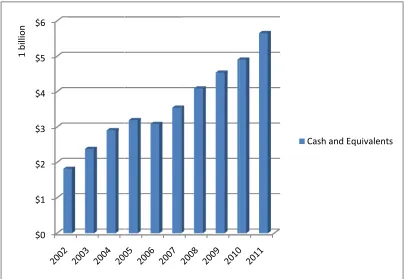
$0 $1 $2 $3 $4 $5 $6 1 billion
increase the ne expected betw s a credit line p ined firms. Har ment and agenc their short-ter debt. ng is viewed as
es et al., 2009 2013). Thus, a
asure of short-r es to determin al markets to o iquidated. Bas gs is expected. nine independ Cashflowit + B STdebt it + B8LT
or a significant cademics. Cash .65 billion (Fig Twenty-two firm
firms such as ercent of total resent 32 perce gs are concentr
F
et working capi een working ca proxy. Lockhar
rford, Klasa an cy costs. Furthe rm debt at hig
s a proxy of fir 9). Firms with a positive relat
run solvency. ne the firm’s ab obtain cash (Al sed on Ozkan
ent variables, a
B2Sizeit + B3 Le
Tdebt it + B9Li
part of the firm h holding for th gure 1). Over th
ms in the study United Techno S&P 100 firm ent of the 2011 rated among hi
Figure 1. Cash a
ital as a precau apital and the c rt (2014) report nd Maxwell (2 ermore, they fi gher rates. Wit
rm risk. Firms low cash hol tionship is exp
This measure bility to meet -Najjar, 2013). and Ozkan (20
a regression an everage it + B4 R
quidity it
ms’ assets in th he firms in Fis he same period y report cash h ologies, Exxon ms’ cash holdi 1 reported cash ighly profitable
and equivalent
utionary measu cash holdings. ts credit line av 2014) find cash ind that firms w th large cash h
with higher bo ldings issue de pected between
relates current cash demands . A tradeoff exi 004) and Al-N
nalysis is used t R&D it + B5Div
his study and re scal year 2002
, the cash to tot holdings greate n Mobil, IBM, ing, while two h holdings. Th e firms in the te
ts over time
ure. These beha
vailability is sim h holdings by f with large cash holdings, a po
orrowing are ex ebt rather than n large cash ho
t assets (less in . Holding liqu ists for when a Najjar’s (2013)
that is similar t vidends it + B6W
einforce analys averaged $1.8 tal assets grew er than the 201 , Boeing, and o companies (G his supports Pin
echnology and
Cash and Eq
avior patterns s
milar to cash h firms with shor h holdings can
sitive relations
xpected to hold n equities to f olding and lon
nventory and p uid assets enco cash shortage ) findings, a p
to Opler et al. ( Workcapital
sis presented b billion. By 20 w from 4.47 per
11 average cash ConocoPhillip General Electr nkowitz et al. d health care se
www.sciedu.ca/afr Accounting and Finance Research Vol. 3, No. 3; 2014
Published by Sciedu Press 147 ISSN 1927-5986 E-ISSN 1927-5994 Cash and marketable securities in fiscal year 2011 now equal 43.6 percent of short-term liabilities, which is far higher than the 2002 26.2 percent. This higher working capital ratio, that measure liquidity, suggests cash is not being held only to satisfy those obligations resulting from normal business operations.
Table 1. Descriptive Statistics by Fiscal Year With Sample Mean and SD
Based on the descriptive statistics, cash values and relationships increased over the study period. Dividend payments, for the most part doubled over the decade while measure of R&D to sales remained constant. Sales revenue and net working capital to assets reflect the impact of the economic downturn that began in 2007. Leverage decreased during the period with the exception of 2008 when debt balances and sales revenue increased. Liquidity correlated to the cash holding pattern.
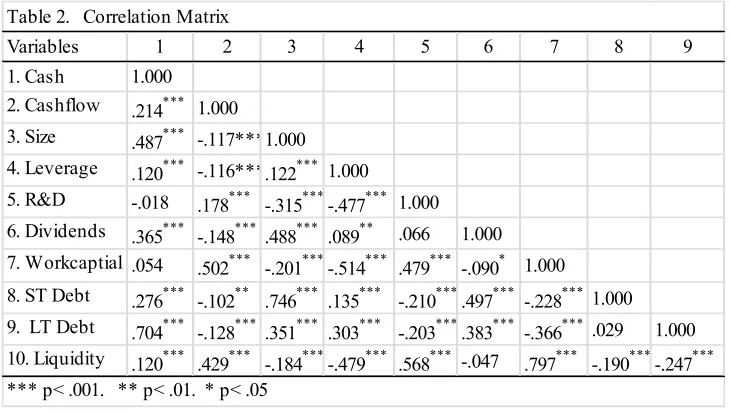
Table 2 provides the correlation for the dependent and independent variables in the OLS regression model. Workcapital and R&D did not have a significant correlation with cash holdings. They did have just over a .1 significance that suggests a weak prediction of cash holdings. As expected the correlation between dividends paid and R&D suggests dividends suffer when R&D is a major expenditure. Otherwise, the study’s variable significantly correlate to one another.
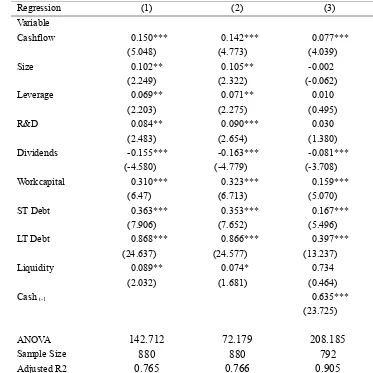
OLS regressions were used to assess the ability of the independent variables to explain cash holdings of the S&P 100 firms for the fiscal years 2002 through 2011. Preliminary analyses of the three models were conducted to ensure no violation of the assumptions of normality, multicollinearity and homoscedasticity exists. The variance inflation factors (VIF) in each of the models are below the suggested 4.0 cutoff (Hair, Black, Babin, & Anderson, 2010, 204). Table 3 presents the regression summary statistics.
Year Cash*
Cash as %
of Total
Assets
Cash as %
of Current
Liabilities
Total
Short‐
term
Debt*
Total
Long‐
term
Debt* Dividends*
R&D to
Sales
Sales
Revenue*
Net
Working
Capital to
Total
Assets Leverage Liquidity
2002 $ 1.81 4.47% 26.26% $ 6.90 $ 9.57 $ 0.80 0.0244 $ 27.28 16.34 68.84 1.24
2003 $ 2.37 5.30% 32.56% $ 7.29 $ 9.94 $ 0.89 0.0243 $ 30.98 16.79 66.13 1.24
2004 $ 2.90 6.00% 35.28% $ 8.23 $ 9.39 $ 0.98 0.0239 $ 35.01 18.60 64.12 1.32
2005 $ 3.19 6.47% 35.50% $ 8.99 $ 9.29 $ 1.49 0.0221 $ 38.60 17.63 62.67 1.29
2006 $ 3.08 5.59% 30.58% $ 10.08 $ 11.48 $ 1.28 0.0241 $ 41.07 16.91 62.78 1.13
2007 $ 3.54 5.92% 32.93% $ 10.74 $ 12.85 $ 1.48 0.0234 $ 45.65 16.22 62.94 1.15
2008 $ 4.08 6.79% 36.38% $ 11.22 $ 13.90 $ 1.57 0.0228 $ 50.11 14.43 66.01 1.16
2009 $ 4.53 7.17% 42.77% $ 10.60 $ 15.13 $ 1.48 0.0266 $ 44.64 16.27 63.46 1.36
2010 $ 4.90 7.28% 41.47% $ 11.82 $ 15.01 $ 1.59 0.0272 $ 47.44 15.44 61.82 1.27
2011 $ 5.65 7.86% 43.63% $ 12.94 $ 14.98 $ 1.77 0.0266 $ 53.26 15.85 62.53 1.33
* in billions
Variables 1 2 3 4 5 6 7 8 9
1. Cash 1.000
2. Cashflow .214*** 1.000
3. Size .487*** -.117***1.000
4. Leverage .120*** -.116***.122*** 1.000
5. R&D -.018 .178***
-.315***-.477*** 1.000
6. Dividends .365***
-.148*** .488*** .089** .066 1.000
7. Workcaptial .054 .502***
-.201***-.514*** .479*** -.090* 1.000
8. ST Debt .276***
-.102** .746*** .135*** -.210***.497*** -.228*** 1.000
9. LT Debt .704***
-.128*** .351*** .303*** -.203***.383*** -.366*** .029 1.000
10. Liquidity .120***
.429*** -.184***-.479*** .568*** -.047 .797*** -.190***-.247***
Table 2. Correlation Matrix
Table 3. OLS Regressions Model Summary
Regression (1) (2) (3)
Variable
Cashflow 0.150*** 0.142*** 0.077***
(5.048) (4.773) (4.039)
Size 0.102** 0.105** -0.002
(2.249) (2.322) (-0.062)
Leverage 0.069** 0.071** 0.010
(2.203) (2.275) (0.495)
R&D 0.084** 0.090*** 0.030
(2.483) (2.654) (1.380)
Dividends -0.155*** -0.163*** -0.081***
(-4.580) (-4.779) (-3.708)
Workcapital 0.310*** 0.323*** 0.159***
(6.47) (6.713) (5.070)
ST Debt 0.363*** 0.353*** 0.167***
(7.906) (7.652) (5.496)
LT Debt 0.868*** 0.866*** 0.397***
(24.637) (24.577) (13.237)
Liquidity 0.089** 0.074* 0.734
(2.032) (1.681) (0.464)
Cash t-1 0.635***
(23.725)
ANOVA 142.712 72.179 208.185
Sample Size 880 880 792
Adjusted R2 0.765 0.766 0.905
For each variable, the second row reports the t-statistic in parentheses. Regressions (2) and (3) also include year dummy variables (coefficients are not reported for brevity).
* significant at 10%; ** significant at 5%; *** significant at 1%
The independent variables in the Regression (1) explain 76.5 % of the cash held by the S&P 100 firms at a significance of .000. Four independent variables, size, leverage, R&D and liquidity are significant at .05 or less. The remaining five variables are significant at .000.
We include two additional regressions to control for the dynamic nature of the panel data. Regression (2) includes year dummy variables to help control for any year fixed effects. In this model, liquidity became slightly less significant and R&D became slightly more significant. Regression (3) includes a lagged cash variable (to control for any endogeneity issues) along with the year dummy variables. Size, leverage, R&D, and liquidity all became less significant.
We find a significant positive relationship between debt obligations and cash holdings that was anticipated. We expect the firms to use cash to reduce leverage. However, as debt obligations increased, the firms elected to not use cash as a credit line (Lockhart, 2014). We find a positive significant relationship between short-term debt and cash holdings as did Harford et al. (2014). The analysis finds firms held far more cash while increasing both short-term and long-term debt. Liquidity measures are sustained over the time covered by the study. The positive relation between borrowings and cash holdings indicates that firms with higher risk do hold more cash.
www.sciedu.ca/afr Accounting and Finance Research Vol. 3, No. 3; 2014
Published by Sciedu Press 149 ISSN 1927-5986 E-ISSN 1927-5994 Dividends are found to have a negative relationship with cash holdings because the dividend payouts did not keep pace with the cash holdings increase as anticipated. These findings support Opler et al. (1999), because when dividends payments were paid, debt was issued rather than equity.
A positive relationship was found between R&D and cash holdings. Although the R&D expenditures are related to sales, the R&D projects did not keep pace with the increase in sales revenue, and it fell short of the cash holdings increase trend.
The net working capital to total assets relationship to cash holdings supports Wang et al.’s (2013) argument that working capital and total assets should be balanced to avoid financial distress. It appears that firms in this study monitor and increase the net working capital as a precautionary measure.
The short-run solvency measure, liquidity, has a positive relationship to cash holdings in this study which refutes Ozkan and Ozkan (2004) and Al-Najjar’s (2013) arguments. They argue that when needed, liquid assets are liquidated and the firms do not rely on capital markets. Firms in this study did rely on the capital markets for cash as borrowing increased in relationship to cash holdings over time.
4. Conclusion
There is evidence that economy of scale exists for large firms to hold cash. This study examines the determinants and relationships of cash holdings of the S&P 100 firms over the decade from 2002 to 2011. The analysis finds a positive relation between cash flows, sales revenue, leverage, R&D, working capital, current debt, long-term debt and liquidity. A significant negative relation is found between cash holdings and dividends. These relationships are consistent with previous studies.
Specifically, there is a significant positive relation between cash holdings and firm size, which means cash holdings respond to the effect of economies of scale, supporting previous studies, the business press and academic reports of US firms holding large cash balances. In addition, there is a significant positive relation between borrowing and cash holdings. This is more complex as it indicates that firms with higher risk (higher marginal cost of cash shortage) hold more cash which supports the static tradeoff theory. The analysis also finds there is a significant positive relation between debt, both short-term and long-term, with cash holdings. This indicates firms are holding cash as a precautionary measure rather than borrowing resources internally to support cash needs. This leads to the conclusion that firms rely on cash holdings rather than financial institution’s credit lines.
This study’s finding contributes to the literature as it confirms large highly profitable firms retain large amounts of cash. Although this implies firms’ cash holdings are less relevant to a transaction or precautionary motive and it does beg the question of where a speculative motive explains the cash holding phenomenon. Despite firms weathering the 2007 recession, they continue to protect their liquidity and cash positions. Multinational firms are holding cash abroad (Rubin, 2014). Should politicians grant a repatriation tax holiday as they did in 2004, cash holdings repatriated would enhance the firm’s value as well as the national economy. The amount of cash held is unique to the firm and is based on the firm’s analysis of uncertain demand, volatile world markets, economic issues, and financial risks.
References
Al-Najjar. (2013). The financial determinants of corporate cash holdings. International Business Review. 22: 77-88. http://dx.doi.org/10.1016/j.ibusrev.2012.02.004
Bates, T., Kahle, K. & Stulz, R. (2009). Why do U.S. firms hold so much more cash than they used to? The Journal of Finance. 64 (5): 1985-2021. http://dx.doi.org/10.1111j.1540-6261.2009.01492.x
Brown, J. R.,Fazzari, S. M. & Petersen, B. C. (2009). Financing, innovation and growth: Cash flow, external equity and the 1990s R&D boom. The Journal of Finance. 64: 151-185. http://dx.doi.org/10.1111/j.1540-6261.2008.01431.x Denis, D. J. & Sibilkov, L. (2010). Financial constraints, investments and the value of cash holdings. The Review of
Financial Studies. 253: 247-269. http://dx.doi.org/10.1093/rfs/hhp031
Dittmar, A. & Duchin, R. (2010). The dynamics of cash. Working paper. University of Michigan. SSRN Abstract 1569529.
Dittmar, A. & Mahrt-Smith, J. (2007). Corporate governance and the value of cash holdings. Journal of Financial Economics. 83: 599-634. http://dx.doi.org/10.1016/j.jfineco.2005.12.006
Dittmar, A., Mahrt-Smith, J. & Servaes, H. (2003). International corporate governance and corporate cash holdings. Journal of Financial and Quantitative Analysis. 38: 111-133. http://dx.doi.org/10.2307/4126766
Duchin, R. (2010). Cash holdings and corporate diversification. The Journal of Finance. 65: 955-992. DOI:1111j.1540.6261.2010.01558.x.
August.LXI(4): 1957-1990. DOI:1111j.1540-6261.2006.00894.x.
Foley, C. F., Hartzell, J. C., Titman, S. & Twite, G. (2007). Why do firms hold so much cash? A tax-based explanation. Journal of Financial Economics. 86: 579-607. DOI: 10-1016/j.jfineco.2006.11.006.
Graham, J. R. & Harvey, C. R. (2001). The theory and practice of corporate finance evidence from the field. Journal of Financial Economics. 60(2):187-242. DOI:10.1016/30304-405x(01)00044-7.
Hair, Jr., J. R., Black, W. C., Babin, B. J. & Anderson, R. E. (2010). Multivariate Data Analysis. Upper Saddle River, NJ: Prentice Hall.
Han, S. & Qiu, J. (2007). Corporate precautionary cash holdings. Journal of Corporate Finance. 13: 43–57. http://dx.doi.org/10.1016/j.jcorpfin.2006.05.002
Harford, J. (1999). Corporate cash reserves and acquisitions. Journal of Finance. 54: 1969-1997. http://dx.doi.org/10.1111/0022-1082.00179
Harford, J., Klasa, S. & Maxwell, W. F. (2014). Refinancing risk and cash holdings. The Journal of Finance. 69 (3): 975-1012. http://dx.doi.org/10.1111/jofi.12133
Harford, J., Mansi, S. A. & Maxwell, W. F. (2008). Corporate governance and a firm’s cash holdings. Journal of Financial Economics. 87: 535-555. http://dx.doi.org/10.1016/j.jfineco.2007.04.002
Harvey, C. R., Lins, K. V. & Roper, A. H. (2004). The effect of capital structure when expected agency costs are extreme. Journal of Financial Economics. 74: 3-30. http://dx.doi.org/10.1016/j.jfineco.2003.07.003
Hodrick, L. S. (2013). Are U. S. firms really holding too much cash? Stanford Institute for Economic Policy Research Brief. Palo Alto, CA: Stanford University.
Jensen, M. (1986). Agency costs of free cash flow, corporate finance and takeovers. American Economic Review. 76: 323–329.
Jensen, M. & Meckling, W. H. (1976). Theory of the firm: Managerial behavior, agency costs and ownership structure. Journal of Financial Economics. 3: 305 – 360. http://dx.doi.org/10.1016/0304-405X(76)90026-X
Kalcheva, S. & Lins, K. V. (2007). International evidence on cash holdings and expected managerial agency problems. Review of Financial Studies. 20: 1087-1112. http://dx.doi.org/10.1093/rfs/hhm023
Keynes, J. M. (1936). The Corporate Theory of Employment, Interest and Money. London: McMillan.
Kim, H. & Park, S. (2012). The relation between cash holdings and R&D expenditures according to ownership structure. Eurasian Business Review. 2(2): 25-42.
Lockhart, G. B. (2014). Credit lines and leverage adjustments. Journal of Corporate Finance. 25, 274-288. http://dx.doi.org/10.1016/j.jcorpfin.2013.12.011
Mikkelson, W. & M. Partch. 2003. Do persistent large cash reserves hinder performance? Journal of Financial and Quantitative Analysis. 38: 275-294. http://dx.doi.org/10.2307/4126751
Mulligan, C. B. (1997). Scale economies, the value of time, and the demand for money: Longitudinal evidence from firms. Journal of Political Economy. 105: 1061-1079. http://dx.doi.org/10.1086/262105
Opler, T., Pinkowitz, L., Stulz, R. & Williamson, R. (1999). The determinants and implications of corporate cash holdings. Journal of Financial Economics. 52: 3-46. http://dx.doi.org/10.1016/S0304-405X(99)00003-3 Ozkan, A. & Ozkan, N. (2004). Corporate cash holdings: An empirical investigation of UK companies. Journal of
Banking and Finance. 28: 2103-2134. http://dx.doi.org/10-1016/j.jbankfin.2003.08.003
Pinkowitz, L., Stulz, R. S. & Williamson, R. (2006). Do firms in countries with poor protection of investor rights hold more cash? Journal of Finance. 61: 2725-2751. http://dx.doi.org/10-1111j.1540-6261.01003.x
Pinkowitz, L., Stulz, R. S. & Williamson, R. (2012). Multinationals and the high cash holdings puzzle. National Bureau of Economic Research (NBER) Working Paper No. 18120. June.
Rauh, J. & Sufi, A. (2010). Capital structure and debt structure. Review of Financial Studies. 23: 4242-4280. http://dx.doi.org/10.1093/rfs/hhq095
Reynolds, J. K. & Francis, J. R. (2000). Does size matter? Journal of Accounting and Economics. 30(3): 375-400. http://dx.doi.org/10-1016/SO165-410(01)11110-6
Rubin, R. (2014). Repatriation tax holiday would costs U.S. $95.8 billion. Bloomberg Business. June 9.