PRIMARY RESEARCH
PD-1 and PD-L1 correlated gene expression
profiles and their association with clinical
outcomes of breast cancer
Cui Jiang
1, SunRun Cao
2, Na Li
2, Lei Jiang
1and Tao Sun
1*Abstract
Background: Immunotherapies that targeting programmed cell death 1 (PD-1) and programmed death-ligand
1 (PD-L1) have obtained prominent success in breast cancer (BC). However, not all the patients benefit from the antibody therapy. This study aimed to identify PD-1/PD-L1 correlated genes and pathways as well as investigate their potential as prognostic marker in BC.
Materials and methods: By analysing transcriptional data of BC from TCGA, we identified PD-1 and PD-L1 correlated genes by WGCNA analysis and explored the biological process as well as pathways they enriched. Co-expression analysis were performed for PD-1/PD-L1 with immune infiltration and checkpoints. The prognostic value of PD-1 and PD-L1 were also investigated.
Results: PD-1 and PD-L1 expression showed significant difference in different molecular subtypes and stages. PD-1 correlated genes enriched in T cell activation, lymphocyte activation, leukocyte migration while PD-L1 correlated genes demonstrated enrichment including T cell apoptotic process, tolerance induction and cytolysis. Immune infiltration analysis suggested that PD-1 and PD-L1 were related with Neutrophils (r = 0.65, r = 0.48) and Fibro-blasts (r = 0.59, r = 0.47). For immune checkpoints analysis, PD-1 was associated with HLA-A (r = 0.804) and INPP5D (r = 0.782) while PD-L1 correlated with CTLA4 (r = 0.843) and CD27 (r = 0.823). PD-1 was associated favorable survival of BC (HR = 0.67, P = 0.012) while PD-L1 did not demonstrate significant association with BC prognosis (HR = 0.85, P = 0.313).
Conclusion: PD-1 and PD-L1 correlated genes participated in biological process including T cell activation, lympho-cyte activation, leukolympho-cyte migration, T cell apoptotic process, tolerance induction and cytolysis. PD-1/PD-L1 expres-sion also demonstrated relation with immune infiltration and immune checkpoints. High PD-1 expresexpres-sion predicted better survival of breast cancer patients.
Keywords: PD-1, PD-L1, Immune, Breast cancer
© The Author(s) 2019. This article is distributed under the terms of the Creative Commons Attribution 4.0 International License (http://creat iveco mmons .org/licen ses/by/4.0/), which permits unrestricted use, distribution, and reproduction in any medium, provided you give appropriate credit to the original author(s) and the source, provide a link to the Creative Commons license, and indicate if changes were made. The Creative Commons Public Domain Dedication waiver (http://creativecommons.org/ publicdomain/zero/1.0/) applies to the data made available in this article, unless otherwise stated.
Background
As one of the most frequently occurred malignant tumors, breast cancer (BC) remains the leading cause of cancer-related death for females in many countries [1]. Breast cancer arises from multiple genetic fac-tors, environmental alternations and their complicated
interactions [2]. According to the status of biomark-ers including estrogen receptor (ER), progesterone receptor (PR) and epidermal growth factor receptor 2 (HER2), patients with breast cancer were classified into groups of luminal A, luminal B, HER-2 positive and triple negative [3]. It has been accepted that differ-ent groups of BC patidiffer-ents benefit from corresponding treatment strategy of chemical and hormonal therapy [4].
Although certain therapeutic combinations have been used as standard treatment in clinical management of
Open Access
*Correspondence: suntao@cancerhosp-ln-cmu.com
BC, some BC patients still could not get satisfactory clin-ical outcomes [5]. The different outcomes of BC patients indicated that other critical factors also determine the final therapeutic effect such as the immune status of the cells [6]. It is well-accepted that immune escape of tumor cells and aberrant human immune surveillance play essential role in carcinogenesis, progression and metas-tasis of various types of cancer [7]. As for immune escape of cancer cells, the identification of PD-1 (programmed death 1) and PD-L1 (programmed death-ligand 1) axis was one of the most encouraging finding of cancer ther-apy in recent years [8]. Serving as an immune checkpoint in tumor microenvironment, the antibodies of PD-1/ PD-L1 has shown prominent effect in a large number of cancer types [9].
Previously, PD-L1 expression has been reported to be associated with worse prognosis of triple negative breast cancer patients, which counteract effect of tumor-infiltrating lymphocytes (TILs) [10]. Another study of HER2 + invasive BC patients indicated a positive cor-relation of PD-L1 expression and CD8+ T cells with favorable clinical outcomes [11]. One research of 1318 BC patients in European suggested that PD-1 positive immune cells in triple negative breast cancer correlated with longer disease-free survival, and tumor-infiltrating lymphocytes (TILs) density was remarkably related with PD-1 and PD-L1 expression in immune cells [12]. Most of the findings implied that medicine concerning PD-1 and PD-L1 immune checkpoint might become novel therapeutic strategies for breast cancer.
Although the critical role of immune checkpoint PD-1 and PD-L1 have been widely reported in a number of malignant tumors, the underlying regulating mecha-nisms in breast cancer is still unclear. In this study, we performed comprehensive analysis of gene expression profiles related to PD-1 and PD-L1 in breast cancer using transcriptome data from TCGA. The correlation of PD-1 and PD-L1 with other immune biomarkers and immune cells infiltration were revealed. Furthermore, the effect of PD-1 and PD-L1 on clinical outcomes of BC was explored to determine their potential as biomarkers for BC patients prognosis.
Materials and methods
Analyzed datasets
The RNA sequencing and clinical data of breast can-cer patients in TCGA datasets were downloaded from UCSC XENA (https ://xena.ucsc.edu/). The level of gene expression was measured as Transcripts per million reads (TPM). Clinical data included the histological type, molecular Type, cancer stage, recurrence event and sur-vival information. The relationship between PD-1/PD-L1 expression and the clinical data were investigated.
Co‑expression gene and enrichment analysis
Weighted correlation network analysis (WGCNA) is an algorithm for finding genetic interactions in a weighted manner. Co-expressed genes obtained by WGCNA anal-ysis will be more accurate. Using WGCNA analanal-ysis, we searched the co-expressed genes for PD-1 and PD-L1. As genes with little variation in expression usually represent noise, the most variant genes were filtered for network construction. Gene variabilities were measured by median absolute deviation (MAD). If the interaction gene was more than 200, we used the interaction degree to search the top 200 gene as the interaction genes. Clusterprofiler is a R package for enrichment analysis. Using clusterprofier, we used biological process in the Gene Ontology (GO) to analyze the interacted genes [13]. Since the results of the enrichment analysis contain many similar results, we fur-ther concentrated the results of the enrichment analysis.
Relationship between immune factors and PD‑1/PD‑L1
A variety of studies have confirmed that immune infiltra-tion and all aspects of the tumor are related. MCP-coun-ter is available R package to estimate the sample immune infiltration. From a gene expression matrix, it produces for each sample an abundance score for CD3+ T cells,
CD8+ T cells, cytotoxic lymphocytes, NK cells, B
lym-phocytes, cells originating from monocytes (monocytic lineage), myeloid dendritic cells, neutrophils, as well as endothelial cells and fibroblasts. Then we used correla-tion analysis to evaluate the correlacorrela-tion between PD-1/ PD-L1 and immune infiltration. Immunological check-points serve as the primary site for detecting immune status, and we also evaluated the relationship between PD-1 and PD-L1 and immune checkpoints.
Statistical analysis
In this study, statistical analysis was mainly performed by using R language (https ://www.r-proje ct.org/) with sev-eral publicly available packages. Rank sum test was used to evaluate the expression difference of PD-1/PD-L1 in dif-ferent groups. Spearman correlation analysis was used to explore the correlation between PD-1/PD-L1 expression and immune infiltration and immune checkpoints. Sur-vival curve was generated by Kaplan- Meier method based on log-rank test. Other Figures were generated by several R packages, such as pheatmap, circlize, and corrplot. All mul-tiple tests were corrected by the BH method. A probability value P < 0.05 was considered to be significant in this study.
Results
PD‑1/PD‑L1 expression status in different clinical subgroups
data. As shown in Fig. 1a, both PD-1 and PD-L1 expres-sion showed significant difference in the three molecular subtypes (P < 0.001 and P = 0.047, respectively). Lumi-nal and Basal-like subtype show significant difference in PD-1 and PD-L1 expression. Moreover, the expression of PD-L1 differs among different stages (P = 0.032), while PD-1 did not show any difference (P = 0.536). In addi-tion, both PD-1 and PD-L1 expression correlated with the recurrence event of BC patients (P = 0.017, P = 0.015, respectively). We also analyzed the relation of PD-1/
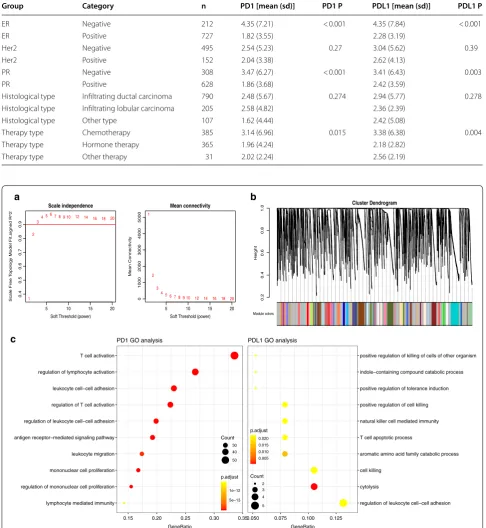
PD-L1 expression with clinical data including therapy, histological subtype, ER, PR and HER-2 status (Table 1). Finally, both PD-1 and PD-L1 were correlated with ER, PR and clinical therapy, indicating the probable implica-tion of PD-1/PD-L1 in clinical outcome.
Co‑expression analysis of genes associated with PD‑1 and PD‑L1
Using WGCNA, we analyzed the co-expression gene associated with PD-1 and PD-L1. The connectivity among
a
b
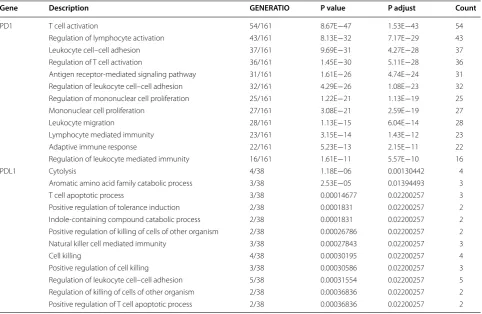
Fig. 1 Differences in PD-1 and PD-L1 expression between different clinicopathological information. a PD-1 and PD-L1 expression in molecular type.
genes was a scale-free network distribution if the value of soft thresholding power β equals to 3 (Fig. 2a). Altogether 21 module was obtained according to WGCNA analysis (Fig. 2b). Among these modules, PD-1 belonged to pink
module while PD-L1 belonged to thistle 1 module. We finally got 1065 genes that interacted with PD-1 and 99 PD-L1 correlated genes. Then we selected the top 200 gene associated with PD-1 and all of the 99 PD-L1 related
Table 1 Association between PD-1/PD-L1 expression and clinical data
Group Category n PD1 [mean (sd)] PD1 P PDL1 [mean (sd)] PDL1 P
ER Negative 212 4.35 (7.21) < 0.001 4.35 (7.84) < 0.001
ER Positive 727 1.82 (3.55) 2.28 (3.19)
Her2 Negative 495 2.54 (5.23) 0.27 3.04 (5.62) 0.39
Her2 Positive 152 2.04 (3.38) 2.62 (4.13)
PR Negative 308 3.47 (6.27) < 0.001 3.41 (6.43) 0.003
PR Positive 628 1.86 (3.68) 2.42 (3.59)
Histological type Infiltrating ductal carcinoma 790 2.48 (5.67) 0.274 2.94 (5.77) 0.278 Histological type Infiltrating lobular carcinoma 205 2.58 (4.82) 2.36 (2.39)
Histological type Other type 107 1.62 (4.44) 2.42 (5.08)
Therapy type Chemotherapy 385 3.14 (6.96) 0.015 3.38 (6.38) 0.004 Therapy type Hormone therapy 365 1.96 (4.24) 2.18 (2.82)
Therapy type Other therapy 31 2.02 (2.24) 2.56 (2.19)
5 10 15 20
0.
4
0.5
0.6
0.7
0.8
0.9
Scale independence
Soft Threshold (power)
Scale Free
To
pology Model Fit,signed R^2
1 2
34 56 7 8 9 10 12 14 16 18 20
5 10 15 20
0
100
02
00
03
000
4000
5000
Mean connectivity
Soft Threshold (power)
Mean Connectivity
1
2
3
4 5 6 7 89 10 12 14 16 18 20 0.2
0.4
0.6
0.8
1.
0 Cluster Dendrogram
as.dist(dissTom)
Height
Module colors
lymphocyte mediated immunity regulation of mononuclear cell proliferation mononuclear cell proliferation leukocyte migration antigen receptor−mediated signaling pathway regulation of leukocyte cell−cell adhesion regulation of T cell activation leukocyte cell−cell adhesion regulation of lymphocyte activation T cell activation
0.15 0.20 0.25 0.30 0.35
GeneRatio
Count
30 40 50
5e−13 1e−12
p.adjust
PD1 GO analysis
regulation of leukocyte cell−cell adhesion cytolysis
cell killing
aromatic amino acid family catabolic process T cell apoptotic process
natural killer cell mediated immunity positive regulation of cell killing positive regulation of tolerance induction indole−containing compound catabolic process positive regulation of killing of cells of other organism
0.050 0.075 0.100 0.125 GeneRatio
0.005 0.010 0.015 0.020
p.adjust
Count
2 3 4 5
PDL1 GO analysis
a
c
b
genes for further enrichment analysis. PD-1 correlated genes mainly enriched in biological process of T cell acti-vation, regulation of lymphocyte actiacti-vation, regulation of T cell activation and leukocyte migration while PD-L1 correlated genes demonstrated enrichment including positive regulation of killing of cells of other organism, T cell apoptotic process, positive regulation of tolerance induction and cytolysis (Fig. 3 and Table 2).
PD‑1/PD‑L1 expression and immune infiltration
Using Microenvironment Cell Populations-counter, we evaluated the profiles of immune infiltration among
various subtypes and stages breast cancer (Fig. 3a). Additionally, the associations of PD-1 and PD-L1 with immune cell populations according to the transcrip-tomic data were analyzed. The results indicated that PD-1 and PD-L1 were mainly related with Neutrophils (r = 0.65, r = 0.48) and Fibroblasts (r = 0.59, r = 0.47) (Fig. 3b).
PD‑1/PD‑L1 expression and immune checkpoints
As previous reported, the immune checkpoints mainly included CD28, CD80, CD86, CTLA4, INPP5D, INPPL1, CD58, CD27, CD70, HLA-A, CD74. We then analyzed the
Neutrophils Endothelial_cells Fibroblasts B_lineage Monocytic_lineage Myeloid_dendritic_cells NK_cells T_cells CD8_T_cells Cytotoxic_lymphocytes PD1 PDL1 MolecularType Stage Stage stage i stage ii stage iii stage iv MolecularType ke ERBB2 type Luminal type PDL1 2 PD1 2 0 2 0.44 0.65 0.57 0.59 0.38 0.49 0.33 0.41 0.11 0.02 0.48 0.39 0.47 0.43 0.34 0.41 0.39 0.12 0.07 0.69 0.72 0.52 0.48 0.47 0.59 0.01 0.27 0.16 0.71 0.46 0.45 0.39 0.53 0 0.25 0.12 0.54 0.46 0.45 0.57 0.02 0.28 0.13 0.33 0.44 0.47 0.18 0.33 0.18 0.25 0.37 0.14 0.07 0.49 0.12 0.29 0.29 0.12 0.39 0.25 0.3 0.230.41 PD1 PDL1 Neutrophils Endothelial_cells Fibroblasts B_lineage Monocytic_lineage Myeloid_dendritic_cells NK_cells T_cells CD8_T_cells Cytotoxic_lymphocytes a b
Fig. 3 PD-1/PD-L1 expression and immune infiltration. a The proportion of all immune infiltration components in breast cancer. b co-expression analysis between PD-1/PD-L1 and immune infiltration
Table 2 Top ten terms of GO analysis for PD-1 and PD-L1
Gene Description GENERATIO P value P adjust Count
PD1 T cell activation 54/161 8.67E−47 1.53E−43 54
Regulation of lymphocyte activation 43/161 8.13E−32 7.17E−29 43 Leukocyte cell–cell adhesion 37/161 9.69E−31 4.27E−28 37 Regulation of T cell activation 36/161 1.45E−30 5.11E−28 36 Antigen receptor-mediated signaling pathway 31/161 1.61E−26 4.74E−24 31 Regulation of leukocyte cell–cell adhesion 32/161 4.29E−26 1.08E−23 32 Regulation of mononuclear cell proliferation 25/161 1.22E−21 1.13E−19 25 Mononuclear cell proliferation 27/161 3.08E−21 2.59E−19 27
Leukocyte migration 28/161 1.13E−15 6.04E−14 28
Lymphocyte mediated immunity 23/161 3.15E−14 1.43E−12 23 Adaptive immune response 22/161 5.23E−13 2.15E−11 22 Regulation of leukocyte mediated immunity 16/161 1.61E−11 5.57E−10 16
PDL1 Cytolysis 4/38 1.18E−06 0.00130442 4
Aromatic amino acid family catabolic process 3/38 2.53E−05 0.01394493 3
T cell apoptotic process 3/38 0.00014677 0.02200257 3
Positive regulation of tolerance induction 2/38 0.0001831 0.02200257 2 Indole-containing compound catabolic process 2/38 0.0001831 0.02200257 2 Positive regulation of killing of cells of other organism 2/38 0.00026786 0.02200257 2 Natural killer cell mediated immunity 3/38 0.00027843 0.02200257 3
Cell killing 4/38 0.00030195 0.02200257 4
correlation between PD-1/PD-L1 expression and impor-tant immune checkpoints. As shown in Fig. 4 and Table 3, PD-1 was mainly associated with HLA-A (r = 0.804) and INPP5D (r = 0.782) while PD-L1 correlated with CTLA4 (r = 0.843) and CD27 (r = 0.823).
Survival analysis of PD‑1/PD‑L1 and PD‑1/PD‑L1 correlated genes
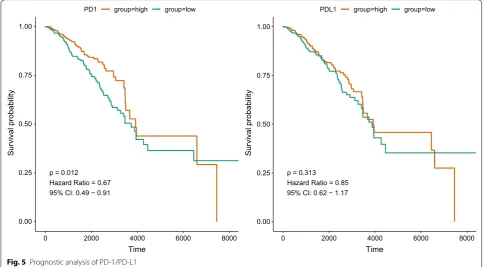
As PD-1/PD-L1 expression was correlated with clini-cal data, we then explored the prognostic value of PD-1/PD-L1 in breast cancer. As shown in Fig. 5 and Table 4, the expression of PD-1 was associated with
favorable survival of breast cancer patients (HR = 0.67, 95% CI 0.49–0.91, P = 0.012) while PD-L1 did not dem-onstrate significant association with BC prognosis (HR = 0.85, 95% CI 0.62–1.17, P = 0.313). As for the mul-tivariable analysis adjusting for age and stage, PD-1 still predicted better survival for BC patients (HR = 0.71, 95% CI 0.50–0.99, P = 0.045) but PD-L1 showed no sig-nificant relation (HR = 0.99, 95% CI 0.71–1.37, P = 0.934). In addition, PD-1/PD-L1 correlated genes were also ana-lyzed in relation to prognosis of BC patients. The results suggested that certain immune markers interacting with PD-1/PD-L1 also correlated with survival of BC patients
PD1
PDL1 CD28
CD80
CD86 CTLA4
INPP5D
0
0.3
0.6
0.9
1.2 1.5
1.8
2.1
0
0.3
0.6
0.9 1.2
1.5 1.8
2.1 2.4
2. 7
0
0.3 0.6
0.9 1.2
0 0.3
0 0.3
0.6 0.9 0 0.3
0.6
0.9 1.2
0 0.3
0. 6 0.
9
PD1
PDL1 INPPL1
CD58
CD27 CD70
HLA−
A
CD74
0
0.3
0.6
0.9
1.2 1.5 1.8 2.1 2.4 0 0.3
0.6
0.9 1.2
1.5 1.8
2. 1 2. 4
0
0.3
0.6
0.9
0 0.3
0 0.3
0.6 0.9 1.2 0 0.3
0.6
0.9 0
0.3 0.
6
0. 9
1.2
0
-1 1
Fig. 4 Co-expression analysis between PD-1/PD-L1 and immune checkpoints
Table 3 Co-expression analysis between PD-1/PD-L1 and immune checkpoints
P value was adjusted by ‘BH’ methods
Gene PD1_R PD1_p PD1_padj PDL1_R PDL1_p PDL1_padj
including CD5, CD74, CD96 and CD226 (Additional file 1: Table S1).
Discussion
It is well-accepted that tumor and its microenvironment is a complex unit to complete the aggressive growth and metastasis of cancer cells [14–16]. Although a number of chemical and radical therapy have been used in clini-cal practice of cancer treatment, the immune system of human are still believed to be the most fundamental and effective weapon against cancer [17]. Programmed cell death 1 (PD-1) and corresponding ligand (PD-L1) are one of the most critical biological suppressors of cyto-toxic immune reaction, the antibody of which has been authorized by FDA in a unprecedented fast term [18, 19]. However, the inhibitor of PD-1/PD-L1 were not effec-tive in every individual, which require the comprehensive understanding of specific mechanisms underlying PD-1/ PD-L1 regulation in carcinogenesis [20].
Using data from TCGA, we first unraveled the expres-sion status of PD-1/PD-L1 in different subtypes and clinical stages of BC patients. PD-L1 expression was decreased in stage III-IV compared with stage I-II. On the basis of molecular classification, basal-like BC type showed highest expression of PD-1 and ERBB2 sub-type BC had highest PD-L1 expression, which suggest that different subtypes possess various PD-1/PD-L1 sta-tus. In addition, PD-1 and PD-L1 expression correlated with the recurrence of BC patients, which also confirm the critical role of PD-1/PD-L1 immune checkpoint in BC progression.
We subsequently identified co-expressed genes of PD-1 and PD-L1 by means of WGCNA. A total of 1065 genes correlated with PD-1 and 99 PD-L1 correlated genes were screened. The GO enrichment analysis of PD-1 correlated genes suggested biological process of T cell activation, regulation of lymphocyte activation, regula-tion of T cell activaregula-tion and leukocyte migraregula-tion. In addi-tion, PD-L1 correlated genes demonstrated enrichment including positive regulation of killing of cells of other organism, T cell apoptotic process, positive regulation of tolerance induction and cytolysis. The results of previ-ous studies were in accordance with the GO enrichment of PD-1/PD-L1 related genes in functional modulation of T cell. For instance, one study suggested that during the transition from DCIS to an invasive lesion, the host cytolytic T cells interacted with the tumor and destroy
p = 0.012 Hazard Ratio = 0.67 95% CI: 0.49 − 0.91
0.00 0.25 0.50 0.75 1.00
0 2000 4000 6000 8000 0
Time
Survival probabilit
y
PD1 group=high group=low
p = 0.313 Hazard Ratio = 0.85 95% CI: 0.62 − 1.17
0.00 0.25 0.50 0.75 1.00
2000 4000 6000 8000
Time
Survival probabilit
y
PDL1 group=high group=low
Fig. 5 Prognostic analysis of PD-1/PD-L1
Table 4 Cox regression for PD-1 and PD-L1
Adjust by stage and age
Gene HR (95% CI) P HR (95% CI) adjusted P adjusted
the tumor tissue, leading to an adaptive upregulation of PD-L1 and tumor protection against immune destruction [21]. PD-L1 is expressed by antigen-presenting cells and results in T cell inactivation by interaction with PD-1 on T-cells. It is therefore of great importance to clarify the biological process and pathways we identified for PD-1/ PDL1 related genes, by which immunotherapy with PD-1- and PD-L1-targeted monoclonal antibodies might dramatically change the therapeutic and prognostic land-scape for cancer.
Immune infiltration of breast cancer determine the immune activation of tumor microenvironment and is related with clinical outcome of patients. Accord-ing to the correlation analysis of PD-1 and PD-L1 with immune cell populations, PD-1 and PD-L1 were mainly related with Neutrophils and Fibroblasts. It has been reported that PD-1 protein expression significantly cor-related with higher TIL abundance, Ki-67 index, basal-like subtypes, and distant metastasis of triple-negative breast cancer (TNBC) [22]. The interaction of PD-1/ PD-L1 immune checkpoint with immune infiltration is a promising research direction in the future. The immune checkpoints of CD28, CD80, CD86, CTLA4, INPP5D, INPPL1, CD58, CD27, CD70, HLA-A, CD74 were also analyzed in relation to PD-1/PD-L1 expression. Finally, PD-1 was found to be mainly associated with HLA-A and INPP5D while PD-L1 correlated with CTLA4 and CD27. Cytotoxic T-lymphocyte-associated protein 4 (CTLA4) belongs to immunoglobulin superfamily and encodes a protein transmitting inhibitory signal to T cells, the antibody of which also demonstrated favorable outcome in clinical management [23]. The combination usage of PD-1/PD-L1 with these immune checkpoints might become novel therapeutic targets in the future [24].
Survival analysis of PD-1/PD-L1 expression status demonstrated that the expression of PD-1 was associ-ated favorable survival of breast cancer patients while PD-L1 did not suggest significant association with BC prognosis. In a study of 195 triple-negative breast cancer individuals, PD-1 was found to be significantly related with better disease free survival and overall survival. The results of this study also suggested that PD-1 pro-tein expression in TILs, but not PD-L1 in tumor cells, predicted better prognosis in TNBC [22]. Researchers demonstrated that high expression of PDL1 are asso-ciated with favorable clinical outcome in 127 primary breast cancer [25]. Another study of HER2+ invasive BC patients indicated a positive correlation of PD-L1 expres-sion and CD8+ T cells with favorable clinical outcomes [11]. On contrary, PD-L1 expression has been reported to be associated with worse prognosis of triple negative breast cancer patients, which counteract effect of tumor-infiltrating lymphocytes [10]. Response of BC patients
to neoadjuvant therapy and survival outcome indicated that PD-L1 predicted better rate of pathological complete response (pCR) [26]. In addition, PD-1/PD-L1 correlated genes such as CD5, CD74, CD96 and CD226 were also related with prognosis of BC patients. The combina-tion of these immune markers with PD-1/PD-L1 might improve the prediction and management of BC patients in the future. Until now, whether PD-1/PL-L1 predict prognosis in BC patients was still in debate. The spe-cific association of PD-1/PD-L1 with BC prognosis still required further large-scale investigations to confirm, which would benefit the potential of PD-1/PD-L1 as prognostic biomarker.
Conclusion
In this study, we reported the expression status of PD-1 and PD-L1 in different subtypes of breast cancer. The PD-1/PDL1 correlated gene profiles were described, the enrichment analysis of which focus on biological pro-cess including T cell activation, lymphocyte activation, leukocyte migration, T cell apoptotic process, tolerance induction and cytolysis. PD-1/PD-L1 expression also demonstrated relation with immune cells infiltration and multiple immune checkpoints. High PD-1 expression was associated with better survival of breast cancer patients.
Supplementary information
Supplementary information accompanies this paper at https ://doi. org/10.1186/s1293 5-019-0955-2.
Additional file 1: Table S1. Prognostic analysis of PD1/PDL1 co-express-ing genes.
Abbreviations
PD-1: programmed cell death 1; PD-L1: programmed death-ligand 1; BC: breast cancer; ER: estrogen receptor; PR: progesterone receptor; HER2: epidermal growth factor receptor 2; TILs: tumor-infiltrating lymphocytes; TPM: transcripts per million reads; WGCNA: weighted correlation network analysis; MAD: median absolute deviation; GO: Gene Ontology; Monocytic lineage: cells originating from monocytes; TNBC: triple-negative breast cancer; CTLA4: cytotoxic T-lymphocyte-associated protein 4; pCR: pathological complete response.
Acknowledgements Not applicable.
Authors’ contributions
CJ: analyze the data and write the paper. SC: repeated data analysis. NL: reviewed the manuscript. LJ: made the contribution to the data collection. TS: designed the work and reviewed the manuscript. All authors read and approved the final manuscript.
Funding
•fast, convenient online submission •
thorough peer review by experienced researchers in your field • rapid publication on acceptance
• support for research data, including large and complex data types •
gold Open Access which fosters wider collaboration and increased citations maximum visibility for your research: over 100M website views per year •
At BMC, research is always in progress.
Learn more biomedcentral.com/submissions
Ready to submit your research? Choose BMC and benefit from:
Availability of data and materials
The data that support the findings of this study are available from TCGA.
Ethics approval and consent to participate Not applicable.
Consent for publication Not applicable.
Competing interests
The authors declare that they have no competing interests.
Author details
1 Department of Medical Oncology, Cancer Hospital of China Medical Uni-versity, Liaoning Cancer Hospital and & Institute, 44 Xiaoheyan Road, Dadong District, Shenyang 110042, Liaoning, People’s Republic of China. 2 Institute of Translational Medicine, China Medical University, No.77 Puhe Road, Shen-yang 110001, Liaoning, People’s Republic of China.
Received: 30 June 2019 Accepted: 2 September 2019
References
1. Duijf PHG, Nanayakkara D, Nones K, Srihari S, Kalimutho M, Khanna KK. Mechanisms of genomic instability in breast cancer. Trends Mol Med. 2019;25(7):595–611.
2. Venema CM, Bense RD, Steenbruggen TG, Nienhuis HH, Qiu SQ, van Kruchten M, Brown M, Tamimi RM, Hospers GAP, Schroder CP, et al. Con-sideration of breast cancer subtype in targeting the androgen receptor. Pharmacol Ther. 2019;200:135–47.
3. Yamanouchi K, Kuba S, Eguchi S. Hormone receptor, human epidermal growth factor receptor-2, and Ki-67 status in primary breast cancer and corresponding recurrences or synchronous axillary lymph node metastases. Surg Today. 2019. https ://doi.org/10.1007/s0059 5-019-01831 -8.
4. Rani A, Stebbing J, Giamas G, Murphy J. Endocrine resistance in hormone receptor positive breast cancer-from mechanism to therapy. Front Endo-crinol. 2019;10:245.
5. Ji X, Lu Y, Tian H, Meng X, Wei M, Cho WC. Chemoresistance mechanisms of breast cancer and their countermeasures. Biomed Pharmacother. 2019;114:108800.
6. Pernas S, Tolaney SM. HER2-positive breast cancer: new thera-peutic frontiers and overcoming resistance. Ther Adv Med Oncol. 2019;11:1758835919833519.
7. Ghahremanloo A, Soltani A, Modaresi SMS, Hashemy SI. Recent advances in the clinical development of immune checkpoint blockade therapy. Cell Oncol (Dordrecht). 2019. https ://doi.org/10.1007/s1340 2-019-00456 -w. 8. Yasunaga M. Antibody Therapeutics and Immunoregulation in Cancer and
Autoimmune Disease. Semin Cancer Biol. 2019. https ://doi.org/10.1016/j. semca ncer.2019.06.001.
9. Havel JJ, Chowell D, Chan TA. The evolving landscape of biomarkers for checkpoint inhibitor immunotherapy. Nat Rev Cancer. 2019;19(3):133–50. 10. Zhu X, Zhang Q, Wang D, Liu C, Han B, Yang JM. Expression of PD-L1
attenuates the positive impacts of high-level tumor-infiltrating lympho-cytes on prognosis of triple-negative breast cancer. Cancer Biol Ther. 2019;20(8):1105–12.
11. Hou Y, Nitta H, Wei L, Banks PM, Lustberg M, Wesolowski R, Ramaswamy B, Parwani AV, Li Z. PD-L1 expression and CD8-positive T cells are associated with favorable survival in HER2-positive invasive breast cancer. Breast J. 2018;24(6):911–9.
12. Noske A, Mobus V, Weber K, Schmatloch S, Weichert W, Kohne CH, Solbach C, Heppner B, Steiger K, Muller V, et al. Relevance of tumour-infiltrating lymphocytes, PD-1 and PD-L1 in patients with high-risk, nodal-metastasised breast cancer of the German Adjuvant Intergroup Node-positive study. Eur J Cancer (Oxford, England: 1990). 2019;114:76–88.
13. Ontology CG. The gene ontology (GO) project in 2006. Nucleic Acids Res. 2006;34(Database issue):D322–6.
14. Garnier L, Gkountidi AO, Hugues S. Tumor-associated lymphatic vessel features and immunomodulatory functions. Front Immunol. 2019;10:720. 15. Singh S, Chakrabarti R. Consequences of EMT-driven changes in the
immune microenvironment of breast cancer and therapeutic response of cancer cells. J Clin Med. 2019;8(5):642.
16. Wu L, Saxena S, Awaji M, Singh RK. Tumor-associated neutrophils in cancer: going pro. Cancers. 2019;11(4):564.
17. Longo V, Brunetti O, Azzariti A, Galetta D, Nardulli P, Leonetti F, Silvestris N. Strategies to improve cancer immune checkpoint inhibitors efficacy, other than abscopal effect: a systematic review. Cancers. 2019;11(4):539. 18. Force J, Leal JHS, McArthur HL. Checkpoint blockade strategies in the
treat-ment of breast cancer: where we are and where we are heading. Curr Treat Options Oncol. 2019;20(4):35.
19. O’Donnell JS, Long GV, Scolyer RA, Teng MW, Smyth MJ. Resistance to PD1/ PDL1 checkpoint inhibition. Cancer Treat Rev. 2017;52:71–81.
20. Constantinidou A, Alifieris C, Trafalis DT. Targeting programmed cell death -1 (PD-1) and ligand (PD-L1): a new era in cancer active immunotherapy. Pharmacol Ther. 2019;194:84–106.
21. Lv S, Wang S, Qiao G, Wang X, Zhou X, Yan F, Li Y, Wang S, Morse MA, Hobeika A, et al. Functional CD3(+)CD8(+)PD1(-) T cell accumulation and PD-L1 expression increases during tumor invasion in DCIS of the breast. Clin Breast Cancer. 2019. https ://doi.org/10.1016/j.clbc.2019.04.001.
22. Ren X, Wu H, Lu J, Zhang Y, Luo Y, Xu Q, Shen S, Liang Z. PD1 protein expression in tumor infiltrated lymphocytes rather than PDL1 in tumor cells predicts survival in triple-negative breast cancer. Cancer Biol Ther. 2018;19(5):373–80.
23. Ha D, Tanaka A, Kibayashi T, Tanemura A, Sugiyama D, Wing JB, Lim EL, Teng KWW, Adeegbe D, Newell EW, et al. Differential control of human Treg and effector T cells in tumor immunity by Fc-engineered anti-CTLA-4 antibody. Proc Natl Acad Sci USA. 2019;116(2):609–18.
24. Rotte A. Combination of CTLA-4 and PD-1 blockers for treatment of cancer. J Exp Clin Cancer Res. 2019;38(1):255.
25. Uhercik M, Sanders AJ, Owen S, Davies EL, Sharma AK, Jiang WG, Mokbel K. Clinical significance of PD1 and PDL1 in human breast cancer. Anticancer Res. 2017;37(8):4249–54.
26. Wu Z, Zhang L, Peng J, Xu S, Zhou L, Lin Y, Wang Y, Lu J, Yin W, Lu J. Predictive and prognostic value of PDL1 protein expression in breast cancer patients in neoadjuvant setting. Cancer Biol Ther. 2019;20(6):941–7.
Publisher’s Note