Test and evaluation method for endurance performance of electric
multi-rotors spraying drones
Rui Ming
1,2,3,
Zhiyan Zhou
1,2,3*,
Xiwen Luo
1,2,3,
Yubin Lan
1,2,3,
Xingang He
1,2,3,
Cancan Song
1,2,3,
Rui Jiang
1,2,3,
Luhong Tian
1,2,3,
Shahbaz Gul Hassan
1,2,3(1. College of Engineering, South China Agricultural University / Guangdong Engineering Research Center for Agricultural Aviation Application (ERCAAA), Guangzhou 510642, China; 2. National Joint Research Center for Precision Agricultural Aviation Application
Technology, Guangzhou 510642, China; 3. Key Laboratory of Key Technology on Agricultural Machine and Equipment (South China Agricultural University), Ministry of Education, Guangzhou 510642, China)
Abstract: The endurance performance (EP) of electric multi-rotors spraying drones (EMSDs) is a key technical indicator that ensures the completion of tasks and improves their usefulness. To improve the EP of current EMSD, a test system was designed to determine the EP based on the EMSD test platform, and the performance evaluation method was studied. Firstly, a test model was established to determine the equivalent energy dissipation using the performance-testing platform of the EMSD. Secondly, a multisensory test system was constructed. An attitude sensor, high-power DC power supply, infrared thermal imager, and serial port server were selected. The mounting fixture was designed to meet the universal mounting requirements of drone. In addition, the software LabVIEW was employed to program the code for the controller and the host computer, where functions such as data collection, data processing, communication, and graphical user interface (GUI), were performed reliably in real time. Thirdly, the test method was explored by considering factors such as the power consumption, thermal efficiency ratio, and unit load power consumption rate. In particular, a comprehensive index method and expert consultation weight method were used to evaluate the EP of the EMSD with multiple indexes. Finally, a systematic real-machine test was carried out on the three types of drones that are currently widely used in the market. The results verified the effectiveness and feasibility of the proposed method, which was employed to test and evaluate the EP based on the EMSD performance testing platform. At the same time, it can provide a reference for the development of the EMSD.
Keywords: agricultural aviation, multi-rotors spraying drone, endurance performance, assessment method, virtual instrument
DOI: 10.25165/j.ijabe.20191202.4348
Citation: Ming R, Zhou Z Y, Luo X W, Lan Y B, He X G, Song C C, et al. Test and evaluation method for endurance performance of electric multi-rotors spraying drones. Int J Agric & Biol Eng, 2019; 12(2): 18–28.
1 Introduction
Agricultural aviation is an important part of modern agriculture and is considered an important symbol that reflects the degree of agricultural modernization[1,2]. In China, the development of agricultural aviation began in 1951. After several decades, agricultural aviation has become an important technology to realize agricultural mechanization and modernization[3]. Presently, there is much interest in the research, development, and application of
Received date: 2018-04-24 Accepted date: 2018-09-19
Biographies:Rui Ming, Master candidate, research interests: agricultural aviation, Email: [email protected]; Xiwen Luo, Professor, research interests: agricultural equipment, precision agriculture and agricultural aviation, Email: [email protected]; Yubin Lan, Professor, research interests: precision agriculture and agricultural aviation, Email: [email protected]; Xingang He, Master candidate, research interests: agricultural aviation, Email: [email protected]; Cancan Song, Master candidate, research interests: precision agriculture and agricultural aviation, Email: [email protected];
Luhong Tian, Master candidate, research interests: bionic electronic nose, nondestructive monitor, Email: [email protected]; Rui Jiang, PhD candidate, research interests: precision agriculture and agricultural aviation, Email: [email protected]; Shahbaz Gul Hassan, PhD, research interests: sensor design and image analysis, Email: [email protected].
*Corresponding author: Zhiyan Zhou, Professor, research interests: agricultural aviation. College of Engineering, South China Agricultural University, Guangzhou 510642, China. Tel: +86-13560026139, Email: [email protected].
key agricultural aviation technology in China. The type and number of EMSDs are rapidly increasing[4]. At the same time, because the Chinese agricultural aviation industry has not yet established a complete standardization system, there are inconsistencies with respect to the quality of existing EMSDs in China[5,6].
EP is one of the key technical indicators considered by the EMSD to ensure the completion of job tasks and improve the quality of operations[7]. EP refers to the ability of a drone to fly under the influence of its flying speed, flight trajectory, payload, and other factors[8]. For the EMSD, the EP directly affects the spray area, the quality of the spray operations, and the labor intensity required by spray personnel. Therefore, the effective testing and evaluation of the EP can guide the future development of the EMSD.
life. Xiong et al.[13] introduced the temperature-compensation coefficient and weighting coefficient in the lithium battery charge calculation, and provided a prediction method and calculation model to determine the remaining battery life of the drone. Although some methods have been used to estimate and optimize the drone's EP to some extent, none of them have effectively tested and reasonably evaluated the drone’s EP. To the best of our knowledge, in other countries, research on the EP test and evaluation method of drone is also in the primary stage. Alessandro et al.[14] tested the drone's battery life by analyzing the power efficiency and output torque of the drone motor. Joh et al.[15] performed a reverse-engineering method analysis and propeller performance analysis based on medium- and high-altitude long-range drones to investigate the life-times of drones. Donateo et al.[16] used simulation software to perform an in-depth analysis of all sub-systems during drone flight, and presented real-time forecasts of the drone charge-consumption model and battery life. At the same time, foreign drone companies have done relevant tests on the EP of drone. POWER4FLIGHT fixed the drone motor on the test bench, loaded the predetermined load and working temperature, issued different speed commands to the motor, detected the performance change of the motor and component failure, and determined the EP of the drone. Rotron Power MD conducted simulated flight tests on the motor under different environmental factors to test its endurance. Compared with the research on the domestic EP of drones, there is an increasing understanding of the theoretical depth and actual detection abroad. However, other researchers focus only on two aspects of the drone, from the power supply system and exterior structure, to optimize the drone endurance; meanwhile, the entire test process is complex, and it is difficult to realize an accurate test, so it is difficult to make a reasonable evaluation of the drone’s endurance.
There are two main ways to test the EP reported in the research papers before. The first one is to analyze the state of charge of the battery and establish an estimation model of the endurance time. Although this method can estimate the endurance, it is due to the drone battery. Internal instability makes the results less accurate. The second one is to simulate the mechanical structure of the EMSD and give the corresponding life time model. Since the models of each type of EMSD are different, such methods can only be detected for individual models, and EMSD cannot be detected synchronously. In addition, there is a relatively simple test method for EP in some test standards in China[17]. By using this method, the drone can hover until low battery alarm and the battery life can be obtained. The limitation of this method is mainly that the actual flight situation of the drone during operation is not considered, and the EP of the drone cannot be accurately tested. Therefore, based on the existing research results, this paper analyzes the existing drone life time calculation model. The power consumption, thermal efficiency ratio, and unit load power consumption rate of the drone motor per unit time were introduced, and the actual flight operation status of the EMSD is simulated. Exploring the EP test of the EMSD based on the combined EMSD performance test platform. And based on the multi-index evaluation method, this paper evaluates the EP of the EMSD, analyzes the test principle, builds the test system and conducts experimental research, providing a new and effective means for testing and evaluating the EP of EMSD.
2 Test principles
There are many factors that affect a drone's endurance[18].
Combined with the actual operation of the EMSD, the main factors that affect the performance of the drone are the power consumption of the motor in flight, the flight state, and the mounting load.
2.1 Establishing mathematical model of EP
The duration of an electric drone is: dc m prop e
rep
Q η η η
t p
= (1)
where, Qdc is the battery energy (capacity), A·h; ηm is the motor efficiency in cruising condition; ηprop is the propeller efficiency; ηe is the electronic governor efficiency, and prep is the power of the drone to fly horizontally during cruising, J/s.
The calculation formula for the power of flat flight in a cruise state is:
rep
W p
t
= (2) where, W is the mechanical energy, J/s.
The calculation formula for the efficiency of a motor in cruise conditions is:
ηm=ηmean·m (3) where, ηmean is the motor unit efficiency in cruise mode; and m is the drug load of drone, kg.
The calculation formula of the motor consumption power is:
W=UIt (4) where, U is the motor consumption voltage, V; I is the motor consumption current, A; R is the electrical resistance, Ω; and t is the work time, s.
By combining Equations (1)-(4), the expression for the duration of the drone is as follows:
dc mean prop e
Q η η ηm t
UI
= (5) Owing to the use of a high-power DC power supply to power the drone, the energy capacity of the battery is Qdc=1. At the same time, because the rotors of the tested airplanes are all driven by electric motors, general empirical methods can be used to select the efficiency parameters, ηprop and ηe[19].
2.2 Mathematical Model for Evaluating Indicators
To directly reflect the actual EP of the drone, the parameters to be measured in Equation (5) are simplified, and Equation (6) is obtained after the parameters that are directly available are obtained.
A simplified expression for the drone life is: mean
s
η m
t
UI
⋅
∝= (6) where, U is the motor consumption voltage; I is the current of motor consumption.
By combining Equations (4) and (5), it can be determined that the drone life is inversely proportional to the overall power consumption of the drone; therefore, Equation (7) is obtained.
1 s
t UIt
∝= (7) As the current and voltage rise of the motor does not necessarily change linearly, the power rise data of the motor is integrated to obtain Equation (8).
0
t
W =
∫
UIdt (8) By combining Equations (6) and (7), the relationship between the battery life and power consumption is:0
1
s t
t
UIdt
∝=
Equation (6) shows that the motor unit efficiency is proportional to the product of the load weight during the battery life and cruise.
s mean
t ∝η ⋅m (10) The unit efficiency of the motor depends on the loss during its operation. The higher the loss, the lower the efficiency. Motor losses mainly include stator and rotor copper losses, iron losses, wind wear, and stray losses[20]. Because of the complex composition of the motor losses and the inability to achieve accurate measurements, the thermal efficiency ratio evaluation index is introduced. At the same time, because different EMSDs have different weights, the unit load power consumption rate evaluation index is introduced to judge the EP directly by the power. 2.2.1 Thermal efficiency ratio
The temperature of the EMSD brushless motor is one of the important performance indicators in motor design and operation. Temperature rise is also an important indicator of endurance detection. The less the temperature changes, the less the heat losses and the better the temperature rise characteristics become. Checking the performance of the motor by testing the temperature rise can ensure the normal operation of the motor, and can provide a reference for the design and selection of the EMSD motor.
This paper proposed a method to detect the average temperature rise of brushless motors using an infrared camera. During the motor test, the infrared temperature is used as the reference temperature, so that the temperature of the motor when the EMSD operates for 240 s under different test conditions can be taken. The thermal efficiency ratio is the ratio of total power to temperature rise for the test demand state of the model. The calculation formula is as follows:
e s
W ter
T T
=
− (11)
where, ter is thermal efficiency ratio of multi-rotor EMSD; Te is infrared temperature at the end of the brushless motor; Ts is reference infrared temperature when the brushless motor start to work.
2.2.2 Unit load power consumption rate
The unit-load power consumption rate is the percentage of the power consumed per unit load that the drone carries with the airborne drone. The higher of the unit load power consumption rate, the greater is the power needed to increase the same amount of load. Therefore, as the unit load utilization increases, the drone’s EP is reduced. The formula is given as follows:
The calculation of the utilization rate of the payload is as
follows:
0
0
x p
p p U
p
−
= (12)
where, px is the average power at load x, and p0 is the average power without load conditions.
The unit load utilization is calculated as follows: p
u
U U
m
= (13)
3 Introduction of test system
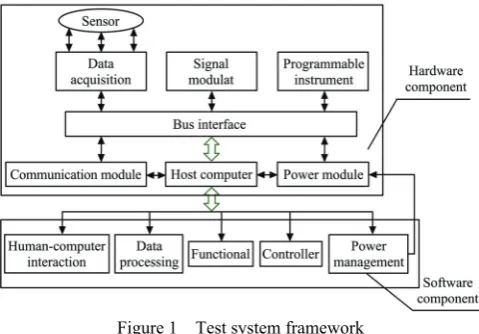
Based on the functional requirements and reliability requirements of the test system, an EMSD performance testing system was constructed based on the EMSD performance test platform, as shown in Figure 1. The main sensor equipment and information technology indicators are shown in Table 1.
Figure 1 Test system framework
3.1 Hardware architecture
The test system is mainly composed of hardware and software components. The hardware part includes the EMSD performance detection platform, sensor group, high-power DC source, and portable computers. The EMSD performance test platform can test the limits for different types and different specifications of drones to ensure that drones are tested within a safe range. At the same time, the protection device in the platform can also protect the drone from being damaged during the limit test. The high-power DC source provides the voltage and current required by the drone for testing, thus reducing errors caused by battery problems. At the same time, the high-power DC source is part of the sensor group and can provide the current and voltage information of the drone during the test process.
Table 1 Performance parameters of main sensors and devices
Main equipment Manufacture Accuracy main data port Power supply form
DC power Xingli/70V-100A
Output voltage 0-70 V; Output current 0-100 A; index of stability < 0.3% + 10 mV
RS232 AC 220 V
Serial server Yutai/UT-6616C
16 serial ports, all kinds of serial devices can be used; With 10/100M adaptive Ethernet port, support manual settings; The serial port has a complete signal, including DCD, RXD, TXD, DTR, DSR, RTS, CTS, GND;
32 bit embedded 100 MB CPU, 8M RAM;
16 LAN ports AC 220 V
Posture sensor TELESKY/JY-901
Range: Acceleration ±16 g, angular velocity ±2000o/s, angle ±180o;
Test error: acceleration 0.01 g, angular velocity 0.05 o/s, angle 0.01o;
Measurement dimension: acceleration 3-dimensional, angular velocity 3-dimensional, magnetic field 3-dimensional, angle 3-dimensional;
Data transmission
module DC 3.3-5 V
Infrared camera FLIR/T1050sc
Thermal sensitivity (NETD) < 20 mK; Infrared detector 1024 × 768 pixels;
Spatial resolution /IFOV 0.47 mrad (standard lens);
Detector-type focal plane array (FPA), uncooled infrared detector
The attitude sensor provides flight attitude information during drone testing. The infrared camera provides information on the temperature of the motor during drone testing. The above information is collected in real time by the serial port server. The data sent by the device through the serial communication protocol is processed by the serial port server and sent to the portable computer for real-time processing, display, and report generation, as shown in Figure 2.
Figure 2 Hardware system framework
3.2 Software architecture
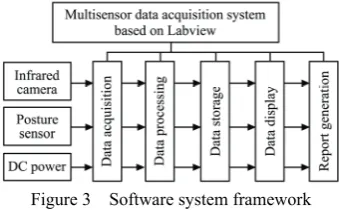
The software platform plays a very important role in the system. It shoulders the important task of controlling the hardware as well as analyzing and processing the data[21]. Whether the software platform design is correct and optimized depends largely on the ability of the system to run successfully as well as how efficient it is. The software system framework is shown in Figure 3.
The test software was developed based on NI Labview and consists of five parts: data acquisition, data processing, data storage, data display, and report generation. The system is based on the state-machine architecture design and uses several independent “While” loops to achieve serial data transmission and reception, data analysis, display, and recording, as well as human-computer interaction (HCI).
The software adopts technologies such as state machines, multi-threading, and interface callback to ensure that data collection, processing, communication, HCI, among others are performed independently and in parallel. The program has good real-time performance and reliability.
Figure 3 Software system framework
4 Test procedure and evaluation method
4.1 Test procedure
The flight mode of the drone to be tested is set to the GPS mode. By measuring the voltage and current information output from the high-power DC power supply in real time, the average output power of the drone can be indirectly obtained, and the power consumption can be continued. The temperature of the motor during the flight of the drone can be captured in real time using an infrared thermal imager, and the temperature-change information of the drone motor can be directly obtained. The specific test steps are as follows:
(1) Instrument equipment installation. The center position of the measured drone is calculated, and the attitude sensor is installed horizontally above the center position. The infrared camera is fixed on the top of the test bench, and the position of the camera lens is adjusted so that it can capture real-time temperature status information of the motor during flight. After selecting the appropriate angle and position, the test drone is placed in the test platform so that the three limit ropes on the test platform can be safely connected to the three arms of the test drone. The drone is avoided during the test process owing to changes in the angle of flight caused by the drone blade hitting the limit rope. The tightness of the limiting rope and the height of the constant damper are adjusted so that the test drone can be kept horizontally, which is conducive to taking off and landing during the test. The DC power supply is connected to the drone power system after the installation is complete, as shown in Figure 4.
1. Six-rotor drone 2. Limit wire rope 3. Damping shock absorber 4. Stop handing code 5. Slide block 6. Infrared camera 7. Slideway 8. Posture sensor 9. Lock catch 10. Portable laptops 11. Serial port server 12. DC power 13. Truss 14. Guide rail 15. Reel 16. Power line 17. Slide block 18. Stop handing code 19. Lower damping shock absorber 20. Bench
Figure 4 Hardware system installation diagram[22] (2) Equipment and equipment settings. The test software is opened, and the parameters of the attitude sensor are initialized. The thermal camera mode is set to automatically capture the maximum temperature point so that the focal length of the thermal imager is always on the drone motor during the imaging process. The voltage of the DC power supply is set to the rated voltage required by the drone and the maximum value of the current modulation.
(3) Operation method. After the drone is started, the remote controller is controlled so that the drone can be hovered smoothly, enabling it to perform simulated flight states with different angles. Then, the voltage, current, and temperature rise during the simulated flight are recorded. After the drone motor is cooled, the drone load is increased, the drone is started, and the remote controller is controlled so that the drone reaches a state of stable hovering, after which the flight state is simulated for different angles. The voltage, current, and temperature rise of the motor are recorded during the simulated flight. The above steps are repeated until the expected set experimental load is attained.
(4) Data processing. First, the voltage, current, and temperature of the motor obtained in step (3) are saved, and then data analysis and processing are performed in conjunction with their corresponding flight angles and loads.
4.2 Evaluation method
the market, for which the mass is mainly within the range of 8 kg to 15 kg, the three types of load of the main drone type, i.e., 0 kg, 4 kg, and 7 kg, respectively, are selected as the test loads, considering that the actual operating flight speed of the EMSD is within the range of 0–3m/s, and that the drone is controlled by the ground station when the drone is to be measured. When the speed reaches 3 m/s, the maximum pitch angle does not exceed 15°. Therefore, 0°, 5°, 10°, and 15° are selected as the pitch angles of the test to simulate the real-time status of the drone operation process.
Based on the above test load and test angle, the DC power supply voltage is set as the rated input voltage of the drone, the current is the maximum output current of the DC power supply, and the power mode is set to the constant voltage and steady current mode. For the test drone, different loads (0 kg, 4 kg, and 7 kg) were added in order, and then the flights were performed at different angles (θ = 0°, 5°, 10°, and 15°). The voltage currents UMθ, IMθ, which correspond to the respective consumption and
temperature-rise information of the drone motor are recorded.
5 Real machine tests
5.1 Introduction of tested drone types
The drone types that were tested are selected from the three EMSDs that are currently widely used in the market. The specific performance parameters are shown in Table 2.
Table 2 Main performance index of drone
Main parameter Type I Type II Type III
Number of propellers 4 6 8
Propeller size/mm 762 550 533
Drug loading/L 10 16 10
Overall machine weight/kg 8.52 15.4 14.5
5.2 Analysis and evaluation of test data
Using the preceding design scheme, three types were tested, and data were collected. The thermal efficiency ratio and unit load power consumption rate were analyzed and evaluated for each of the three types. The results of the analysis are as follows. 5.2.1 Power consumption calculation
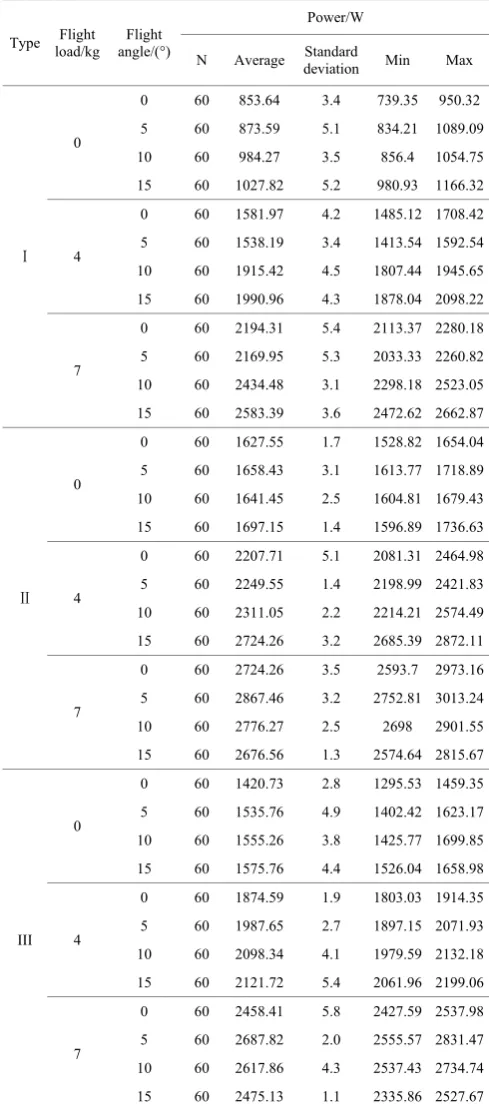
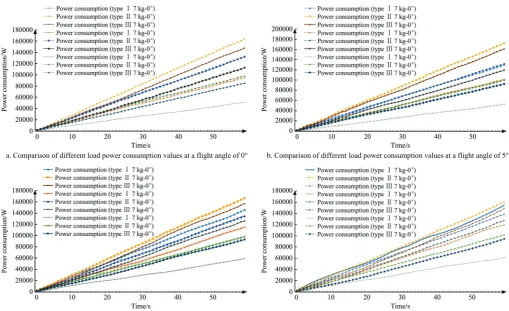
Statistical analysis of power data. The statistical results are shown in Table 3. Figure 5 shows the power consumption of three kinds of EMSD within 1 min at 0°, 5°, 10°, and 15°, respectively. During the drone test process, the voltage and current changes in the take-off and landing phase are very large. Therefore, during the data analysis, the selected data is for the drone flying to the preset posture condition, as well as the 1 min data for a smooth flight.
As can be seen from Figure 5, the power consumption of the three types is basically in a linear growth state in 1 min. At the same time, the power consumption of Type II is greater than those of Type I and Type III for any flight angle and flight load. Compared to Type I and Type III, the power consumption of Type III is greater than that of Type I at low loads. As the load increases and the angle increases, the difference between the power consumption values of Type I and Type III gradually decreases. During the first 15s, during a phase such as with a load of 4 kg and 7 kg, and with a flight angle of 10°, the power consumption values of Type III and Type I are 33155.12 W and 35756.26 W, respectively. The power consumption of Type I at this time is
greater than that of Type III. When the load weight is 7 kg and the flight angle is 15°, the power consumption of Type I in 1 min is greater than that of Type III. The cumulative power consumption of Type I is 155,003.12 W, and that of Type III is 148,508.02 W. Therefore, from the test results of the three types, the drone power consumption will change with different growth rates as the drone load and angle of flight increase. Under low angle and low load conditions, the power consumption relationship for the three types is given by II > III > I, but as the flight load and flight angle increase, the power consumption relationship of the three types become: II > I> III.
Table 3 Mean power for different types and conditions
Type Flight load/kg
Flight angle/(°)
Power/W N Average Standard
deviation Min Max
Ⅰ
0
0 60 853.64 3.4 739.35 950.32 5 60 873.59 5.1 834.21 1089.09 10 60 984.27 3.5 856.4 1054.75 15 60 1027.82 5.2 980.93 1166.32
4
0 60 1581.97 4.2 1485.12 1708.42 5 60 1538.19 3.4 1413.54 1592.54 10 60 1915.42 4.5 1807.44 1945.65 15 60 1990.96 4.3 1878.04 2098.22
7
0 60 2194.31 5.4 2113.37 2280.18 5 60 2169.95 5.3 2033.33 2260.82 10 60 2434.48 3.1 2298.18 2523.05 15 60 2583.39 3.6 2472.62 2662.87
Ⅱ
0
0 60 1627.55 1.7 1528.82 1654.04 5 60 1658.43 3.1 1613.77 1718.89 10 60 1641.45 2.5 1604.81 1679.43 15 60 1697.15 1.4 1596.89 1736.63
4
0 60 2207.71 5.1 2081.31 2464.98 5 60 2249.55 1.4 2198.99 2421.83 10 60 2311.05 2.2 2214.21 2574.49 15 60 2724.26 3.2 2685.39 2872.11
7
0 60 2724.26 3.5 2593.7 2973.16 5 60 2867.46 3.2 2752.81 3013.24 10 60 2776.27 2.5 2698 2901.55 15 60 2676.56 1.3 2574.64 2815.67
III 0
0 60 1420.73 2.8 1295.53 1459.35 5 60 1535.76 4.9 1402.42 1623.17 10 60 1555.26 3.8 1425.77 1699.85 15 60 1575.76 4.4 1526.04 1658.98
4
0 60 1874.59 1.9 1803.03 1914.35 5 60 1987.65 2.7 1897.15 2071.93 10 60 2098.34 4.1 1979.59 2132.18 15 60 2121.72 5.4 2061.96 2199.06
7
a. Comparison of different load power consumption values at a flight angle of 0° b. Comparison of different load power consumption values at a flight angle of 5°
c. Comparison of different load power consumption values at a flight angle of 10° d. Comparison of different load power consumption values at a flight angle of 15° Figure 5 Power consumption per minute
5.2.2 Comparison of motor temperature effects
According to the experimental design scheme, the experimental analysis of the temperature changes of the three types under different loads and different flight angles was conducted. Owing to the inconvenience of the installation of the thermal imager and the limited height of the installation height, the data acquisition, and analysis of the temperature change of the two motors in the same orientation of the three types were performed. Type I tested at an ambient temperature of 23.7°C, a humidity of 45%, and an illumination intensity of 4050 lx. The average motor starting temperature was 22.3°C. Type II had a test ambient temperature of 25.8°C, humidity of 45%, the illumination intensity of 4050 lx, and a starting motor average temperature of 23.7°C. Type III was tested at an ambient temperature of 21.5°C, humidity of 53%, the illumination intensity of 2040 lx, and a starting motor average temperature of 20.6°C. As the motor run time increases, the motor temperature changes gradually. During the drone flight, to maintain the overall motion of the drone, the speed of each motor will be different, so the temperature change of each motor is not the same. At the same time, because the motor core in operation is in the alternating magnetic field to generate iron loss, etc., which results in a greater temperature rise at the motor core, the center position of the motor has a lower temperature and the edge temperature is higher. Figure 3 shows the motor temperature conditions for the three types with a load of 0 kg and a flight angle of 5°. Figure 6a shows the overall temperature distribution of the motor along the longitudinal pixels of the image. From the figure, it can be seen that the motor center has a lower temperature and a higher edge temperature. Figure 6b shows the count statistics of each temperature in the motor. The temperature in the figure is mostly concentrated within a certain range, but there are still other minor temperature distributions. Figure 6c shows static data obtained for selected areas, including the average temperature,
center temperature, maximum temperature, and minimum temperature. It can be seen from the figure that the motor temperature of the three types varies greatly, and the distribution is not uniform. The maximum temperature difference between the three motors with the same motor reaches 6.1°. Therefore, a reasonable analysis of the motor-temperature data determines to a certain extent the correctness of the analysis results. It can be seen from Figure 6a that the temperature distribution of the motor is an inverted triangle. Therefore, if a single pixel is selected as the motor temperature for analysis, the data sample may be under-represented. Therefore, this experiment selects the center of the motor center and the radius of the motor as the radius of the area to draw a circular area similar to the size of the motor. The average temperature of all the temperatures in the area is calculated as the temperature of the motor, as shown in Figure 6d.
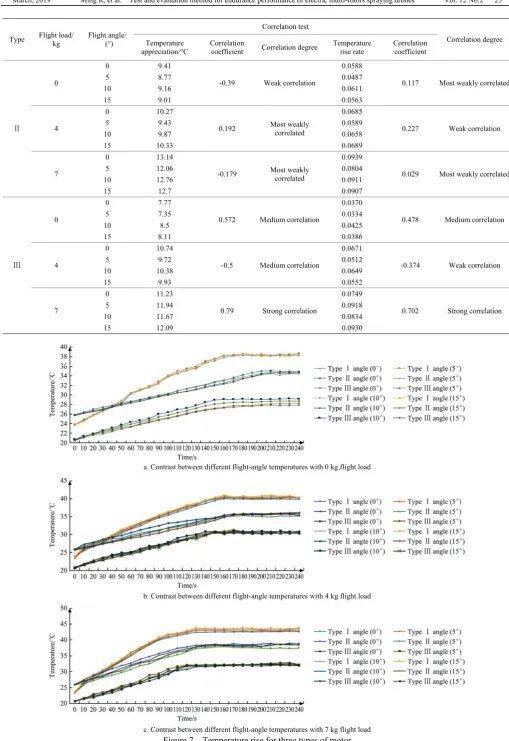
Table 4 shows the correlation between the change in the angle and the change of the motor temperature after the three types are in flight for 240 s. It can be seen from Table 4 that the correlation coefficient of temperature rise, temperature rise rate and angle of Type I and Type II is less than 0.4. Therefore, the degree of correlation between temperature rise, temperature rise rate, and angle of Type I and Type II is a weak correlation. For Type III, only when the load is 7 kg, the correlation coefficient of temperature rise, temperature rise rate and angle are greater than 0.8, and the correlation shows a strong correlation. The correlation coefficient of temperature rise, the temperature rise rate and angle of Type III under other test conditions is less than 0.8, and the degree of correlation is moderate or weakly related. Therefore, during the analysis of the test temperature, the influence of the angle on the temperature rise may not be presently considered.
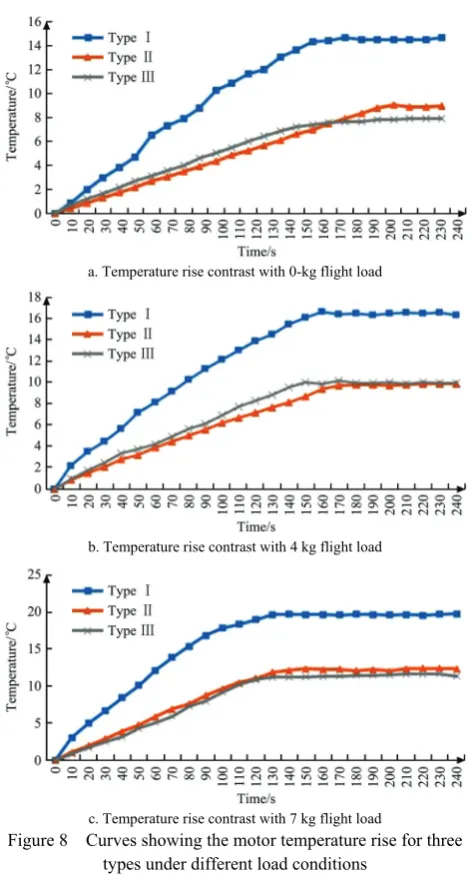
increases, the temperature of the motor gradually increases, and when the motor heats up, and the heat dissipation reaches an equilibrium state, the temperature eventually stabilizes at a given level.
When the load is 0 kg and 4 kg, the time sequence for when the motor reaches the maximum temperature is Type III (150 s, 140 s) > Type I (170 s, 160 s) > Type II (210 s, 170 s).
When the load is 7 kg, the motor reaches the maximum
temperature in the order of Type III (110 s) > Type II (120 s) > Type I (130 s). The maximum temperature is reached at different times, and the power consumed within 240 s will be different. At the same time, because of the different starting temperatures, there will be some differences in the modeling process. Therefore, in this experiment, the temperature rise and power consumption of the motor were studied by taking the initial temperature of the motor as the reference zero-point temperature.
a. The temperature distribution of motor
b. Statistics of the number of temperature pixels
c. Static data display
d. Selection method of measurement model
Figure 6 Temperature distribution of three types of motor
Table 4 Correlation between temperature changes in different types and load angles
Type Flight load/ kg Flight angle/ (°)
Correlation test
Correlation degree Temperature
appreciation/°C
Correlation
coefficient Correlation degree
Temperature rise rate
Correlation coefficient
Ⅰ
0
0 14.56
0.143 Most weakly correlated
0.0633
0.248 Weak correlation
5 15.01 0.0834
10 14.8 0.0617
15 14.7 0.0774
4
0 16.0
0.2 Most weakly correlated
0.1000
-0.227 Weak correlation
5 17.01 0.1134
10 16.7 0.1044
15 16.33 0.1021
7
0 19.76
0.329 Weak correlation
0.0988
0.31 Weak correlation
5 19.39 0.0923
10 20.41 0.1134
Type Flight load/ kg
Flight angle/ (°)
Correlation test
Correlation degree Temperature
appreciation/°C
Correlation
coefficient Correlation degree
Temperature rise rate
Correlation coefficient
Ⅱ
0
0 9.41
-0.39 Weak correlation
0.0588
0.117 Most weakly correlated
5 8.77 0.0487
10 9.16 0.0611
15 9.01 0.0563
4
0 10.27
0.192 Most weakly correlated
0.0685
0.227 Weak correlation
5 9.43 0.0589
10 9.87 0.0658
15 10.33 0.0689
7
0 13.14
-0.179 Most weakly correlated
0.0939
0.029 Most weakly correlated
5 12.06 0.0804
10 12.76 0.0911
15 12.7 0.0907
Ⅲ
0
0 7.77
0.572 Medium correlation
0.0370
0.478 Medium correlation
5 7.35 0.0334
10 8.5 0.0425
15 8.11 0.0386
4
0 10.74
-0.5 Medium correlation
0.0671
-0.374 Weak correlation
5 9.72 0.0512
10 10.38 0.0649
15 9.93 0.0552
7
0 11.23
0.79 Strong correlation
0.0749
0.702 Strong correlation
5 11.94 0.0918
10 11.67 0.0834
15 12.09 0.0930
a. Contrast between different flight-angle temperatures with 0 kg flight load
b. Contrast between different flight-angle temperatures with 4 kg flight load
Figure 8 shows the average value of each of the three types flying at four different angles. The starting temperature of the motor is used as the reference zero-point temperature to obtain a comparison of the temperature rise values of the motor. As can be seen from Figure 8, of the three loads, the temperature rise of Type I is greater than those of Type II and Type III, and the three temperatures increased by 14.6°C, 16.6°C, and 19.8°C, respectively. By comparing Type II and Type III, when the load is 0 kg, the motor temperature of Types II and III increased by 9.0°C and 7.9°C, respectively. However, Type II reaches the maximum temperature more slowly than Type III. When the load is 4 kg and 7 kg, the temperature increase of Type II and Type III remains basically the same. At 4 kg, Type II increased by 9.8°C and Type III increased by 9.9°C. At 7 kg, Type II increased by 12.4°C and Type III increased by 11.7°C. Because the maximum temperature is reached at different times and the same temperature is increased, the power consumption is not the same. Therefore, a regression analysis is performed on the temperature-rise curves of different loads of the three types.
a. Temperature rise contrast with 0-kg flight load
b. Temperature rise contrast with 4 kg flight load
c. Temperature rise contrast with 7 kg flight load
Figure 8 Curves showing the motor temperature rise for three types under different load conditions
5.2.3 Unit load power consumption rate
Figure 9 shows the unit load utilization of the three drones under different flight conditions. As can be seen from Figure 9, under any flight condition, the relative unit load utilization ratios of the three types are in the order Type I > Type II > Type III. The
maximum unit load utilization values of the three types were 23.6%, 10.4%, and 8.8%, respectively, and the minimum unit load utilization values were 19.1%, 8.1%, and 4.1%, respectively.
Figure 9 Unit load utilization 5.2.4 Thermal efficiency ratio comparison
Table 5 shows the thermal efficiency ratios of the three models under different load conditions. It can be seen from the table that the heat efficiency ratio of type I is smaller than that of the other two types under three load conditions, which are 3841.8 (W/°C), 6349.3 (W/°C), and 7107.7 (W/°C) respectively. The thermal efficiency of Type II is lower than type III with no load, while in other loads, the thermal efficiency ratio of Type II is higher than that of Type III. Therefore, the final average thermal efficiency ratio is in the order of Type II>Type III>Type I, and the best in Type II is 7210.7 (W/°C) larger than the worst in type III.
Table 5 Comparison of thermal efficiency ratios of different types
Type Load/kg power/WTotal Temperature rise
Thermal efficiency ratio Total value Average value
Ⅰ
0 56089.8 14.6 3841.8
5766.2
4 105398.1 16.6 6349.3
7 140732 19.8 7107.7
Ⅱ
0 99368.7 9.0 11041.0
12976.9
4 142388.6 9.8 14529.4
7 165668.3 12.4 13360.3
Ⅲ
0 91312.65 7.9 11558.6
12310.6
4 121234.5 9.9 12245.9
7 153588.3 11.7 13127.2
5.2.5 Multi-index comprehensive evaluation research
consultation weight method was used as the method of determining the weight coefficient.
The comprehensive index method is simple in principle, requires no complicated operations, and is easy to operate[32]. The main operation steps are mainly to select appropriate indicators, determine the weights, index the indicators according to the formula. Then, for comparison, index syntheses are performed according to the method of multiplication of similar indexes and the index of heterogeneous indexes to obtain the index I value. The calculation is as follows:
Index formula of high-level indicator:
Yj=Xj/Mj (15) Index formula of low-optimal indicators:
Yj=Mj/Xj (16) Final index calculation formula:
1 1
n m
ij i j
I=
∑ ∏
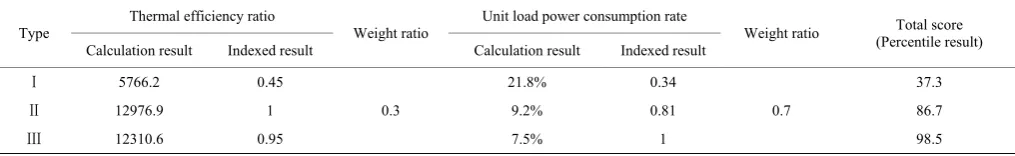
= =Y (17) where, Xj is the tested actual indicator value; Mj is the selected standard indicator value, and Yj is the calculated index.Therefore, during the process of comprehensive evaluation, the minimum value of the low-quality index is taken as the standard value, and the maximum value of the high-quality index is taken as the standard value. At the same time, the weights of the thermal efficiency ratio and unit load power consumption rate obtained by the expert consultation weighting method are 0.3 and 0.7, respectively. Combining Equations (15)-(17) with the weight coefficient, the evaluation index expressions of the three types are obtained as Equation (18), and the comprehensive evaluation data are as shown in Table 6.
Ii=0.3teri+0.7uui (18)
Table 6 Comprehensive evaluation form
Type Thermal efficiency ratio Weight ratio Unit load power consumption rate Weight ratio Total score (Percentile result) Calculation result Indexed result Calculation result Indexed result
Ⅰ 5766.2 0.45
0.3
21.8% 0.34 0.7
37.3
Ⅱ 12976.9 1 9.2% 0.81 86.7
Ⅲ 12310.6 0.95 7.5% 1 98.5
6 Conclusions
The evaluation of the EP of the EMSD is a key component of the EMSD inspection, and it is important for the improvement of its operation efficiency and operation quality[33]. Based on the above experimental analysis results, the following conclusions can be made:
(1) Three tests were performed on the three types from three perspectives: power consumption of the EMSDs per unit time, thermal efficiency ratio and unit load power consumption rate. From the test data analysis results, the power consumption of the three types regarding the power consumption per unit time is basically in a linear relationship, but the angle change and the load size are more obvious to determine its impact on power consumption. Under low-load and low-angle conditions, the power consumption of Type I is significantly lower than that of the other two drones. The main reason may be that the simple structure and light quality of type I which consumes less power during flight than the other two types. Type II and Type III are similar in structure weight, and so is the power consumption per unit time. Now that it is impossible to compare the EP through the power consumption per unit time, the comparison of the thermal efficiency ratio and the unit load power consumption rate may be necessary and effective. In thermal efficiency ratio, Type I's motor temperature increases faster than that of other two types, so its thermal efficiency is smaller than that of other two types. The main reason may be that the rated load of Type I is smaller than that of the other two types, and the number of rotors is also less compared with the other two types. The rated load of Type II is greater than that of Type III, but the motor temperature is basically maintained at the same change height. The possible reason is the influence of the motor number, and the difference in thermal efficiency between Type II with six rotors and Type III with eight rotors is only 666.3 W/°C. From the perspective of the unit load power consumption rate, under any condition, the unit load power consumption rate of type I is the largest, type II is the second, and type III is the smallest. The main reason may be that
type I is a drone type with a rated load of 8 L, consumes less when no load. At the same time, it can be seen from Table 3 that when the load increase to 4 kg, the increase in the average power consumption compared with the other two types has exceeded the average power consumption when no load. Therefore, the unit power consumption of type I is higher than that of the other two types. While the load consumption of type II and type III is not much different when the load is 4 kg, the power consumption rate of type II begins to appear to be significantly high than the power consumption rate of type III when the load is 7 kg. Combined with the power consumption rate, power consumption per unit time and thermal efficiency ratio, the EP of type III is better than that of type II, and type I is lowest.
(2) This paper proposes a new method for testing and evaluating EP of EMSD based on the drone performance test platform. The method avoids the influence of the battery on the EP, considers the influence of the posture of the plant protection drone on the EP, introduces more intuitive and fair data analysis results, analyzes the test principle, and constructs a virtual test system. And the feasibility of the endurance test method is verified by experiments.
(3) The EMSD EP test system based on the drone performance test platform was designed to provide an effective means for improving the design of the EMSD. At the same time, the system is based on a virtual instrument design with high scalability, and can be extended to other EMSD testing applications.
Acknowledgments
We acknowledge that this research work was financially supported by the Science and Technology Plan of Guangdong Province of China (Project No. 2014A020208103, 2015B020206003, 2017B090903007) and Innovative Research Team of Guangdong Province Agriculture Research System (2017LM2153) for funding this research. We also thank the anonymous reviewers for their critical comments and suggestions to improve the manuscript.
[References]
[1] Luo X W. Reflections on accelerating the development of China's agricultural aviation technology. Agricultural Technology and Equipment, 2014; 5: 7–15. (in Chinese)
[2] Meng Y H, Zhou G Q, Wu C B, Wang Z G, Xu X S. Discussion on the application and popularization of China's agricultural plant protection unmanned aerial vehicle. Chinese Journal of Plant Protection, 2014; S1: 33–39. (in Chinese)
[3] Zhou Z Y, Zang Y, Luo X W, Lan Y B, Xue X Y. Technology innovation development strategy on agricultural aviation industry for plant protection in China. Transactions of the CSAE, 2013; 29(24): 1–10. (in Chinese)
[4] Zhou Z Y, Ming R, Zang Y, He X G, Luo X W, Lan Y B. Development status and countermeasures of agricultural aviation in China. Transactions of the CSAE, 2017; 33(20): 1–13. (in Chinese)
[5] Guo Y W, Yuan H Z, He X K, Shao Z R. Analysis on the development and prospect of agricultural aviation protection in China. China Plant Protection, 2014; 34(10): 78–82. (in Chinese)
[6] Dong Y Z, Li J X, Shi Y T, Zhang Y S, Li D. Thoughts on the future development of plant protection UAV. Journal of Shaanxi Agricultural Sciences, 2016; 3: 119–121. (in Chinese)
[7] Yang Z X, Zhao S L, Sun Y, Zhou J L, Liu S M. Design and test of long endurance rotors for quad-rotor UAVs. Hong Kong, China, 2015; pp.410–416.
[8] Wang G, Hu Y, Song B F, Tan C. Optimal design and endurance estimation of propulsion system for electric-powered unmanned aerial vehicle. 2015; 8: 1834–1840. (in Chinese)
[9] Cong S Q, Wang C J, Jiang Y. Research on real-time estimation method for range and cruise duration of UAV. Journal of Astronautic Metrology and Measurement, 2012; 32(2): 62–65. (in Chinese)
[10] Liu F H, Ma X P. Research for improving the endurance performance of mini type electric-powered UAV. Flight Dynamics, 2010; 28(5): 13–15. (in Chinese)
[11] Liu S N, Li Q, Luo N Y, Jiang B. Real-time estimation of cruise duration for electric-powered micro-UAVs. Changsha, Hunan, China, 2014.6. (in Chinese)
[12] Zhang Y Q. Effect of rotor structure of four rotor on endurance. Science and Technology Innovation Herald, 2015; 30: 50–51. (in Chinese). [13] Xiong D, Wang B, Dai L H, Wang Q. Prediction method of UAV
inspection surplus cruise duration based on SOC. Chinese Journal of Power Sources, 2015; 39(1): 105–107. (in Chinese)
[14] Bosso A, Conficoni C, Tilli A. Multirotor UAV flight endurance and control: the drive perspective//IEEE Industrial Electronics Society, 2016; pp.1839–1845.
[15] Joh C. Reverse-engineering and analysis of performance for medium- altitude long endurance unmanned aerial vehicle. Journal of the Korean
Society Aeronautical and Space Sciences, 2016; 44(6): 520–529. [16] Donateo T, Ficarella A, Spedicato L, Arista A, Ferraro M. A new
approach to calculating endurance in electric flight and comparing fuel cells and batteries. APPLIED ENERGY, 2017; 187: 807–819.
[17] The Ministry of Agriculture of the People's Republic of China. Technical specification of quality evaluation for crop protection UAS, NY/T 3213–2018. (in Chinese)
[18] Jin J Y, Zhu Y, Zeng S T, Xia Q F. Research on the endurance of small multi - rotor UAVs. Computer Knowledge and Technology, 2017; 13(16): 197–199. (in Chinese).
[19] Stepaniak M J, Graas F V, De Haag M U. Design of an electric propulsion system for a quadrotor unmanned aerial vehicle, Journal of Aircraft, 2009; 46(3): 1050–1058.
[20] Yang G. Automatic test system for high efficiency motors. Master Dissertation. Harbin University of Science and Technology, 2005. (in Chinese)
[21] Zhang X L, Ding W J, Ge S X, Han P, Liu P F, Jin M. Test and evaluation method for parking brake performance of passenger vehicle based on dynamometer. Transactions of the CSAM, 2017(3): 361–367. (in Chinese)
[22] [22] Zang Y, He X G, Zhou Z Y, Ming R, Zang Y, Luo X W, Lan Y B. Comprehensive evaluation method for lifting characteristics of electric multi-rotor UAV for plant protection. Transaction of the CSAE, 2018; 34(14): 69–77. (in Chinese)
[23] Li P, Yu G Y. Review of multi index comprehensive evaluation method. Development & Innovation of Machinery & Electrical Products, 2009; 22(4): 24–25. (in Chinese)
[24] Yan J Y, Luo S L, Jia Q, Kuang J F, Yan H Y. Prediction and dynamic analyze of seasonal model of nosocomial infectious trend. Clinical Journal of Medical Officer, 2002; 1: 62–64. (in Chinese)
[25] Han Q X. Comprehensive evaluation of hospital infection by relative gap and method. Modern Preventive Medicine, 2002; 29(5): 643–644. (in Chinese)
[26] Luo X Q, Guo J S, Liu J, Cai Y, Liu G Q, Wang S Y. Application of fuzzy comprehensive appreciation method in appraising tender for electromechanical equipment. Guizhou Waterpower, 2006; 20(5): 68–72. (in Chinese)
[27] Feng N, Li M Q, Kou J S, Fang D Y. IT project risk assessment model based on ANN. Computer Engineering and Applications, 2006; 6: 24–26. (in Chinese)
[28] Ning B Q, Peng W S, Guo S Q, Shan Z P. Research on comprehensive evaluation of agricultural machinery based on dynamic combination weighting. Journal of Agricultural Mechanization Research, 2015; 7: 79–82. (in Chinese)
[29] Zhang Y J, Wu B, Wang Y, Shi L J, Li Z Z, Wu S. Determination of weight of evaluation index in space operation complexity model. Space Medicine and Medical Engineering, 2008; 21(3): 252–256. (in Chinese) [30] Li N, Zhao H J, Jia G R. Dimensional reduction method based on factor
analysis model for hyperspectral data. Journal of Image and Graphics, 2011; 16(11): 2030–2035. (in Chinese)
[31] Leng Y, Chen Y, Fu Q, Chen Z. Constructing empowerment method based on index independence. Statistics and Decision, 2016; 19: 9–11. (in Chinese)
[32] Wang H, Li C, Chen K, Xue M Q, Liang Q. Multi - index comprehensive evaluation method and choice of weight coefficient. Journal of Guangdong College of Pharmacy, 2007; 23(5): 583–589. (in Chinese) [33] Mir I, Maqsood A, Akhtar S. Optimization of dynamic soaring