RESEARCH ARTICLE
Observing populations and testing
predictions about genetic drift in a computer
simulation improves college students’
conceptual understanding
Rebecca M. Price
1*, Denise S. Pope
2, Joel K. Abraham
3, Susan Maruca
2and Eli Meir
2Abstract
Background: Evolution is a difficult subject for students, with well-documented confusion about natural selection,
tree thinking, and genetic drift among other topics. Here we investigate the effect of a simulation-based module about the conservation of black-footed ferrets, a module designed with pedagogical approaches that have been demonstrated to be effective, for teaching genetic drift. We compared performance on the Genetic Drift Inventory (GeDI) of students who completed the module and students who were in classes that used other methods for teach-ing genetic drift.
Results: Students in 19 courses using the simulation-based module improved their understanding of genetic drift
significantly after completing the Ferrets module, as measured by the GeDI. Students in five control courses actually performed significantly worse on the GeDI after instruction. The lower scores in the control courses were driven by a decrease in these students’ understanding of key concepts.
Conclusions: The Ferrets module appears to be an effective way to teach genetic drift. In the control courses,
stu-dents’ progress in understanding genetic drift may pass through a stage where their understanding of key concepts is worse than it was prior to instruction. However, students who learned genetic drift in courses that used the Ferrets module showed a more rapid increase in their understanding of key concepts related to genetic drift. This result sug-gests that the paths that students can take to move from novice to expert understanding may be more varied than was previously predicted.
Keywords: Computer simulation, Concept inventory, Genetic drift, Misconceptions, Undergraduate
© 2016 The Author(s). This article is distributed under the terms of the Creative Commons Attribution 4.0 International License (http://creativecommons.org/licenses/by/4.0/), which permits unrestricted use, distribution, and reproduction in any medium, provided you give appropriate credit to the original author(s) and the source, provide a link to the Creative Commons license, and indicate if changes were made.
Background
Students have well-documented problems with under-standing evolutionary concepts, including natural selec-tion (e.g., Gregory 2009), tree thinking (e.g. Baum et al. 2005; Meir et al. 2007; Perry et al. 2008) and genetic drift (Andrews et al. 2012). With genetic drift, in par-ticular, students struggle with the concept of random-ness (Garvin-Doxas and Klymkowsky 2008) and also often confuse it with other evolutionary processes, such
as mutation (Andrews et al. 2012). Because understand-ing genetic drift requires a sophisticated understandunderstand-ing of both genetics and evolution, it may only emerge later in a student’s biology education (Andrews et al. 2012). Price et al. (2014) developed the Genetic Drift Inventory (GeDI) as a tool to assess different instructional strategies for teaching genetic drift. This assessment is composed of a series of agree/disagree statements, each of which is associated with either a key concept required for a com-plete understanding or a misconception that often inter-feres with understanding of genetic drift.
The Genetic Drift and Bottlenecked Ferrets module (Herron et al. 2014) is a computer-based instructional
Open Access
*Correspondence: [email protected]
tool designed to teach genetic drift; it is built around a simulation of a black-footed ferret (Mustela nigripes) population. The module was developed with pedagogical approaches that have been demonstrated to be effective (e.g., American Association for the Advancement of Sci-ence 2011; NGSS Lead States 2013; Couch et al. 2015): students begin constructing their understanding of genetic drift by observing and recording data from simu-lations of how allele frequencies change in small popula-tions, draw inferences and construct explanations from their observations, challenge and build their understand-ing by makunderstand-ing and testunderstand-ing predictions about the conse-quences of genetic drift on populations, and ultimately apply their knowledge by creating a plan to reintroduce ferrets into wild populations while maintaining genetic diversity.
Computer simulations like the Ferrets module can be effective tools to enhance traditional instruction in sci-ence (reviewed in Rutten et al. 2012; Smetana and Bell 2012). Simulations allow students to visualize processes like genetic drift that occur over timescales scales that are difficult or impossible to observe directly, and also allow students to isolate and manipulate parameters that influence the outcome of the simulation, in order to bet-ter understand the many variables and their inbet-teractions (National Research Council 2011). Because they allow direct observation and investigation at timescales that generally are not feasible for students to investigate in nature, simulations can be particularly appropriate learn-ing tools for evolutionary phenomena (Perry et al. 2008; Bray Speth et al. 2009; Abraham et al. 2009; Abraham et al. 2012).
Because the Bottlenecked Ferrets module was designed independently from the GeDI, the module does not spe-cifically target all of the key concepts and misconcep-tions identified by Andrews et al. (2012) or tested in the GeDI (Price et al. 2014). This slight misalignment makes the GeDI a particularly powerful independent measure of the effectiveness of the module. Additionally, because the GeDI includes some concepts that the Ferrets module does not explicitly teach (Table 1), we are able to explore changes in student understanding of aspects of genetic drift that are not covered explicitly in the module.
Andrews et al. (2012) proposed a model for how stu-dents’ understanding of genetic drift emerges during instruction, with three stages that were identified from studying college students’ misconceptions about genetic drift. They defined misconceptions as understanding that is not scientifically accurate, and we follow that con-vention in this study as well (Crowther and Price 2014; Leonard et al. 2014). Students in Stage 1 start with a nov-ice understanding of both genetics and evolution, and they are struggling to use basic vocabulary correctly,
without indicating conceptual understanding. Students in this category are using terms like genetic and evolution vaguely, e.g., “Genetic drift [is] when it’s the same species but different characteristic” (Andrews et al. 2012: 252). Students in Stage 2 are beginning to recognize that there are different mechanisms of evolution, but they often confuse these mechanisms, frequently trying to explain everything as natural selection, e.g., “Genetic drift occurs to eliminate the less adaptable trait that is not well suit-able to the environment” (Andrews et al. 2012: 252). Stage 3 describes the misconceptions that students have when they are developing their conceptual understand-ing of genetic drift, e.g., that genetic drift only occurs in small populations. Andrews et al. (2012) suggested that students moved through these three stages sequentially.
In this study we used the GeDI to evaluate the effec-tiveness of the Genetic Drift and Bottlenecked Ferrets module (Herron et al. 2014) at teaching genetic drift. We compared pre- and post-instruction GeDI scores of stu-dents who completed the Ferrets module to GeDI scores of students who learned genetic drift through lectures and/or other activities introduced by their instructors. We used the results to reinterpret the three stages of learning genetic drift proposed by Andrews et al. (2012).
Methods
Genetic Drift and Bottlenecked Ferrets module
The SimBio Virtual Labs® module Genetic Drift and Bottlenecked Ferrets (Herron et al. 2014) is a learning module built around a series of interactive simulations. Instructions, tables for recording data, and questions are in an accompanying workbook. The module is designed to demonstrate and explore the causes and consequences of genetic drift, including conservation implications, using the example of endangered black-footed ferrets (Mustela nigripes). The interactive simulation models a population of ferrets that vary in coat color, a fictitious single-locus trait with two selectively neutral alleles.
genetic diversity of the newly founded wild population. They can design reserves of various sizes, with or with-out connecting corridors, and run simulations to assess
their designs using ferrets of known genotypes from a zoo. Readers wishing to see the Genetic Drift module can request a review copy from [email protected].
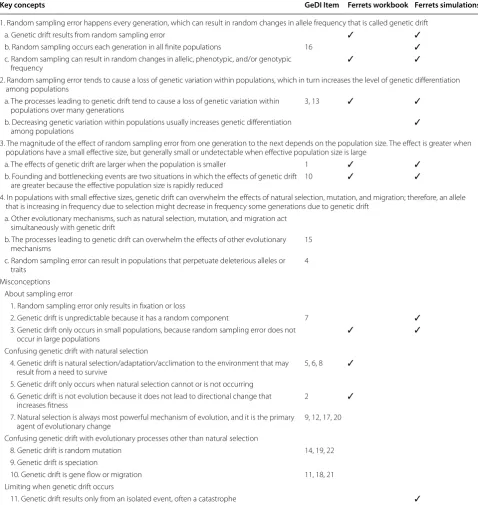
Table 1 Coverage of key concepts and misconceptions about genetic drift in the GeDI and the Ferrets module
These key concepts are considered necessary for understanding genetic drift (Price et al. 2014), and the misconceptions are those that undergraduates frequently have about genetic drift (Andrews et al. 2012). We indicate whether each key concept or misconception was explicitly covered in the text of the printed workbook and/or addressed in the onscreen simulations of the Ferrets module
Key concepts GeDI Item Ferrets workbook Ferrets simulations
1. Random sampling error happens every generation, which can result in random changes in allele frequency that is called genetic drift
a. Genetic drift results from random sampling error ✓ ✓
b. Random sampling occurs each generation in all finite populations 16 ✓ c. Random sampling can result in random changes in allelic, phenotypic, and/or genotypic
frequency ✓ ✓
2. Random sampling error tends to cause a loss of genetic variation within populations, which in turn increases the level of genetic differentiation among populations
a. The processes leading to genetic drift tend to cause a loss of genetic variation within
populations over many generations 3, 13 ✓ ✓
b. Decreasing genetic variation within populations usually increases genetic differentiation
among populations ✓
3. The magnitude of the effect of random sampling error from one generation to the next depends on the population size. The effect is greater when populations have a small effective size, but generally small or undetectable when effective population size is large
a. The effects of genetic drift are larger when the population is smaller 1 ✓ ✓ b. Founding and bottlenecking events are two situations in which the effects of genetic drift
are greater because the effective population size is rapidly reduced 10 ✓ ✓
4. In populations with small effective sizes, genetic drift can overwhelm the effects of natural selection, mutation, and migration; therefore, an allele that is increasing in frequency due to selection might decrease in frequency some generations due to genetic drift
a. Other evolutionary mechanisms, such as natural selection, mutation, and migration act simultaneously with genetic drift
b. The processes leading to genetic drift can overwhelm the effects of other evolutionary
mechanisms 15
c. Random sampling error can result in populations that perpetuate deleterious alleles or
traits 4
Misconceptions About sampling error
1. Random sampling error only results in fixation or loss
2. Genetic drift is unpredictable because it has a random component 7 ✓ 3. Genetic drift only occurs in small populations, because random sampling error does not
occur in large populations ✓ ✓
Confusing genetic drift with natural selection
4. Genetic drift is natural selection/adaptation/acclimation to the environment that may
result from a need to survive 5, 6, 8 ✓
5. Genetic drift only occurs when natural selection cannot or is not occurring 6. Genetic drift is not evolution because it does not lead to directional change that
increases fitness 2 ✓
7. Natural selection is always most powerful mechanism of evolution, and it is the primary
agent of evolutionary change 9, 12, 17, 20
Confusing genetic drift with evolutionary processes other than natural selection
8. Genetic drift is random mutation 14, 19, 22
9. Genetic drift is speciation
10. Genetic drift is gene flow or migration 11, 18, 21 Limiting when genetic drift occurs
Genetic drift inventory (GeDI)
The GeDI is a concept inventory designed to measure undergraduate students’ understanding of key concepts in genetic drift and to diagnose misconceptions around that topic (Table 1; Price et al. 2014). The test has 22 true/false items, phrased as agree/disagree, that relate to vignettes describing scenarios in which genetic drift took place. For example, an item asking about the target con-cept that “The processes leading to genetic drift tend to cause a loss of genetic variation within populations over many generations” (Price et al. 2014: 71) asks students to evaluate a vignette and then to indicate whether a biolo-gist would agree or disagree with the statement that “The island population likely has fewer alleles—that is versions of genes—than the mainland population” (Supplemen-tary Materials in Price et al. 2014). Seven of the items tar-get key concepts of genetic drift, while the remaining 15 items target misconceptions (Table 1).
Treatments
We recruited courses for the two treatments separately, calling on our network of colleagues who have some familiarity with the literature on evolution education for the control treatments or our colleagues who already use the SimBio Virtual Labs® for the module courses. In the control treatment, students received traditional instruction (control courses); in the experimental treat-ment, students completed the Ferrets module (module courses) in addition to traditional instruction. For both treatments, students completed the GeDI (Price et al. 2014) before instruction on genetic drift began, and completed it again after instruction ended. We excluded students who did not complete both the pretest and the posttest, students who took the assessment three times, and courses that allowed students to work in groups on the test. In all of the module courses and three of the five control courses, the version of the GeDI used in this study was altered slightly from the one published by Price et al. (2014) by adding the phrase “State whether you agree or disagree” to Stem E; the course in the con-trol group from the Research University, Midwest and
the Moderate Research University, West were the only courses that used the original wording. Permission to use data from students was granted by Institution Review Board Approval 42,505 from the University of Washing-ton, New England Independent Review Board Protocol 14–131, and California State University, Fullerton Insti-tution Review Board Approval 13_0473. All students in the study consented to participate and consented to have de-identified data published.
Control courses
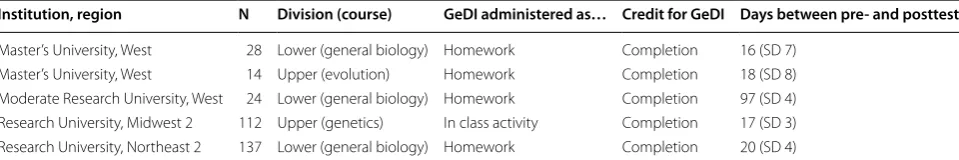
In the control courses instructors taught genetic drift as they normally would, through combinations of read-ings from the text, homework, lecture, discussion, and in-class activities. The control group included a total of five courses composed of 315 students total (Table 2, mean class size 63, SD 57); two of these were large courses (>100) and three were small (≤28). Three of the courses were general biology, another was an upper divi-sion genetics course, and the last was an upper dividivi-sion evolution course (Table 2). The number of days devoted to instruction and form of instruction varied across courses. The mean time between the pre- and posttest for four institutions was 20 days (SD 6), because testing was intended to surround instruction specifically about genetic drift. In the other institution (Moderate Research University, West), the instructor administered the pre- and posttest in the second and final week of the 17 week semester, respectively (Table 2). In all of the control courses, students received credit for completion of the GeDI, but not for the correctness of their answers on the test.
Module courses
Instructors of the module courses used the Ferrets mod-ule as part of their instruction on genetic drift as an in-class or in-lab activity, as a homework assignment, or as a combination of both. For these courses, the GeDI was incorporated into the module as a pretest to be com-pleted before beginning the module and as a posttest to be completed after it. Instructors varied in the timing of
Table 2 Courses in the control treatment
All students received credit for completing the GeDI, but their GeDI scores did not affect their grades. The classifications of institutions are simplified from the Carnegie Classification of Institutions of Higher Education (The Carnegie Classification of Institutions of Higher Education n.d., http://carnegieclassifications.iu.edu/)
Institution, region N Division (course) GeDI administered as… Credit for GeDI Days between pre- and posttest
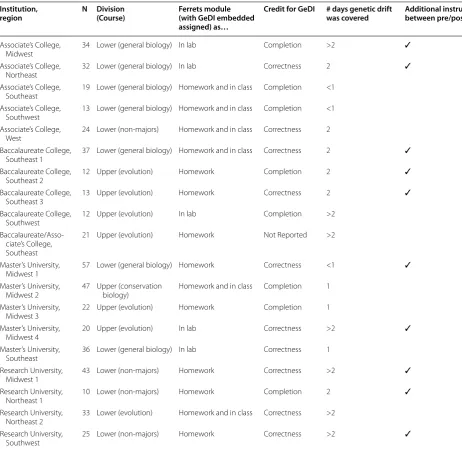
when they assigned the pre- and posttests: some assigned the entire lab, including the pre- and posttest, as a single assignment, while others assigned them to be completed separately. All instructors administered the pre- and posttests within a two-week period. The module courses included a total of 19 classes composed of 510 students (mean course size 27, SD 13; Table 3). All of the classes were small to medium-sized (range 10–57).
Instructors varied with respect to the number of days of instruction they devoted to genetic drift, whether they provided additional instruction beyond the Ferrets mod-ule, and whether they gave credit for correctness or com-pletion of answers on the posttest (Table 3). Six of the courses were upper division. The rest were lower division general biology courses (100 or 200 level), and four of these were aimed at non-majors. Two of the institutions in the module treatment were community colleges.
Data analysis
We calculated item difficulty on the pretest across both treatments by dividing the number of correct responses for each item by the total number of responses for that item (Crocker and Algina 1986) in order to compare our populations with those reported previously (Price et al. 2014). We used generalized linear mixed models (GLMM), using the glmer function from the lme4 pack-age (Bates et al. 2014) in R 3.1.3 (R Core Team 2014) for the rest of our analysis.
To begin, we investigated whether the student sam-ples in control and module courses were equivalent. We did this by comparing student performance on the GeDI before instruction (pretest) between control and mod-ule courses. We found minor levels of overdispersion in this dataset. Overdispersion, when the variance is greater than expected under a given model, is a common attrib-ute of data in a GLMM and can increase the probability of a Type I error (Crawley 2013). We accounted for the overdispersion by including a term in our GLMM for observation-level random effect (OLRE; Harrison 2014). We added an additional random factor in our model, Course, to help account for differences in instructor, class size, institution, and implementation among non-independent groups of students. Thus, our first model included three variables to predict Performance after instruction: Treatment (fixed factor), Course (random factor), and an OLRE (random factor) as predictor vari-ables (Table 4).
Next, we compared how students performed on the posttest with a model that included Pretest score (fixed), Treatment (fixed), Course (random) and OLRE (ran-dom) as predictor variables (Table 4). Because each item in the GeDI targets either a single key concept or a sin-gle misconception, we used the same model to compare
how students performed between treatments on the items in the GeDI that targeted key concepts essential to understanding genetic drift and items that targeted misconceptions about genetic drift (Table 1). We used Holm-Bonferroni corrections to account for the fact that we conducted multiple analyses of the same sets of data (Holm 1979), resulting in an alpha of 0.025 for the first comparison and an alpha of 0.05 for the second compari-son of posttest performance.
We conducted additional analyses to investigate sources of variation between control and module courses that could have affected the outcome of our main anal-ysis. Because the form of credit (completion vs. cor-rectness on GeDI posttest) varied among the module courses, but not the control courses, we constructed two additional GLMMs. The first compared posttest per-formance between module courses in which students received credit for completion of the GeDI (8 courses) to module courses in which students received credit for cor-rectness on the GeDI (11 courses), controlling for course differences. We found no significant difference in posttest performance. We then re-ran the full model but excluded those module courses that gave credit for correctness on the GeDI. There were no differences in the results of that analysis when compared to the analysis of the full data-set, so we continued with the full model.
We had relatively large differences in mean class size between the control (mean 63, SD 57) and module (mean 27, SD 13) courses. We investigated the impact of class size on our results in two ways. First, we constructed an additional GLMM that included only the module courses with class sizes of 30 or greater. This reduced the num-ber of module courses to eight, and narrowed the differ-ence in mean class size between the treatment groups. The results were largely similar to the analysis with the full dataset, with the exception that the effect of Treat-ment on the performance of students on questions about misconceptions, which was small in the GLMM using the entire data set (p = 0.018; Table 4), was no longer significant (p = 0.065). Second, we divided the sample of module classes in half to compare the class size of the nine lowest performing classes to the ten highest per-forming classes, which were 26.8 and 26.9 respectively. Taken together, the results of these two tests suggest that class size is not responsible for the differences we found between treatments, so we continued our analysis with all of the classes.
A Cohen’s d of 0 indicates complete overlap between treatments (i.e., the module students performed equiva-lently to control students), while a Cohen’s d of 3 would indicate that all members of one treatment scored above the mean of the other (i.e., module students far outper-formed control students). The larger the absolute value of Cohen’s d, the less overlap between groups, and the stronger the effect of treatment. However, a negative Cohen’s d would indicate a change in the opposite direc-tion as a positive Cohen’s d.
We calculated effect size in two ways: by looking at the effect of instruction on GeDI performance within each course and by looking at the effect of treatment on change in performance on the GeDI. To determine the effect of instruction within each course, we calculated the Cohen’s d [(average posttest − average pretest)/(pooled SDpre- and posttest]. We used Cohen’s d, instead of ized learning gains, because the calculation for normal-ized learning gains does not account for the students who have perfect scores on both pre- and posttest, nor
Table 3 Courses in the module treatment
All students received credit for completing the GeDI pretest; in some courses, students received credit for completing the posttest, while others were scored based on correctness. The GeDI was embedded in the lab activity as both a pre- and post-test. The pre- and posttests were administered within a 2-week period for all of these courses. Classifications of institutions as in Table 2
Institution,
region N Division (Course) Ferrets module (with GeDI embedded
assigned) as…
Credit for GeDI # days genetic drift
was covered Additional instruction between pre/post?
Associate’s College,
Midwest 34 Lower (general biology) In lab Completion >2 ✓ Associate’s College,
Northeast 32 Lower (general biology) In lab Correctness 2 ✓
Associate’s College,
Southeast 19 Lower (general biology) Homework and in class Completion <1 Associate’s College,
Southwest 13 Lower (general biology) Homework and in class Completion <1 Associate’s College,
West 24 Lower (non-majors) Homework and in class Correctness 2 Baccalaureate College,
Southeast 1 37 Lower (general biology) Homework and in class Correctness 2 ✓ Baccalaureate College,
Southeast 2 12 Upper (evolution) Homework Completion 2 ✓
Baccalaureate College,
Southeast 3 13 Upper (evolution) Homework Correctness 2 ✓
Baccalaureate College,
Southwest 12 Upper (evolution) In lab Completion >2
Baccalaureate/Asso-ciate’s College, Southeast
21 Upper (evolution) Homework Not Reported >2
Master’s University,
Midwest 1 57 Lower (general biology) Homework Correctness <1 ✓ Master’s University,
Midwest 2 47 Upper (conservation biology) Homework and in class Completion 1 Master’s University,
Midwest 3 22 Upper (evolution) Homework Completion 1 Master’s University,
Midwest 4 20 Upper (evolution) In lab Correctness >2 ✓
Master’s University,
Southeast 36 Lower (general biology) In lab Correctness 1 Research University,
Midwest 1 43 Lower (non-majors) Homework Correctness >2 ✓ Research University,
Northeast 1 10 Lower (non-majors) Homework Completion 2 ✓
Research University,
Northeast 2 33 Lower (evolution) Homework and in class Correctness >2 Research University,
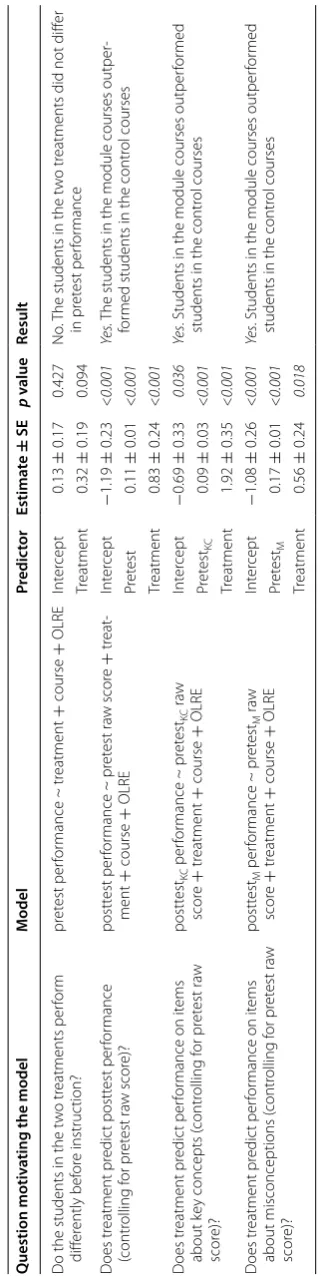
Table 4 Summar y of sta tistic al t ests used
In all models
, C
ourse is a r
andom fac tor tha t ac coun ts f or diff er enc es acr
oss classes tha
t w
er
e not c
on
tr
olled dur
ing the study
. Obser va tion-lev el r andom eff ec t (
OLRE) is a r
andom fac tor tha t ac coun ts f or o ver dispersion in the model . Subscr ipt K C indica
tes the subset of it
ems in the G
eDI about key c
onc
epts; subscr
ipt M indica
tes the subset of it
ems on the G
eDI about misc
onc eptions . Sig nifican t r esults af ter Holm-B onf er roni c or rec tions ar e in italics Q uestion motiv
ating the model
M odel Pr edic tor Estima te ± SE p v alue Result D
o the students in the t
w o tr eatments per for m diff er ently bef or e instruc tion? pr et est per for mance ~ tr eatment + course + OLRE Int er cept 0.13 ± 0.17 0.427 No . T
he students in the t
w
o tr
eatments did not diff
er in pr et est per for mance Tr eatment 0.32 ± 0.19 0.094 D oes tr eatment pr edic t postt est per for mance (contr olling f or pr et est ra w scor e)? postt est per for mance ~ pr et est ra w scor e + tr eat -ment + course + OLRE Int er cept − 1.19 ± 0.23 <0.001 Ye s. T
he students in the module courses outper
-for
med students in the contr
ol courses Pr et est 0.11 ± 0.01 <0.001 Tr eatment 0.83 ± 0.24 <0.001 D oes tr eatment pr edic t per for
mance on it
ems
about k
ey concepts (
contr olling f or pr et est ra w scor e)? postt est KC per for mance ~ pr et estKC ra w scor e + tr eatment + course + OLRE Int er cept − 0.69 ± 0.33 0.036 Ye s
. Students in the module courses outper
for
med
students in the contr
ol courses Pr et est KC 0.09 ± 0.03 <0.001 Tr eatment 1.92 ± 0.35 <0.001 D oes tr eatment pr edic t per for
mance on it
ems
about misconceptions (
contr olling f or pr et est ra w scor e)? postt est M per for mance ~ pr et est M ra w scor e + tr eatment + course + OLRE Int er cept − 1.08 ± 0.26 <0.001 Ye s
. Students in the module courses outper
for
med
students in the contr
students whose scores decrease on the posttest (Miller et al. 2010). We then averaged the Cohen’s d across all courses in each treatment to estimate the average effect of instruction within each treatment.
We then estimated the strength of effect of treatment on student learning by calculating Cohen’s d from the average change in test scores across treatments [(aver-age change in scoremodule − average change in score con-trol)/pooled SD of change in scoreall courses]. This approach allowed us to account for the change in student perfor-mance from pretest to posttest for students when esti-mating the magnitude of effect of treatment on student performance on the GeDI.
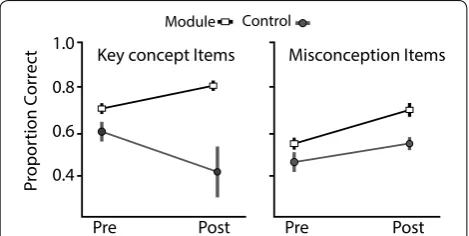
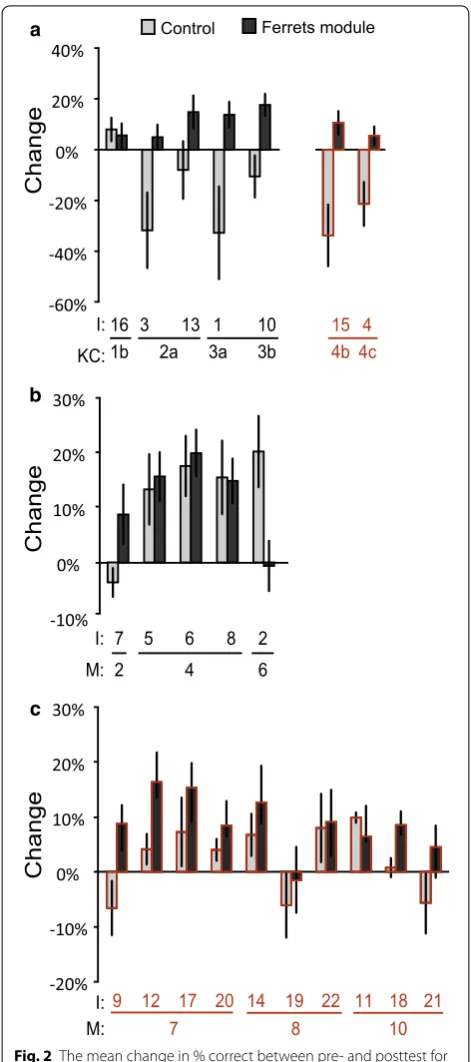
To compare pre- and posttest scores visually, we cal-culated the proportion of items about key concepts and misconceptions that students answered correctly in each class. We then graphed the average proportion of cor-rect answers by treatment. To highlight how students in the two treatments differed on each item of the GeDI, we calculated the change in percent correct for each item by course, and then graphed the averages of those differ-ences by treatment.
Results
Students’ performance on the GeDI before instruction Students in both treatments performed similarly on the GeDI prior to instruction (Fig. 1; Table 4). The mean pro-portion of correct responses on the GeDI pretest across all students in the five control courses and 19 modules courses was 0.58 (SD 0.09), which falls on the low end of the range of GeDI performance reported earlier (Price et al. 2014). Item difficulty ranged from 0.30 to 0.80,
closely matching the range of difficulty seen during GeDI development (Price et al. 2014).
Effect of treatment on students’ performance
Students who completed the Ferrets module showed significant increases in performance on the GeDI after instruction. The mean proportion of correct responses on the GeDI increased from 0.60 (SE 0.02) to 0.70 (SE 0.03). This increase is due to improved performance on items about both key concepts and misconceptions (Fig. 1). Furthermore, students who completed the Fer-rets module significantly outperformed (p < 0.001) those in the control courses when accounting for pretest scores and random effects associated with each course (Figs. 1, 2; Table 4). This outperformance occurred both on items about key concepts (p < 0.001) and on items about mis-conceptions (p < 0.05). In the control courses, mean performance on items about misconceptions improved from 0.49 (SE 0.03) to 0.56 (SE 0.03) (Fig. 1). However, the mean performance on items about the key concepts was significantly worse after instruction, falling from 0.62 (SE 0.04) to 0.43 (SE 0.11) (Fig. 1). Together this indicates that mean student performance in the control group was poorer on the GeDI after instruction, dropping from 0.53 (SE 0.03) to 0.51 (SE 0.03) (Fig. 1).
For control courses, the average Cohen’s d was −0.04 (SD 0.2); the negative value indicates that, on aver-age, the pretest scores were slightly higher than posttest scores (Additional file 1: Table S1). Therefore, instruc-tion in control courses had a minimal impact on stu-dent performance. In comparison, the average Cohen’s d across courses in the module treatment was 0.63 (SD 0.59), demonstrating that instruction with the mod-ule had a sizable positive effect on student performance (Additional file 1: Table S1). Moreover, the effect size of treatment on the change of scores was quite large: 1.63 (Cohen’s d). This result indicates a strong positive effect of the Ferrets module on student performance relative to control course students.
The improvement of students in the module courses was not limited to content explicitly covered in the Fer-rets module. Key concepts 4B and 4C (Fig. 2a; Table 1) are not incorporated into the Ferrets module workbook or simulations. However, students in the module courses improved on items aligned with those concepts, while fewer students in control courses answered those items correctly. A similar pattern occurred with items about misconceptions 7, 8, and 10; these are not covered in the Ferrets module (Table 1), but students in the module courses improved their performance on most of these items, and outperformed students in control courses on many of them (Fig. 2c; Table 1).
Pre Post 1.0
Pr
opor
tion Correc
t
0.8
0.6
0.4
Control
Pre Post Key concept Items Misconception Items
Module
Fig. 1 The mean change in proportion correct on items about
Discussion
We found that the students in the module courses con-sistently outperformed students in the control courses on the posttest, and that the effect of treatment on post-test of the GeDI was quite large. Specifically, students in the module courses show a marked improvement on the GeDI, while scores of students in the control courses decreased after instruction. This decrease is driven primarily by poorer performance on items about key concepts (Fig. 1). In this Discussion, we begin by acknowledging the limitations of our experimental design, and also explain why these limitations do not diminish our findings. We then discuss why we believe students in the control courses did poorly, and why stu-dents in the module courses did well. Our interpretation relies on the fact that the quantity and quality of time spent engaging students in making observations, col-lecting data, and constructing and testing predictions through a computer simulation provides a particularly robust learning environment. In the last part of the Dis-cussion, we propose a revision to the learning framework that others (Andrews et al. 2012) have proposed for how students learn genetic drift.
Limitations of the experimental design
It is surprising that the scores of students in the trol courses dropped after instruction. Here we con-sider aspects of our experimental design that may have contributed to this finding. Ultimately, we conclude that these aspects did not bias our results toward this unusual discovery.
Were students in the module courses more motivated to do well on the GeDI?
Students in the control courses did not receive credit for their scores on the GeDI, whereas most of the students in the module courses did. The students in the module courses who received credit for the number of items they answered correctly might have been more motivated to work harder, and do better, on the assessment (Wise and DeMars 2005; but see Couch and Knight 2015 for an opposing point of view). We accounted for this possibility by running two additional analyses. The first compared performance within the module courses. We compared the courses in which credit was assigned for correctness and courses in which credit was assigned only for com-pletion. We found no difference between the groups. The second analysis compared control courses to the eight module courses that assigned credit for completion. We -60%
-40% -20% 0% 20% 40%
-10% 0% 10% 20% 30%
-20% -10% 0% 10% 20% 30%
Control Ferrets module
Change
a
Change
b
Change
c
16 3 13 1 10 15 4 1b 2a 3a 3b 4b 4c I:
KC:
7 5 6 8 2 6 4
2 I: M:
14 19 22 11 18 21
8 10
I: M:
9 12 17 20 7
Fig. 2 The mean change in % correct between pre- and posttest for
found the same results that we did when we used the full data set. Furthermore, we found no difference in pretest scores between the control courses and module courses, suggesting that the populations were relatively similar before instruction. Therefore, we think that poorer per-formance on the GeDI post-instruction was unlikely to be due to differences in student motivation between treatments.
How does small class size affect our results?
The average size of the courses in the module treatment was smaller than in the control courses. Eleven of the module courses had class sizes less than 30; although three of the control courses also had class size less than 30, the other two courses in the control treatment were larger than any of the classes in the module treatment (Tables 2, 3). Since small course sizes may impact learn-ing, some of the difference in performance between the treatments could be due to the fact that module courses were smaller. We tested for this possibility with two addi-tional analyses. The first was a GLMM that compared the control courses to the eight module courses with class sizes greater than 30, narrowing the difference in average class size between treatments. The results of this model differed only in that the significant effect of treatment on posttest performance on the items about misconceptions was lost. It did not change the significant differences in overall performance or on items about key concepts (Fig. 1; Table 3). In a second additional analysis, we saw no discernible relationship between class size and post-test performance. The average class sizes in the module treatment were essentially identical between the nine lowest performing classes and the remaining ten classes. Therefore, we suggest that the difference between control and module treatments on the GeDI post-instruction is unlikely to be due to the smaller class sizes in the module treatments.
How does time on task affect our results?
The increase in performance across most key concepts and misconceptions may be due to the fact that stu-dents in the module courses spent more time studying genetic drift. Beyond the qualitative differences between the instructional module and common classroom activi-ties, the module takes approximately 2 h to complete (Table 3). We did not quantify the time devoted to genetic drift in the control courses, but it is likely that students in the module courses took part in instruction on genetic drift for longer than many of the students in the control courses.
In addition to differences in time on task, the quality of time spent working actively with genetic drift also dif-fered. We recognize that most instructors do not have the
classroom time to devote to this type of prolonged active engagement and hypothesis testing, nor do they have the time to develop modules that efficiently engage students in activities like the Ferrets module. Therefore, given limitations on instructors’ time, it is reasonable to inter-pret the increased performance of students in the module courses as due in part to the fact that those students spent more time actively solving problems about genetic drift. A major advantage of the Ferrets module is that it already developed, and it was done so through careful implemen-tation of thoughtful pedagogical practices (e.g., American Association for the Advancement of Science 2011; NGSS Lead States 2013; Couch et al. 2015).
Did differences in time between pre‑ and posttesting affect our conclusions?
The time between pre- and posttest was much longer in the control courses than in the module courses. One interpretation of this result could be that the students in module courses performed better because there was less time between their pre- and posttests. This out-come would predict that the performance among stu-dents in the control courses either did not change, or did not increase as much as they did in the module courses. However, we find that the mean performance of students in the control courses actually drops—a result that is not consistent with the explanation that time elapsed is the best explanation. We also found that the course with the longest time between pre- and posttest (mean 97 days SD 4) showed a slight increase from pre- to posttest scores. Therefore, we conclude that the time between pre- and posttest is not sufficient to explain our results.
Performance in the control courses
We know of only one other study that looked specifi-cally at students’ understanding of genetic drift before and after instruction (Andrews et al. 2012). In that study, introductory students answered an open-ended ques-tion that required them to consider whether genetic drift could explain a shift in genotype. In the pretest, stu-dents referred to genetic drift infrequently: only 1 % of the 85 students referred to genetic drift; even within this 1 %, their comments were so vague that they could not be evaluated. After instruction, 21 of the 122 students referred to genetic drift, but only 13 indicated some knowledge of what genetic drift actually does (Table 2 in Andrews et al. 2012).
Andrews et al. (2012) used their results to propose a framework that describes how students acquire knowl-edge about genetic drift through three stages, one of which is learning to recognize genetic drift as distinct from other evolutionary processes, such as natural selec-tion, mutaselec-tion, and migration (Stage 2 in Fig. 3). For example, Item 6 on the GeDI asks students whether a biologist would agree or disagree with the (incorrect) statement that “The fact that individuals that were best suited to the environment had a higher rate of survival contributed to genetic drift” (Supplementary Materials in Price et al. 2014). In our study, we find a big increase in performance on this item for students in both the con-trol and module treatments (Fig. 2b), indicating that they
are in Stage 2. Because it is so challenging for students to recognize that evolution encompasses more than natu-ral selection (Price and Perez 2016), the fact that the stu-dents in the control courses are making this change is noteworthy.
We postulate that students in the control courses are still in Stage 2, because, even though they recognize the existence of different evolutionary processes, they con-tinue to be confused by the distinctions between them, and they are often distracted by vocabulary. For exam-ple, students might confuse genetic drift with gene flow, perhaps because they confound the word drift with the idea of migration (Andrews et al. 2012); on Item 18 of the GeDI, students are asked whether a biologist would agree or disagree with the (incorrect) statement that “Since there was no migration there could be no genetic drift” (Supplementary Materials in Price et al. 2014). Although students in the module courses improved on this item, performance on it did not change after instruction among the students in the control classes (Fig. 2c). This indicates that some confusion over vocabulary persists through instruction.
Students in the control group may be performing worse on the items about key concepts because their under-standing of genetic drift is only just developing; inac-curacies are possibly being incorporated into or already existing in their conceptual frameworks (Stage 3 in Andrews et al. 2012). The items in the GeDI about key concepts predominantly focus on how genetic drift works and the effect that it has on a population. For example, Item 1 in the GeDI asks students whether a biologist would agree or disagree with the (correct) statement that “Genetic drift is more pronounced in the [founding] island population than the [larger] mainland population in these first few generations” (Supplementary Materi-als in Price et al. 2014). We suggest that what students typically learn during instruction is that genetic drift has a powerful effect in founding populations. This focus on small populations, however, can lead to an incorrect conclusion that genetic drift occurs only in small popu-lations, and students often fail to recognize that drift occurs in all real, finite populations. The fact that a mis-conception like this could emerge from instruction may be a natural consequence of students making sense of new ideas. Indeed, it is unlikely that students think about the situations in which genetic drift occurs before they fully understand what genetic drift is.
Price et al. (2014) suggest that items about key con-cepts are less difficult for students than items about mis-conceptions. In this study, the opposite pattern appears to hold true. One key difference between our study and theirs that might explain the opposing findings is that the testing in Price et al. (2014) was completed before
Stage 1: vague, undeveloped
concept of evolution
Stage 2: recognizing
of evolution
Stage 3: developing comprehension of genetic drift in particular
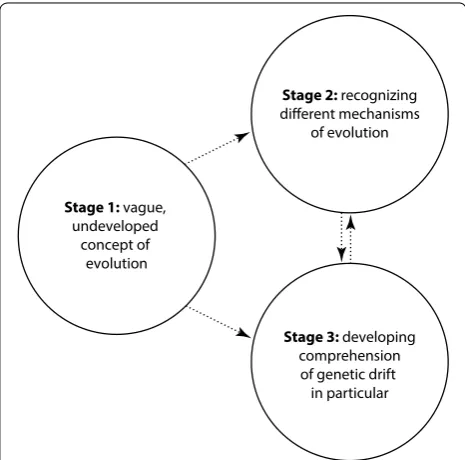
Fig. 3 Revised hypothetical framework for how students learn
instruction. It may be that, for this challenging topic, misconceptions are most difficult prior to instruction, but they are nonetheless easier to dispel then key con-cepts are to acquire. Moreover, all of the courses used for final testing in Price et al. (2014) were upper division courses, in which students had previously been exposed to genetic drift. It is therefore conceivable that students were already in Stage 2 of the learning framework when they took the GeDI. The students in our control courses are primarily—but not exclusively—in general biology courses (Table 2). Future work exploring the pre- and post-instruction difficulty of items about misconceptions and key concepts could help inform a new model of stu-dent learning in genetic drift.
Performance in the module courses
The effect of the Ferrets module on student learning was substantial for a short intervention (average Cohen’s d within module courses = 0.63). Students in the Fer-rets module courses significantly outperformed students in the control courses because they did better on items about key concepts, suggesting that they had a better understanding of genetic drift (Figs. 1, 2; Table 4). Their performance even improved on items about key concepts and misconceptions that were not explicitly covered in the Ferrets module, generally to a greater degree than did control course students (Fig. 2c).
The Ferrets module was designed to engage students by guiding them through the construction of their own concept of genetic drift by making observations, collect-ing data, and makcollect-ing and testcollect-ing predictions. While this approach is not unique to the Ferrets module, the combi-nation of observations and experimentation with simula-tions is what makes the module treatment different from the controls. Our experimental design does not allow us to determine how much each of the individual prac-tices contributed to learning. Instead, we can only offer the evidence that the multi-faceted approach to instruc-tion in the Ferrets module supported learning better than classroom instruction alone.
Although we cannot attribute the gains in GeDI scores to specific elements of the Ferrets module, we suggest that computer simulations support learning for topics such as genetic drift. Simulations allow students to inves-tigate population-level phenomena that span generations, like genetic drift, which are otherwise not amenable to investigation in the classroom given the time and spatial scales involved. The visualizations available in the Ferrets module enable students to observe and experiment with several aspects of drift, including the random changes in allele frequency due to sampling error, that these changes occur every generation, and that drift occurs in popula-tions of any finite size. In support of the suggestion that
visualization may help teach random processes, Meir et al. (2005) demonstrated that simulations of osmo-sis and diffusion decreased misconceptions about those molecular phenomena because they allowed students to directly observe the random movement of molecules. Within the Ferrets module, students can set parame-ters such as population size and initial allele frequency; repeatedly test the effect of varying these parameters; and make and test predictions. Since drift is a phenom-enon where the starting conditions impact the outcome in a probabilistic way, repeated testing and varying of parameters may help students build understanding in a way that is difficult to do with reading, lecture, and static representations. As suggested by Windschitl and Andre (1998), simulations that allow for exploration can be effective tools to overcome misconceptions and effect conceptual change. Separating the impacts of computer-based simulations and experimentation would be a topic for future research.
Some intriguing aspects of students’ performance suggest that learning during this activity is particularly sophisticated. In the learning framework hypothesized by Andrews et al. (2012), students begin to recognize different mechanisms of evolution (Stage 2) before they learn content specific to genetic drift (Stage 3); this is the pattern that we observed in students in the control courses. Students in the module courses were increasing their understanding of both vocabulary and genetic drift during the module (Figs. 1, 2; Table 4). Students in the module courses also improved on both key concepts and misconceptions, including some that were not directly addressed in the Ferrets module’s instructions or simula-tions (Table 2; Fig. 2). This approach was clearly effective.
Revised hypothetical framework for learning genetic drift As described above, Andrews et al. (2012) hypothesized three stages for learning genetic drift: (1) undeveloped concepts of evolution and genetics at the broadest level, (2) undeveloped and overlapping concepts of different evolutionary mechanisms, and (3) developing under-standing about genetic drift in particular. Our results lead us to suggest to revise this framework to incorporate multiple learning pathways, rather than a linear progres-sion through the stages (Fig. 3). The results from students in the module classes suggest that students can move from Stage 1 to either Stage 2 or Stage 3, or to both Stage 2 and Stage 3 simultaneously.
different mechanisms of evolution exist. This realiza-tion in itself is quite challenging (Price and Perez 2016). Thus, there is misalignment between what students are learning and what instructors intend to be teach-ing. Instructors think they are teaching genetic drift, but student thinking is revolutionized by a more basic concept that there is more to evolution than natural selection.
Conclusions
The simulation-based Genetic Drift and Bottlenecked Ferrets module is effective at teaching students about genetic drift, as measured by the GeDI. Students who used this interactive module demonstrated deeper com-prehension of key concepts about genetic drift, and improved their ability to dispel misconceptions about genetic drift. In contrast, students taught using other common methods of instruction improved their ability to dispel misconceptions, but their grasp of key concepts appeared to decline. We hypothesize that the Ferrets module works in part because the lab allows students to simulate drift and visualize how identical starting points can lead to different outcomes in replicate popula-tions. Interestingly, students improved even in areas not directly addressed by the module.
Earlier work hypothesized that as students learn about genetic drift, they more easily adopt key con-cepts than they dispel misconceptions, and they pass through a more-or-less linear series of stages toward a developing concept of genetic drift. This study compli-cates that picture. Our results suggest that as students learn about genetic drift, they simultaneously grapple with more general aspects of evolution, and they can develop new confusions that contribute to a fuzzier picture of how evolution works before and during their progression to a more expert and nuanced understand-ing. Students in the control groups appeared to enter a stage where their understanding of key concepts about genetic drift decreased, even as they recognized that genetic drift is an evolutionary process distinct from natural selection, migration, and random muta-tion. In the module courses, some students did not progress sequentially through stages of intermedi-ate understanding, but rather developed some deeper understanding of genetic drift at the same time as they broadened awareness about evolution. This more com-plex model of student learning suggests that instruc-tional materials cannot assume a particular learning trajectory, and that tools such as the Ferrets module, wherein multiple concepts and misconceptions can be addressed at once, are important aids for efficient instruction in evolution.
Abbreviations
GeDI: genetic drift inventory (Price et al. 2014); GLMM: generalized linear mixed model; I: item; KC: key concept; M: misconception; OLRE: observation-level random effect; SD: standard deviation; SE: standard error.
Authors’ contributions
RMP and EM conceived of the project. RMP orchestrated data collection for the control courses and contributed to analyses and writing. DSP and SM orchestrated data collection for the module courses, and DSP contributed to analyses and writing. JKA orchestrated data collection for control courses, con-ducted statistical analyses, and contributed to writing. SM, EM, and colleagues developed the module and distributed it to the instructors who participated in the module treatment. All authors edited the final manuscript. All authors read, edited, and approved the final manuscript.
Author details
1 School of Interdisciplinary Arts and Sciences, University of Washington Bothell, 18115 Campus Way NE, Box 358530, Bothell, WA 98011-8246, USA. 2 SimBio, 222 3rd Street, Suite 0300, Cambridge, MA 02142, USA. 3 Depart-ment of Biological Science, California State University Fullerton, P.O. Box 6850, Fullerton, CA 92834-6850, USA.
Acknowledgements
We thank the developers of the Ferrets lab, the instructors and students who participated in the study, Sarah L. Eddy, Jon C. Herron, Kathryn E. Perez, Mar-garet R. Metz, two anonymous reviewers, and the University of Washington Biology Education Research Group. We also thank the University of Washing-ton Royalty Research Fund (for supporting RMP).
Competing interests
RMP and JKA have no competing interests in this project. DSP, SM, and EM are employed by SimBio. JKA is collaborating with researchers at SimBio on several grants.
Received: 30 September 2015 Accepted: 13 July 2016
References
Abraham JK, Meir E, Perry J, Herron JC, Maruca S, Stal D. Addressing undergrad-uate student misconceptions about natural selection with an interactive simulated laboratory. Evol Educ Outreach. 2009;2:393–404. doi:10.1007/ s12052-009-0142-3.
Abraham JK, Perez KE, Downey N, Herron JC, Meir E. Short lesson plan associated with increased acceptance of evolutionary theory and potential change in three alternate conceptions of macroevolution in undergraduate students. CBE Life Sci Educ. 2012;11:152–64. doi:10.1187/ cbe.11-08-0079.
American Association for the Advancement of Science. Vision and change in undergraduate biology education: a call to action. Washington, DC: AAAS; 2011.
Andrews TM, Price RM, Mead LS, McElhinny TL, Thanukos A, Perez KE, Her-reid CF, Terry DR, Lemons PP. Biology undergraduates’ misconceptions about genetic drift. CBE Life Sci Educ. 2012;11:248–59. doi:10.1187/ cbe.11-12-0107.
Additional file
Additional file 1: Table S1. Mean performance data across all courses.
Andrews D, Price M, Mead B, McElhinny S, Thanukos RHB, Perez H, Herreid B. lme4: Linear mixed-effects models using Eigen and S4. J Stat Softw. 2014. arXiv:1406.5823.
Baum DA, Smith SD, Donovan SSS. The tree-thinking challenge. Science. 2005;310:979–80. doi:10.1126/science.1117727.
Bray Speth E, Long TM, Pennock RT, Ebert-May D. Using Avida-ED for teaching and learning about evolution in undergraduate introduc-tory biology courses. Evol Educ Outreach. 2009;2:415–28. doi:10.1007/ s12052-009-0154-z.
Cohen J. Statistical power analysis for the behavioral sciences. 2nd ed. Hills-dale: Erlbaum; 1998.
Couch BA, Brown TL, Schelpat TJ, Graham MJ, Knight JK. Scientific teach-ing: defining a taxonomy of observable practices. CBE Life Sci Educ. 2015;14:1–12. doi:10.1187/cbe.14-01-0002.
Couch BA, Knight JK. A comparison of two low-stakes methods for administer-ing a program-level biology concept assessment. J Microbiol Biol Educ. 2015;16:178–85. doi:10.1128/jmbe.v16i2.953.
Crawley MJ. The R book. 2nd ed. New York: Wiley; 2013.
Crocker L, Algina J. Introduction to classical and modern test theory. Orlando: Holt, Rinehart and Winston; 1986.
Crowther GJ, Price RM. Re: misconceptions are “so yesterday!”. CBE Life Sci Educ. 2014;13:3–5. doi:10.1187/cbe.13-11-0226.
Garvin-Doxas K, Klymkowsky MW. Understanding randomness and its impact on student learning: lessons learned from building the biology concept inventory (BCI). CBE Life Sci Educ. 2008;7:227–33. doi:10.1187/cbe.07. Gregory TR. Understanding natural selection: essential concepts and
com-mon misconceptions. Evol Educ Outreach. 2009;2:156–75. doi:10.1007/ s12052-009-0128-1.
Harrison XA. Using observation-level random effects to model overdispersion in count data in ecology and evolution. PeerJ. 2014;2:e616. doi:10.7717/ peerj.616.
Herron JC, Maruca S, Meir E. Genetic Drift and Bottlenecked Ferrets. Missoula: SimBio; 2014.
Holm S. A simple sequentially rejective multiple test procedure. Scand J Stat. 1979;6:65–70.
Leonard MJ, Kalinowski ST, Andrews TC. Misconceptions yesterday, today, and tomorrow. CBE Life Sci Educ. 2014;13:179–86. doi:10.1187/ cbe.13-12-0244.
Meir E, Perry J, Herron JC, Kingsolver J. College students’ misconceptions about evolutionary trees. Am Biol Teach. 2007;69:71–6.
Meir E, Perry J, Stal D, Maruca S, Klopfer E. How effective are simulated molecular-level experiments for teaching diffusion and osmosis? Cell Biol Educ. 2005;4:235–48. doi:10.1187/cbe.04-09-0049.
Miller K, Lasry N, Reshef O, Dowd J, Araujo I, Mazur E. Losing it: the influence of losses on individuals’ normalized gains. AIP Conf Proc. 2010;229:229–32. doi:10.1063/1.3515208.
National Research Council. Learning science through computer games and simulations. Washington, DC: National Academies of Science; 2011. NGSS Lead States. Next generation science standards: for states, by states.
Washington, DC: National Academies Press; 2013.
Perry J, Meir E, Herron JC, Maruca S, Stal D. Evaluating two approaches to helping college students understand evolutionary trees through diagramming tasks. CBE Life Sci Educ. 2008;7:193–201. doi:10.1187/ cbe.07-01-0007.
Price RM, Andrews TM, McElhinney TL, Mead LS, Abraham JK, Thanukos A, Perez KE. The genetic drift inventory: a tool for measuring what advanced undergraduates have mastered about genetic drift. CBE Life Sci Educ. 2014;13:65–75.
Price RM, Perez KE. Beyond the adaptationist legacy: updating our teach-ing to include a diversity of evolutionary mechanisms. Am Biol Teach. 2016;78:101–8. doi:10.1525/abt.2016.78.2.101.
R Core Team. R: A language and environment for statistical computing. Vienna: R Foundation for Statistical Computing; 2014.
Rutten N, van Joolingen WR, van der Veen JT. The learning effects of computer simulations in science education. Comput Educ. 2012;58:136–53. doi:10.1016/j.compedu.2011.07.017.
Smetana LK, Bell RL. Computer simulations to support science instruction and learning: a critical review of the literature. Int J Sci Educ. 2012;34:1337–70. doi:10.1080/09500693.2011.605182.
Sullivan GM, Feinn R. Using effect size—or why the P value is not enough. J Grad Med Educ. 2012;4:279–82. doi:10.4300/JGME-D-12-00156.1. The Carnegie Classification of Institutions of Higher Education. About
Carn-egie Classification; n.d. http://carnCarn-egieclassifications.iu.edu/. Accessed 28 Sept 2015.
Windschitl M, Andre T. Using computer simulations to enhance conceptual change: the roles of constructivist instruction and student epistemologi-cal beliefs. J Res Sci Teach. 1998;35:145–60.