Exploration of Distributed Image Compression and
Transmission Algorithms for Wireless Sensor Networks
https://doi.org/10.3991/ijoe.v15i01.9782
Fangzhou He
Criminal Investigation Police University of China, Shenyang, China [email protected]
Abstract—To prolong the life cycle of wireless sensor network, the basic theory of wavelet transform and its application in image compression are described, and several classic image compression algorithms based on wavelet transform are studied in depth. A compression algorithm combining the improved wavelet transform and Set Partitioning in Hierarchical Trees (SPIHT) algorithm of hierarchical wavelet tree set segmentation is proposed to effectively balance the energy consumption of each node in the sensor network and prolong the life of the whole wireless sensor network and an improved distributed image compression and transmission algorithm is proposed based on the distributed multi-node cooperative processing algorithm based on wavelet transformation, and detailed analytical test and energy consumption simulation experiment are carried out to verify the feasibility of the algorithm. The results show that the platform effectively implements and verifies the proposed algorithm, which can effectively realize the compression and transmission of distributed images, equalize the energy consumption of each sensor node in the network, and has strong practicability.
Keywords—Wavelet transform, wireless sensor network, Set Partitioning in Hierarchical Trees (SPIHT) algorithm
1
Introduction
information accordingly to obtain useful data. Wireless sensor network technology is widely used in medical, military, vehicle network, environmental detection and other fields due to its low cost, convenience, reliability and wide application scenarios.
From the perspective of data processing, the wireless sensor network describes a distributed database system with a large number of different functional sensor nodes centered on data. According to the routing protocol and the regulations of the operators in the network, each sensor node has a relatively clear division of labor. The collection node is responsible for sensing and collecting information of the monitoring area, and the processing node is responsible for collating and calculating the information collected by the collection node. The nodes that access the user interface provide a way for users to process data. Users can manually process the information collected by the entire sensor network through this node. As mentioned above, the sensing node is mainly used to collect data of the monitored target area and transmit data by means of wireless communication. The advancement of wireless communication and sensing science has promoted the rapid development of wireless sensor networks, and a large number of sensor nodes can self-organize to form a large-scale network. However, as the size of the network grows larger, the amount of information that needs to be transmitted is also increasing, especially the amount of multimedia information, making it impossible for energy-constrained sensor nodes to bear the overhead of data processing. Therefore, the research of distributed data processing is indispensable for the development of WSN.
The node arrangement of the wireless sensor network is usually dense, and the information redundancy between nodes is high. Unprocessed information with a large amount of data will increase the communication energy consumption of the node during transmission, waste valuable bandwidth of the network, cause congestion of the communication link, reduce data collection and transmission efficiency, reduce the timeliness of transmission, increase the complexity of the transmission, and reduce the life of the sensor node. Therefore, distributed image compression technology is particularly important when wireless sensor networks transmit large amounts of information such as multimedia information. Since most of the energy consumption of wireless sensor networks is for wireless data communications, the energy and time spent transmitting and receiving data per bit can be used to execute thousands of instructions in the sensor node processor. Therefore, when data is transmitted in the wireless sensor network, the collected data is generally compressed and transmitted first. Although the calculation amount of some sensor nodes is increased, the amount of data transmitted by the wireless is effectively reduced.
calculation task of a single node can be equally distributed to multiple nodes, which is beneficial to increase the life cycle of the entire network.
2
Literature Review
The low cost, high fault tolerance, random distribution and self-organization of wireless sensor networks make it impossible for the entire network to collapse due to the failure of some nodes. Therefore, wireless sensor networks have important scientific research value and broad application prospects in military activities, environmental detection, traffic supervision, and smart home.
Although compressing data in a wireless sensor network increases the computational pressure on the sensor nodes, Masoodhu et al. (2016) pointed out that compressing and retransmitting data can greatly reduce the communication task of the sensor network [1]. In addition, Zhou et al. (2016) also pointed out that in the case of slightly increasing the calculation of energy consumption, the communication energy consumption of the sensor nodes can be effectively reduced. Moreover, in the multi-hop transmission environment, the amount of energy reduction for compressing and retransmitting data is more obvious [2]. At the same time, Dar et al. (2016) pointed out in the research that the distributed compression processing method can effectively balance the energy consumption of the compressed data by a single node in multiple nodes when compressing data, which is beneficial to increase the life cycle of the whole network [3]. Cheng et al. (2016) studied the data stored in each node and found that each node can initiate, forward and respond to data query instructions. Through this distributed architecture, the central server task of the centralized architecture is balanced to multiple nodes, which can effectively balance the energy consumption of the entire network [4].
Chen et al. (2016) also pointed out that if this traditional database architecture is adopted in the wireless sensor network, the sensor nodes responsible for centralized storage management data will be overweight, and a single sensor node can’t afford the large amount of data storage tasks required by the central server [8]. Therefore, a database architecture based on a distributed processing system is usually adopted in a wireless sensor network.
In a large-scale network, each node only stores part of the data, and each node can initiate, forward, and respond to data query instructions. By means of this distributed architecture, the central server task of centralized architecture can be balanced to multiple nodes, which can effectively balance the energy consumption of the entire network. The key to the distributed database architecture is to solve the problem of how to improve the speed of sensor nodes responding to query instructions, how to efficiently store and transmit data in the network, and how to build more efficient indexing algorithms.
3
Methodology
3.1 SPIHT-based distributed image processing algorithm
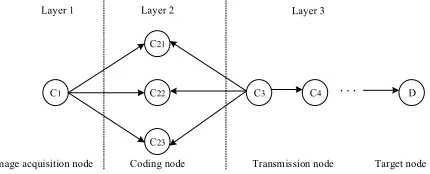
Combined with multi-node collaborative distributed image processing algorithm, an improved distributed image compression transmission algorithm is proposed for the problem of complex network structure, large energy consumption between nodes and unbalanced node energy consumption. The network structure of the algorithm is shown in Figure 1.
Fig. 1. Improved network structure diagram of distributed image compression transmission algorithm
Aiming at the problem of excessive communication energy consumption between algorithm nodes, the proposed algorithm has greatly improved the communication energy consumption. As shown in Figure 1, the proposed algorithm has a simple network structure. The first layer network has only one collection node, the second layer network has only coding nodes, and the third layer network has only transmission nodes and target nodes. Each layer network adopts a single-level network architecture with clear division of labor, simple network structure and easy maintenance. In the network structure of the algorithm, the data transmission in a single direction is adopted between the nodes, which effectively reduces the huge
C1 C22
C21
C23
C3 C4 ... D Layer 1 Layer 2 Layer 3
energy loss of a large amount of bidirectional data transmission in the entire wireless sensor network system in the algorithm. In the proposed improved algorithm, the tasks of each coding node in the second layer are consistent, which ensures the effective equalization of energy and improves the problem of uneven energy consumption of the algorithm nodes.
The SPIHT algorithm is used in each coding node of the second layer of the network to independently perform wavelet transform and coding on each block image data. The data amount of each block image is same, the compression coding parameters are consistent, and the amount of data received and sent by each node is also same. Therefore, the algorithm has the advantage of maintaining a high degree of consistency with the energy consumption of the coding nodes of the second layer network.
3.2 The quality evaluation criteria of selected image
Image quality evaluation methods include subjective quality evaluation methods and objective quality evaluation methods. The subjective quality evaluation method refers to the scoring of images to be evaluated by the experimenter within the scope of the predetermined evaluation scale. Since people are the most terminal to accept image information, and the subject of subjective quality evaluation method is human, from this perspective, subjective quality evaluation method can be considered as the most direct and reasonable image quality evaluation method. When the subjective quality evaluation method is used to obtain the evaluation of image quality, the subjective evaluation results of multiple experimental personnel are generally combined to perform weighted evaluation. When the amount of data is large enough, the subjective quality evaluation method can better evaluate the specific condition of the image quality. However, the subjective evaluation method will be affected by the personal factors of the experimenter, and it requires a large manpower and time. Therefore, in the scientific research, the subjective quality evaluation method is only used as a means to assist the objective quality evaluation method.
The objective quality evaluation method refers to calculating the image data with a mathematical formula to obtain an image quality score. Using the computer to evaluate and calculate the objective quality of the image through relevant definitions, it has the advantages of simple operation, time and labor saving, and objective stability. When evaluating image quality, objective quality evaluation methods are mainly used. The traditional image objective quality evaluation algorithm is mainly based on Mean Squared Error (MSE) and Peak Signal to Noise Ratio (PSNR).
circumstances, the common benchmark of PSNR is 30dB, and the picture distortion with PSNR value below 30dB is considered obvious.
MSE and PSNR are values obtained by comparing and calculating each pixel of two images. The advantage is that the algorithm is simple, objective and easy to understand. However, MSE and PSNR only perform pure error statistical calculation on the image, discard the constituent properties of the image, deviate from the visual characteristics of the human eye. When the image quality is evaluated by these two evaluation indicators, the results are sometimes inconsistent with the subjective quality evaluation.
4
Result
4.1 Energy loss model
The energy loss of wireless sensor networks is mainly concentrated in data acquisition, communication energy consumption, and data processing. There is little difference between the energy consumption of the data collected by the image acquisition node. Therefore, when analyzing the energy consumption of wireless sensor networks, it is generally focused on analyzing communication energy consumption and data processing energy consumption.
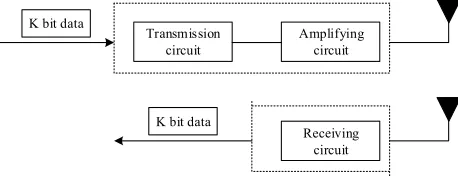
The First Order Radio Model is widely used in wireless sensor networks to measure energy loss. The FORM model is shown in Figure 2.
Fig. 2. Energy consumption model of sensor wireless receiving and transmitting FORM
4.2 Analysis of the relationship between node energy consumption and single hop average distance
The test image is a standard test image in the field of image processing, with a length of 512 pixels, a width of 512 pixels, and a pixel bit depth of 24 bits. The algorithm uses hierarchical wavelet tree set segmentation SPIHT algorithm based on wavelet transform to make 5 layers of wavelet transform before encoding the image. d represents the one-to-one average distance between the various sensor nodes in the wireless sensor network, and the compression ratio r is 8 and 32, that is, the bit rate is 1 bpp and 0.25 bpp.
Transmission
circuit Amplifying circuit K bit data
K bit data
Table 1. Relationship between node energy consumption (J) and single-hop average distance (m) at 1 bpp rate
Single-hop
distance Collection node Coding node Transmitted node Total energy consumption Centralized
5 0.33 0.29 0.08 3.94 3.22
10 0.38 0.29 0. 09 4.00 3.22
20 0.57 0.29 0.11 4.23 3.25
30 0.88 0.30 0.15 4.63 3.29
40 1.32 0.30 0.20 5.18 3.35
50 1.89 0.31 0.28 5.89 3.41
60 2.58 0.31 0.36 6.76 3.49
70 3.40 0.33 0.46 7.78 3.60
80 4.34 0.34 0.58 8.96 3.72
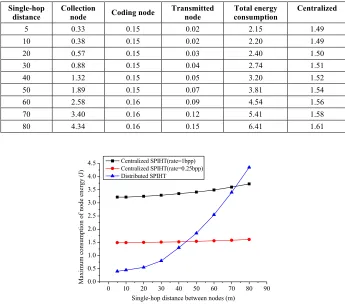
Table 2. Relationship between node energy consumption (J) and single-hop average distance (m) at 0.25 bpp rate
Single-hop
distance Collection node Coding node Transmitted node Total energy consumption Centralized
5 0.33 0.15 0.02 2.15 1.49
10 0.38 0.15 0.02 2.20 1.49
20 0.57 0.15 0.03 2.40 1.50
30 0.88 0.15 0.04 2.74 1.51
40 1.32 0.15 0.05 3.20 1.52
50 1.89 0.15 0.07 3.81 1.54
60 2.58 0.16 0.09 4.54 1.56
70 3.40 0.16 0.12 5.41 1.58
80 4.34 0.16 0.15 6.41 1.61
Fig. 3. Analysis of the relationship between maximum node energy consumption and single-hop transmission distance
0 10 20 30 40 50 60 70 80 90
0.0 0.5 1.0 1.5 2.0 2.5 3.0 3.5 4.0 4.5
Ma
xim
um c
onsum
pti
on of node
e
ne
rgy (
J)
Single-hop distance between nodes (m) Centralized SPIHT(rate=1bpp)
It can be concluded from Table 1 and Table 2 that in the distributed compression network and the centralized compression network, the collection nodes are the nodes with the largest energy consumption. At different bit rates, the energy consumption of the collection nodes in the distributed compression network is consistent. Therefore, in the distributed compression network and the centralized compression network, the data of the energy consumption of each collection node is used to draw the curve in Fig. 3 to analyze the relationship between the maximum node energy consumption and the single-hop transmission distance.
According to Table 1, Table 2 and Figure 3, the analysis is carried out:
First: the energy consumption of all sensor nodes increases as the average distance of a single hop increases.
In the proposed algorithm, the energy consumption of the collection node is higher than that of other functional nodes in the distributed network structure. When the average distance of a single hop of a node in a network increases, the rising speed of the energy consumption of the collecting node is also higher than that of other functional nodes. This is because the collection node undertakes the task of acquiring images, cutting images, and transmitting block images. The sum of the data amounts of the collection node transmitting the block image is equivalent to transmitting a whole original image, and the data transmission tasks of other function nodes are much lighter than the data transmission tasks of the collection node. Therefore, the energy consumption of the collection node is the largest energy consumption in the network structure of the algorithm, and it is also the node with the fastest increase as the transmission distance increases. When constructing the network structure of the algorithm in the application, the coding nodes should be densely deployed near the collection node to reduce the energy consumption required to transmit the original image data, and the transmission node can be deployed slightly sparsely to increase the coverage of the network.
Second: the energy consumption distribution of each node in distributed network is relatively average.
Third: The distributed network is suitable for wireless sensor networks where the collection nodes and coding nodes are densely deployed.
It can be concluded from Figure 3 that as the single-hop transmission distance increases, the energy consumption curve of the collection nodes in the distributed network rises faster. When the single-hop distance is large, the energy consumption of the collection nodes in the distributed structure network doesn’t have much advantage over the energy consumption of the collection nodes in the centralized network. Therefore, when the distance that the collection node needs to transmit data is too large, it does not make much sense to adopt a distributed network structure. However, the deployment of sensor network nodes is generally dense, so a sensor network with a distributed structure will help to extend the network life cycle. The distributed network architecture is suitable for wireless sensor networks where collection nodes and coding nodes are densely deployed.
4.3 Analysis of the relationship between network energy consumption and transmission hops
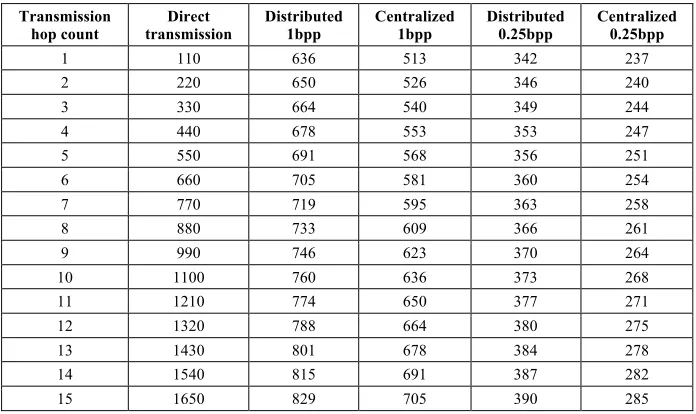
Take the average single-hop distance of the node as 10 meters. Table 4-18 shows how the total network energy consumption varies with the number of transmission hops. Compare the way of directly transmitting images, such as distributed SPIHT compression transmission at 1 bpp, the centralized SPIHT compression transmission at 1 bpp, the distributed SPIHT compression transmission at 0.25 bpp, and the centralized SPIHT compression transmission at 0.25 bpp. When calculating a 512 × 512 24-pixel bit depth color image in different ways, the energy consumption per bit is shown in Table 4-18. A line chart drawn by Table 3 is shown in Figure 4.
Table 3. Energy consumption per bit (nJ/bit) transmitted in different ways Transmission
hop count transmission Direct Distributed 1bpp Centralized 1bpp Distributed 0.25bpp Centralized 0.25bpp
1 110 636 513 342 237
2 220 650 526 346 240
3 330 664 540 349 244
4 440 678 553 353 247
5 550 691 568 356 251
6 660 705 581 360 254
7 770 719 595 363 258
8 880 733 609 366 261
9 990 746 623 370 264
10 1100 760 636 373 268
11 1210 774 650 377 271
12 1320 788 664 380 275
13 1430 801 678 384 278
14 1540 815 691 387 282
Table 3 and Figure 4 show that the energy consumption of the centralized compressed transmission network structure is lower than that of the distributed compressed transmission network structure at the same code rate. Because the centralized compression transmission method does not involve the transmission of the original image data, the collection node of the distributed network architecture needs to block the original image into the coding node. Therefore, the total energy consumption of the distributed compression network is more than that of the centralized compression network. It is expressed in the aspects where the collection node sends the original image and the coding node receives the block image. However, the overall lifetime of a wireless sensor network is limited by the lifetime of the collection node. From the previous analysis, it can be known that the energy consumption of the collection nodes in the distributed network architecture is far less than the energy consumption of the collection nodes of the centralized network architecture, so the distributed compression network architecture is adopted. The compression energy of the collection node can be equalized to multiple coding nodes in the second layer. The advantage of using the architecture is that the lifetime of the collection node can be effectively extended, thereby extending the life cycle of the entire wireless sensor network.
Fig. 4. Data consumption per bit image transmitted in different ways (nJ/bit)
It can be seen from Fig. 4 that the initial energy consumption value of the direct transmission original image mode is the smallest when the single-hop is used, and then the line with the larger slope always increases rapidly with the increase of the number of hops. However, the initial energy consumption value of the curve with the distributed structure and the centralized structure is larger than that of the direct transmission original image mode, and the rising speed is slow. It can be seen from Figure 4, the slope of the line in the figure is the energy consumption required to transmit each bit of data to the single-hop distance. The amount of data after compression is smaller than the amount of original image data. The smaller the bpp,
0 2 4 6 8 10 12 14 16
0 200 400 600 800 1000 1200 1400 1600 1800
Tota
l e
ne
rgy c
onsumpt
ion (nJ/bi
t)
The number of hops from the source node to the destination node
Direct transmission Distributed SPIHT(rate=1bpp) SPIHT(rate=1bpp)
the smaller the data that needs to be transmitted. Therefore, the slope of the line in the figure from large to small is: direct transmission of the original image > bpp = 1 > bpp = 0.5.
The method of directly transmitting the original image transmits a large amount of data, but it avoids the energy consumption of the compression coding, so the initial energy consumption value is small, and the energy consumption increases rapidly. By adopting the method of first compressing and then transmitting, the amount of data that needs to be transmitted per hop is small, but at the beginning, it takes energy to compress and encode. Therefore, the initial energy consumption value is large, and the energy consumption growth is slow. Wireless sensor network nodes are generally densely arranged. Generally, multi-hop transmission data is required, and the larger the hop count, the more obvious the advantage of energy consumption in terms of compression and retransmission.
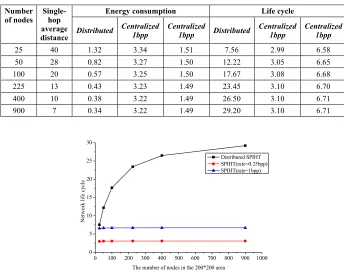
4.4 Analysis of relationship between network life cycle and node density Sensor nodes of the number 25, 50, 100, 225, 400, and 900 are evenly arranged in an area of 200 m × 200 m. It is assumed that each node has an initial energy of 10J and there is only one acquisition node configured with a camera in the network, and if the energy of the collection node in the network is exhausted, the network can’t collect and transmit images. The network life cycle of centralized compression processing and distributed compression processing is compared at bit rates of 1 bpp and 0.5 bpp. The network life cycle of different transmission modes under different node numbers is shown in Table 4 and Figure 5.
Since the collection nodes of the distributed network structure do not participate in image compression, the energy consumption of the collection nodes of the distributed network structure is the same when different code rates are used. It can be seen from Table 4 that the more nodes in the area, the denser the node distribution, the smaller the average single-hop distance between nodes, the smaller the energy consumption of the collection nodes in distributed network structure and centralized network structure. However, the energy consumption of the collection nodes in the distributed network structure becomes smaller. This is because the energy consumption of the collection node in the distributed network structure is mainly the communication energy consumption, and the energy consumption of the collection node in the centralized network structure is mainly composed of the compression coding energy consumption. Therefore, when the single-hop average distance between nodes decreases, the communication energy consumption of the network decreases, and the life cycle of the distributed network structure increases much more than centralized. The more nodes, the denser the node distribution, the more obvious the life cycle advantage of the distributed network structure compared to the centralized network structure. When the code rate is lbpp and the number of sensor nodes is 900, the network life cycle of the distributed network structure is about 9.4 times that of the centralized network structure.
network structure needs to undertake the tasks of image acquisition transmission and compression coding at the same time. However, the collection node in the distributed network structure does not involve the task of compression coding. Therefore, the network lifetime of a centralized network architecture will decrease as the code rate increases. However, because the data processing coding energy consumption caused by the code rate change does not affect the energy loss of the acquisition node in the distributed network structure, the life cycle of the distributed network structure is not affected by the selected code rate.
Table 4. Energy consumption (nJ/bit) and network life cycle of different transmission modes under different node numbers
Number of nodes Single-hop
average distance
Energy consumption Life cycle
Distributed Centralized 1bpp Centralized 1bpp Distributed Centralized 1bpp Centralized 1bpp
25 40 1.32 3.34 1.51 7.56 2.99 6.58
50 28 0.82 3.27 1.50 12.22 3.05 6.65
100 20 0.57 3.25 1.50 17.67 3.08 6.68
225 13 0.43 3.23 1.49 23.45 3.10 6.70
400 10 0.38 3.22 1.49 26.50 3.10 6.71
900 7 0.34 3.22 1.49 29.20 3.10 6.71
Fig. 5. Network life cycle with different transmission methods under different node numbers
5
Conclusion
In the traditional centralized network structure, the image is directly compressed by the collection node. Although the data transmission volume of the network is effectively reduced and the communication energy consumption is reduced. It also causes the energy consumption of the collection node to be too large, and the energy consumption will be exhausted too early than other functional nodes in the network. The distributed image compression technology can balance the computational energy
0 100 200 300 400 500 600 700 800 900 1000 0
5 10 15 20 25 30
Ne
twork life
c
yc
le
The number of nodes in the 200*200 area
consumption of the collection nodes in the centralized network structure to the peripheral nodes, and effectively reduce the energy consumption of the collection nodes. The improved distributed image compression transmission algorithm is superior in simplifying the network structure of the traditional distributed image compression algorithm. While reducing the energy consumption of the collection node, it also reduces the communication energy consumption of other functional nodes, effectively reducing the energy consumption of the entire wireless sensor network system, reducing the network complexity, and improving the efficiency of the network processing images.
6
References
[1]Masoodhu, B. N. M., Sujatha, S., & Pathan, A. S. K. (2016). Skip block based distributed source coding for hyperspectral image compression. Multimedia Tools & Applications, 75(18): 11267-11289. https://doi.org/10.1007/s11042-015-2852-6
[2]Zhou, W., Sun, L., Guo, J., & Liu, L. (2016). Image compression scheme based on pca for wireless multimedia sensor networks. The Journal of China Universities of Posts and Telecommunications, 23(1): 22-30. https://doi.org/10.1016/S1005-8885(16)60004-3 [3]Dar, Y., Bruckstein, A. M., Elad, M., & Giryes, R. (2016). Postprocessing of compressed
images via sequential denoising. IEEE Transactions on Image Processing, 25(7): 3044. https://doi.org/10.1109/TIP.2016.2558825
[4]Cheng, C., Wang, S., Yang, Y., & Yang, Y. (2016). A multilayer improved rbm network based image compression method in wireless sensor networks. International Journal of Distributed Sensor Networks, 2016(2): 15. https://doi.org/10.1155/2016/1851829
[5]Balouchestani, M., & Krishnan, S. (2016). Advanced k-means clustering algorithm for large ecg data sets based on a collaboration of compressed sensing theory and k-svd approach. Signal Image & Video Processing, 10(1): 113-120. https://doi.org/10.1007/s117 60-014-0709-5
[6]Sanli, O., Korpeoglu, I., & Yazici, A. (2016). Rule-based inference and decomposition for distributed in-network processing in wireless sensor networks. Knowledge & Information Systems, 50(1): 1-34.
[7]Elsayed, S., Elsabrouty, M., Muta, O., & Furukawa, H. (2016). Distributed perceptual compressed sensing framework for multiview images. Electronics Letters, 52(10): 821-823. https://doi.org/10.1049/el.2016.0477
[8]Chen, J., Wang, N., Xue, F., & Gao, Y. (2016). Distributed compressed video sensing based on the optimization of hypothesis set update technique. Multimedia Tools & Applications, 76(14): 1-20.
7
Author
Fangzhou is a Researcher of Criminal Investigation Police University of China, His research interests include Cloud Computing.