Numerous studies have indicated associations between exposure to ambient air pollution and adverse pregnancy outcomes. Such asso-ciations, if determined to be causal, are likely to result in significant public health impacts given the widespread exposure to air pollu-tion and the fact that low birth weight (LBW) or preterm births are subsequently associated with long-term sequelae such as developmental disability and chronic lung disease (Cano et al. 2001; Dik et al. 2004). Determination of a causal relationship between air pollution and adverse pregnancy outcomes would have implications for burden of disease measures and add to the impor-tance of strategies to mitigate the health effects of air pollution exposure.
Previous studies have been reviewed in detail. Sˇrám et al. (2005) concluded that evi-dence is sufficient to support a causal associa-tion between ambient concentraassocia-tions of particulate matter and LBW, but evidence of effects for other pollutants and for other out-comes such as preterm birth is less robust. Maisonet et al. (2004) concluded that studies to date support small effects of air pollution on preterm birth and small for gestational age birth (SGA), but not full-term LBW. In a
systematic review, Glinianaia et al. (2004) suggested that evidence of associations with air pollution and fetal growth or pregnancy dura-tion is limited and inconclusive and argued for population-based cohort designs using high-quality individual exposure estimates. These reviews highlight the difficulties in interpret-ing an evidence base with differences among methods and with important limitations. First, most studies are either time-series stud-ies (Dugandzic et al. 2006; Liu et al. 2003, 2007; Mannes et al. 2005; Sagiv et al. 2005) that relate relatively short-term changes in air pollution concentrations to temporal changes in rates of adverse pregnancy outcomes or, less frequently, cohort analyses that compare out-comes between locations with differing levels of ambient air pollution (Salam et al. 2005) based on interpolated ambient monitoring network data. Between-city comparisons are subject to potential confounding because covariates may be highly correlated with air pollution, whereas time-series studies are problematic to interpret because they relate short-term changes in air pollution that are driven primarily by meteorology to outcomes. They inherently assume that the impact of air pollution on birth outcomes is acute, require
knowledge of the relevant periods of pregnancy during which air pollution may have impacts, and are subject to potential confounding by seasonally varying factors. As reviewed by Glinianaia et al. (2004), a number of studies have suggested stronger relationships between birth outcomes and exposure during specific periods of pregnancy based on comparison of statistical effect sizes. However, results across studies have not consistently identified specific periods of exposure that are most closely linked to adverse pregnancy outcomes.
Increasingly, air pollution researchers have identified important spatial variability in air pollution concentrations within airsheds (Hoek et al. 2002b; Lewne et al. 2004; Zhang et al. 2004; Zhu et al. 2004). In many situa-tions these contrasts are of greater magnitude than between-city or temporal contrasts (Jerrett et al. 2005). Such spatial contrasts, primarily related to measures of proximity to traffic corridors, have been associated with a number of health impacts including mortality (Hoek et al. 2002a; Maynard et al. 2007; Miller et al. 2007; Nafstad et al. 2004; Roemer and van Wijnen 2001), asthma and respiratory symptoms (Bayer-Oglesby et al. 2006; Brauer et al. 2002, 2007; Gauderman et al. 2005, 2007; McConnell et al. 2006; Ryan et al. 2005; Smargiassi et al. 2006), and otitis media (Brauer et al. 2006).
Application of within-airshed spatial con-trasts in birth outcome studies are few (Leem et al. 2006; Parker et al. 2005; Ritz and Yu 1999; Ritz et al. 2000; Slama et al. 2007; Wilhelm and Ritz 2003, 2005). These stud-ies, though provocative, have been limited largely to Southern California—a metropoli-tan area with relatively high levels of ambient air pollution. They relied on interpolated ambient monitoring data or simple road
Address correspondence to M. Brauer, School of Environmental Health, The University of British Columbia, 2206 East Mall, Vancouver BC V6T1Z3 Canada. Telephone: (604) 822-9585. Fax: (604) 822-9588. E-mail: brauer@interchange.ubc.ca
The research was supported in part by Health Canada via an agreement with the British Columbia Centre for Disease Control to the Border Air Quality Study. Additional support was provided by the Center for Health and Environment Research at The University of British Columbia, funded by the Michael Smith Foundation for Health Research. M.K. was supported in part by a Michael Smith Foundation for Health Research Scholar Award.
The authors declare they have no competing financial interests.
Received 4 October 2007; accepted 22 January 2008.
A Cohort Study of Traffic-Related Air Pollution Impacts on Birth Outcomes
Michael Brauer,1Cornel Lencar,1Lillian Tamburic,2Mieke Koehoorn,1,3Paul Demers,1,3and Catherine Karr41School of Environmental Health, 2Centre for Health Services and Policy Research, and 3Department of Health Care and Epidemiology,
The University of British Columbia, Vancouver, British Columbia, Canada; 4Department of Pediatrics, University of Washington, Seattle,
Washington, USA
BACKGROUND:Evidence suggests that air pollution exposure adversely affects pregnancy outcomes.
Few studies have examined individual-level intraurban exposure contrasts.
OBJECTIVES:We evaluated the impacts of air pollution on small for gestational age (SGA) birth weight, low full-term birth weight (LBW), and preterm birth using spatiotemporal exposure metrics.
METHODS:With linked administrative data, we identified 70,249 singleton births (1999–2002) with complete covariate data (sex, ethnicity, parity, birth month and year, income, education) and maternal residential history in Vancouver, British Columbia, Canada. We estimated residential exposures by month of pregnancy using nearest and inverse-distance weighting (IDW) of study area monitors [carbon monoxide, nitrogen dioxide, nitric oxide, ozone, sulfur dioxide, and partic-ulate matter < 2.5 (PM2.5) or < 10 (PM10) µm in aerodynamic diameter], temporally adjusted land
use regression (LUR) models (NO, NO2, PM2.5, black carbon), and proximity to major roads.
Using logistic regression, we estimated the risk of mean (entire pregnancy, first and last month of pregnancy, first and last 3 months) air pollution concentrations on SGA (< 10th percentile), term LBW (< 2,500 g), and preterm birth.
RESULTS:Residence within 50 m of highways was associated with a 26% increase in SGA [95%
confidence interval (CI), 1.07–1.49] and an 11% (95% CI, 1.01–1.23) increase in LBW. Exposure to all air pollutants except O3was associated with SGA, with similar odds ratios (ORs)
for LUR and monitoring estimates (e.g., LUR: OR = 1.02; 95% CI, 1.00–1.04; IDW: OR = 1.05; 95% CI, 1.03–1.08 per 10-µg/m3increase in NO). For preterm births, associations were observed
with PM2.5for births < 37 weeks gestation (and for other pollutants at < 30 weeks). No consistent
patterns suggested exposure windows of greater relevance.
CONCLUSION:Associations between traffic-related air pollution and birth outcomes were observed in a population-based cohort with relatively low ambient air pollution exposure.
proximity measures rather than high-resolu-tion spatial contrasts in concentrahigh-resolu-tions. We sought to assess the relationship between repro-ductive outcomes and spatial and temporally varying levels of air pollution in the metropoli-tan area of Vancouver, British Columbia, Canada, a city with relatively low levels of ambient air pollution. We estimated exposures at the individual level, for a population-based cohort using both monitor-based methods and land use regression models based on proximity to traffic sources, land use, population density, and topographic features. Even in Vancouver, an area with a dense ambient monitoring net-work, exposure assessment based on regulatory monitoring network data is more suited to characterizing temporal variability. Land use regression models, even those with temporal components, as in this analysis, focus on high-resolution spatial variability in air pollutant concentrations.
The literature describing associations between air pollution and birth outcomes has focused on clinically defined outcomes of LBW and preterm birth, defined in a variety of ways, which complicates comparisons. The underlying biological processes—fetal growth restriction and inadequate gestational length— are incompletely understood and imperfectly represented in routinely available perinatal measurements available in vital statistic records. We elected to focus on SGA births as a primary outcome measure, because birth weight as a function of gestational age has a direct effect on perinatal morbidity and mor-tality (Pollack and Divon 1992).
LBW may result from complex and multi-ple pathways of fetal growth restriction attrib-uted to maternal, fetal, or placental factors. Three broad categories of biological factors have been suggested to play a role in inadequate fetal gestation: abnormality of the biological clock, abnormal implantation, and infection and inflammation (Mattison et al. 2003).
The current theories provide multiple sites at which environmental factors may influence biological factors to modulate fetal growth and induce preterm birth. However, specific toxicologic mechanisms including rel-evant timing during gestational development are not known. We explored each of these processes, fetal growth restriction and inade-quate gestational length, separately, and explored the influences of exposure timing in early and late pregnancy.
Methods
Cohort. The study area is the greater Vancouver metropolitan region. We constructed the cohort by extracting data from a series of linked administrative data sets obtained from the British Columbia Ministry of Health, the British Columbia Vital Statistics Agency, and the British Columbia Perinatal Database
Registry. Health data are available through an approved process (Chamberlayne et al. 1998) via the British Columbia Linked Health Database for research purposes and governed by a data access agreement between the researchers and the data stewards. Medical services and hospitalization data were provided and gov-erned by the Ministry of Health, Government of British Columbia; and vital statistics data by the British Columbia Vital Statistics Agency. These data were further merged through an additional data access agreement with records in the provincial perinatal database governed by the British Columbia Reproductive Care Program. The study protocol was approved by the Institutional Review Board (Behavioural Research Ethics Board) of The University of British Columbia. Briefly, we identified vital statistics records for 92,158 children born in the study area during a 4-year period (1999–2002); 77,342 had mothers with veri-fied complete residential history within the study area during the 9 months of pregnancy. Exclusions were made for 976 multiple births, 8 children with no recorded birth weight or parity status, 2,998 with missing maternal age, 1,691 with a missing native status (ethnicity) indicator, and 1,420 who were missing specific census covariates (neighborhood income, maternal education) of interest. From the 77,342 with residential history in the study area, these exclusions left 70,249 subjects (90.8%) for analyses. Additional subjects were excluded from specific (monitoring network-based) analyses if measurements were not avail-able for suitably proximal monitors.
Residential history. We compiled mater-nal residential histories from the beginning of pregnancy until birth from postal codes and associated dates recorded in provincial health plan registry files, and from all hospital dis-charge and physician billing records for each mother. Approximately 10% of the compiled records included invalid or nonresidential (including urban post office boxes) postal codes and were excluded from the residential history assignment. For each subject a longitu-dinal residential history was constructed from the remaining data. Where changes in postal codes were observed during the follow-up period, transitions were set as the midpoint between dates if nonoverlapping, or at the first date of the next postal code if overlapping.
Administrative data sources. Birth weight and duration of gestation. We used vital statis-tics records to identify SGA births, defined as those with birth weights below the 10th per-centile of the cohort, stratified by sex, for each week of gestation. LBW at term were those with at least 37 weeks gestation and birth weight < 2,500 g, and preterm births were those with < 37 weeks duration of gestation, as indicated on the vital statistics birth records. Subgroup analyses were conducted for births of
< 30, 30–34, and 35–37 weeks gestation and for birth weights below the 5th percentile of the cohort for each week of gestation.
Covariates. For each mother we also col-lected available data for several covariates of interest that may be associated with the health outcomes. Sex, parity, and the month and year of birth were available from Vital Statistics records. First Nations (“status Indians”) status of the baby was obtained for each individual from hospital discharge records. Maternal age and maternal smoking during pregnancy was obtained from Perinatal Database Registry files that were linked to each individual birth record. Because no individual-level data were available for income and maternal level of edu-cation, we assigned subjects to neighborhood-level income quintiles and maternal education quartiles using Census data based on their resi-dence at the resolution of the census dissemi-nation area (DA). Dissemidissemi-nation areas are the smallest geographic areas for which all Canadian Census data are disseminated and corresponds to one or more neighboring blocks with target populations of 400–700 persons (Puderer 2001).
Air pollution. Monitoring network data.
Exposure to air pollution for each cohort member was assigned by three different approaches, two based on the regulatory mon-itoring network and one based on dedicated sampling campaigns. The regulatory monitor-ing network was operated by the British Columbia Ministry of Environment and Metro Vancouver and includes daily measurements at 24 monitors for ozone, 22 for nitric oxide/ nitrogen dioxide, 14 for sulfur dioxide, 19 for carbon monoxide, 19 for particulate matter < 10 µm in aerodynamic diameter (PM10), and 7 for PM < 2.5 µm in aerodynamic diameter (PM2.5). The monitoring data were assigned to individuals at their 6-digit postal code of resi-dence. The 6-digit postal code typically cor-responds to one block-face in urban areas; areas may be considerably larger in rural areas with low population density.
air monitoring data or if there were > 10 missing days in a given month. Using the monthly averages, we then computed mean exposures for each mother for the full dura-tion of pregnancy, the first and last 30 days of pregnancy, and the first and last 3 months of pregnancy. Exposures were updated with change in postal code of residence and weighted by time spent in multiple resi-dences. Postal code information for mothers was obtained from the provincial health regis-tration and health care contact records.
Land use regression model. Exposure assessment based on a land use regression (LUR) model developed for the study region (Henderson et al. 2007) provided improved local spatial resolution. Briefly, 116 passive samplers to collect NO and NO2 were deployed for two 14-day periods at 116 sites in the study area. Mean concentrations dur-ing these two periods were highly correlated with and closely approximated annual aver-ages from regulatory monitoring network data. In addition, PM2.5mass was measured once at a subset of 25 locations during a 2-month sampling period. Integrated 1-week average PM2.5 samples were collected on Teflon (Teflo; Pall Corp., East Hills, NY, USA) filters using Harvard Impactors (Air Diagnostics and Engineering, Harrison, ME, USA) at a flow rate of 4 L/min. Five sampling units were rotated between the 25 sites and one was collocated with a tapered element oscillating microbalance (TEOM; Thermo Electron Corp., East Greenbush, NY, USA) sampler at a regulatory monitoring network station. For a subset of 39 sites, we measured short-term levels of particle absorbance (black carbon) on one occasion using a particle soot absorption photometer (Radiance Research, Seattle, WA, USA) in a mobile monitoring platform. These measurements were adjusted
for temporal variation based on repeated measurements at a centrally located site to result in estimated annual average concentra-tions. We have previously demonstrated strong correlations (R2 0.7–0.8) (Noullett et al. 2006; Rich 2003) between particle absorbance and traditional measurements of elemental carbon (Cyrys et al. 2003).
For each of the 116 (and the subsets of 25 and 39) measurement sites, 55 variables were generated in a geographic information system (GIS) (ArcGIS; ESRI, Redlands, CA, USA), and linear regression models of NO, NO2and black carbon were built with the most predic-tive covariates. For NO, the model had an R2of 0.62 and included the number of major roads within 100-m and 1,000-m radius circular buffers of the measurement sites, the number of secondary roads within a 100-m buffer, the population density within a 2,500-m radius, and elevation. For NO2, the model (R2= 0.56) included the same variables as well as the amount of commercial land use within 750 m. For PM2.5the model (R2= 0.52) included the amount of commercial and industrial land use within 300 m, the amount of residential land use within 750 m, and elevation. For black car-bon the model (R2= 0.56) included the num-ber of secondary roads within a 100-m buffer, distance to the nearest highway, and the amount of industrial land use within 750 m. Evaluations, based on comparison to additional measurements and cross-validation analysis, indicated that the PM2.5 and black carbon models performed much more poorly than did the NO or NO2models. Using the LUR mod-els, smooth spatial surfaces of predicted (annual average) concentrations were generated for the entire study area at a resolution of 10 m. The surfaces were then smoothed (Focal Statistics, ArcGis Spatial Analyst; ArcGIS) to remove abrupt changes and edge effects so as to more
accurately reflect the measured effect of proxim-ity to roadways (Gilbert et al. 2003). For each LUR model, the corresponding monitoring network data for each pollutant were fit with a monthly dummy variables and a covariate for linear trend (Times Series Forecasting System, version 9; SAS Institute Inc., Cary, NC, USA). For black carbon, the PM2.5trend was used because there were no corresponding regulatory monitoring network data. From these models, we applied month–year adjustment factors to each surface to estimate monthly average con-centrations. Using these, we then computed individual subject exposures for the same exposure windows as described above for the monitor-based approaches.
Road proximity. Finally, we calculated road proximity for home postal codes of all cohort members. Road classifications (DMTI ArcView street file data set for British Columbia, Canmap Streetfiles, version 2006.3; DMTI Spatial, Markham, Ontario, Canada) were used to determine whether a home postal code was within 50 or 150 m of an expressway or primary highway, within 50 or 150 m of a secondary highway or major road/arterial road, or within 150 m of a secondary highway or major road or within 50 m of an expressway or primary highway.
Results
Of the 70,249 live births considered in analy-sis, 36,138 (51.4%) were male and 542 (0.77%) had First Nations status indicated. Mean parity was 1.8 and the mean maternal age was 31.1 years. A total of 7.4% (5,198) of the cohort reported maternal smoking during pregnancy. The mobility of the cohort as ascertained from residential histories indicated that 60.7% (42,649) had a single address dur-ing pregnancy, whereas 34.9% (24,537) had two addresses, and 4.4% (3,063) had three to five addresses. 89.2% of the postal codes were referenced to a block face, and an additional 8.5% referenced to a block.
As expected for the greater Vancouver area, air pollution concentrations were low relative to air quality standards and international guidelines (Table 1). Mean concentrations and ranges at the middle of the concentration dis-tributions were similar for the monitor-based and the LUR estimates. As expected, the LUR estimates had smaller minimum and greater maximum values than the IDW estimates.
Table 2.Prevalence of SGA, LBW, and preterm birth in the cohort (n= 70,249).
Outcome No. (%)
SGA (< 10th percentile) 6,939 (10.4) LBW (< 2,500 g at ≥ 37 weeksa) 894 (1.3)
Gestation < 37 weeks 3,748 (5.3) Gestation < 35 weeks 820 (1.2) Gestation < 30 weeks 170 (0.2)
an = 66,501 births at full (≥37 weeks) term. Table 1. Distributions of air pollution concentrations estimated by different approaches.
Pollutant Model Mean Min Max IQR
NO Nearest 23.7 0.5 93.3 14.3
NO IDW 22.1 2.9 63.6 14.9
NO LUR 30.7 1.4 145.5 14.4
NO2 Nearest 34.4 9.7 63.8 9.3
NO2 IDW 32.5 15.3 53.6 11.3
NO2 LUR 31.6 0.0 63.8 9.3
CO Nearest 633.1 124.3 1,409.0 194.7
CO IDW 613.8 305.4 1,062.3 172.1
PM2.5 Nearest 5.3 0.3 37.0 1.0
PM2.5 IDW 5.1 1.0 7.6 1.1
PM2.5 LUR 4.0 0.0 11.3 1.5
BC LUR 1.6 0.0 6.2 1.2
PM10 Nearest 12.7 5.6 35.4 1.6
PM10 IDW 12.5 8.4 16.6 1.4
SO2 Nearest 5.7 0.0 24.9 3.5
SO2 IDW 5.3 0.3 17.8 3.0
O3 Nearest 28.0 2.3 69.2 8.2
O3 IDW 28.3 10.4 48.2 8.4
Correlations between IDW estimates of CO, NO, NO2, and SO2were all > 0.8 and negatively correlated with O3(r= –0.7 to –0.8). Correlations between LUR estimates CO, NO, NO2, SO2and PM10or PM2.5 were lower (r= 0.1 to 0.5). Correlations for the same pollutant between IDW and LUR estimates were moderate (r= 0.55 for NO, 0.37 for NO2) except for the LUR PM2.5 esti-mates, which were not correlated with IDW estimates of either PM2.5or PM10. IDW and nearest monitor estimates for the same pollu-tant were all highly correlated (r= 0.70 to 0.89). Given these high correlations, and because the nearest monitor exposure estimates displayed sharp spatial patterns in exposure related to monitor location (Marshall et al. 2008), we focused on the IDW estimates.
Exposures estimated for various periods of pregnancy were, in general, highly correlated with the full term of pregnancy average expo-sure, limiting our ability to assess the impact of exposure during specific windows of pregnancy. Correlations between exposure during the first or last 3 months of pregnancy and the full term of pregnancy were 0.63–0.89 for IDW esti-mates of gaseous pollutants, 0.48–0.64 for IDW estimates of PM, and 0.59–0.94 for LUR estimates.
Table 2 presents the prevalence of SGA, LBW at term, and preterm births in the cohort. As reported by others (Ghosh et al. 2007), we observed higher rates of SGA for females (104.9 vs. 103.6 per 1,000 live births) and higher rates of preterm birth for males (56.9 vs. 49.6 per 1,000 live births).
For NO, NO2, CO, PM10, PM2.5, and black carbon we observed small but consistent increased risks of SGA (Table 3). Odds ratios (ORs) for exposure estimates based on the nearest monitor approach were similar to those for the inverse distance weighted estimates [e.g., for NO, OR = 1.03; 95% confidence interval (CI), 1.01–1.05 for nearest, vs. OR = 1.05; 95% CI, 1.03–1.08 for IDW] and are therefore not presented further in the analysis. Because O3was highly negatively correlated with all of the primary traffic-related air pollu-tants (r= –0.83 for IDW CO; r= –0.86 for IDW NO), associations were largely protective (e.g., OR = 0.89; 95% CI, 0.84–0.94 for IDW SGA) and are not presented further.
Although our prior expectations were that LUR exposure assessments would provide increased precision and variability of individ-ual exposure, associations were not consis-tently larger for the LUR estimates, although their CIs were smaller in most cases. Similar results (not shown) were found for the subset of SGA births with birth weights below the 5th percentile of the cohort for each week of gestation. We did not observe (results not shown) any consistent patterns indicating larger effect estimates for exposures during
specific periods of pregnancy. ORs for early (first month, first 3 months) or late pregnancy (last month, last 3 months) exposure windows were remarkably similar to those for the full duration of pregnancy. Similar patterns were observed for LBW (Table 4), although
associations, except for IDW NO2, did not reach statistical significance because of the smaller number of LBW cases.
Tables 5 and 6 present the analysis of the simple road proximity measures. In contrast to the LUR models that indicated a small
Table 3.Crude and adjusted ORsafor SGA.
Exposure (entire pregnancy) SGA cases (n) Crude OR (95% CI) AdjustedbOR (95% CI)
NO–IDW (10 µg/m3) 6,351 1.03 (1.00–1.05) 1.05 (1.03–1.08)
NO–LUR (10 µg/m3) 6,750 1.02 (1.01–1.04) 1.02 (1.00–1.04)
NO2–IDW (10 µg/m3) 6,351 1.12 (1.08–1.16) 1.14 (1.09–1.18)
NO2–LUR (10 µg/m3) 6,750 1.02 (0.99–1.05) 0.99 (0.96–1.02)
CO–IDW (100 µg/m3) 6,351 1.03 (1.01–1.05) 1.06 (1.03–1.08)
PM2.5–IDW (1 µg/m3) 6,307 0.99 (0.97–1.01) 1.02 (0.98–1.05)
PM2.5–LUR (1µg/m3) 6,750 1.03 (1.02–1.05) 1.02 (1.00–1.03)
BC–LUR (10–5/m) 6,750 1.03 (1.01–1.05) 1.01 (0.99–1.03)
PM10–IDW (1 µg/m3) 6,351 1.02 (1.00–1.05) 1.02 (0.99–1.05)
SO2–IDW (1 µg/m3) 6,351 1.01 (1.00–1.02) 1.01 (1.00–1.02)
BC, black carbon.
aORs per standardized increases (indicated in parentheses), roughly corresponding to interquartile range. bAdjusted for
infant sex, First Nations status, parity, maternal age, maternal smoking during pregnancy, month–year of birth, income (quintile-census), maternal education (quartile-census).
Table 4.Crude and adjusted ORsafor LBW at full (≥37 weeks) term.
Exposure (entire pregnancy) LBW cases (n) Crude OR (95% CI) AdjustedbOR (95% CI)
NO–IDW (10 µg/m3) 894 1.02 (0.96–1.09) 1.03 (0.96–1.10)
NO–LUR (10 µg/m3) 874 1.02 (0.98–1.08) 1.01 (0.96–1.07)
NO2–IDW (10 µg/m3) 894 1.12 (1.02–1.23) 1.11 (1.01–1.23)
NO2–LUR (10 µg/m3) 874 1.01 (0.94–1.09) 0.97 (0.89–1.05)
CO–IDW (100 µg/m3) 894 1.02 (0.96–1.07) 1.02 (0.96–1.09)
PM2.5–IDW (1 µg/m3) 889 0.98 (0.92–1.06) 0.98 (0.92–1.05)
PM2.5–LUR (1µg/m3) 874 1.05 (1.02–1.09) 1.03 (0.99–1.07)
BC–LUR (10–5/m) 874 1.03 (0.97–1.09) 1.00 (0.95–1.07)
PM10–IDW (1 µg/m3) 894 1.01 (0.95–1.08) 1.01 (0.95–1.08)
SO2–IDW (1 µg/m3) 894 1.00 (0.97–1.02) 0.99 (0.97–1.02)
BC, black carbon.
aORs per standardized increases (indicated in parentheses), roughly corresponding to interquartile range. bAdjusted for
infant sex, First Nations status, parity, maternal age, maternal smoking during pregnancy, month–year of birth, income (quintile-census), maternal education (quartile-census).
Table 5.Crude and adjusted ORs for SGA and road proximity.
No. of SGA cases
Measure (% of total subjects) Crude OR (95% CI) AdjustedaOR (95% CI)
< 150 m highwaybor 1,218 (1.73) 1.01 (0.95–1.08) 0.99 (0.92–1.06)
< 50 m major roadc
< 50 m highway 176 (0.25) 1.31 (1.12–1.54) 1.26 (1.07–1.49) < 150 m highway 413 (0.59) 0.96 (0.86–1.07) 0.93 (0.83–1.03) < 50 m major road 842 (1.20) 1.04 (0.97–1.13) 1.03 (0.95–1.12) < 150 m major road 1,611 (2.29) 1.05 (0.99–1.12) 1.04 (0.98–1.11)
aAdjusted for infant sex, First Nations status, parity, maternal age, maternal smoking during pregnancy, month–year of
birth, income (quintile-census), maternal education (quartile-census). bDMTI type 1 and 2 road (expressway: 114,000 vehi-cles/day; principal highway: 21,000 vehicles/day). cDMTI type 3 and 4 road (secondary highway: 18,000 vehicles/day; major road: 15,000 vehicles/day).
Table 6.Crude and adjusted odds ratios for LBW at full term and road proximity.
No. of LBW cases
Measure (% of total subjects) Crude OR (95% CI) AdjustedaOR (95% CI)
< 150 m highwaybor 358 (0.51) 0.98 (0.82–1.17) 0.95 (0.79–1.13)
< 50 m major roadc
< 50 m highway 49 (0.07) 1.32 (0.87–2.00) 1.22 (0.81–1.87) < 150 m highway 124 (0.18) 1.06 (0.80–1.40) 1.01 (0.76–1.33) < 50 m major road 250 (0.36) 0.97 (0.79–1.20) 0.96 (0.77–1.18) < 150 m major road 476 (0.68) 0.95 (0.81–1.12) 0.94 (0.79–1.10)
aAdjusted for infant sex, First Nations status, parity, maternal age, maternal smoking during pregnancy, month–year of
magnitude increased risk of SGA and LBW in relation to traffic-related air pollutants, a strong association was observed for mothers who resided within 50 m of an expressway or high-way. Although the number of subjects meeting this criterion was small (0.25% of all births for SGA), there was a 26% increased risk of an SGA birth compared with those mothers resid-ing > 50 m from an expressway or highway (mean of > 21,000 vehicles per day). For LBW, we observed an 11% increase in risk for this group. No increased risk was observed for those living within 150 m of a highway or within 50 m of a major road (mean of 15,000–18,000 vehicles per day). The LUR models are derived in part from the density of roads of within specific radii, but also include land use and population density variables. Simple road proximity measures were not strongly predictive of measured concentrations in the LUR models (Henderson et al. 2007).
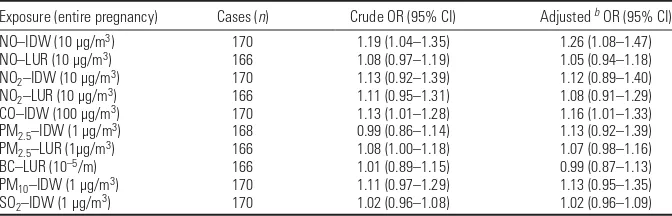
For the preterm birth outcome of < 37 weeks, we did not observe any consistent asso-ciations with any of the pregnancy average exposure metrics except for PM2.5 (IDW: OR = 1.06; 95% CI, 1.01–1.11). In addition, pregnancy average PM2.5exposure was related to preterm births < 35 (IDW: OR = 1.12; 95% CI, 1.02–1.24) and < 30 weeks (IDW: OR = 1.13; 95% CI, 0.92–1.39). For the outcome of birth < 30 weeks, although there were very few cases, we found associations with the different pregnancy average exposure metrics that were similar to those observed for SGA (Table 7). No associations were observed between the simple road proximity measures and preterm birth < 37 weeks, and there were no cases of births < 30 weeks that were within 50 m of a highway. In addition, there were no consistent trends for early or late gestational period exposure to be more strongly associated with preterm births.
Discussion
We explored several outstanding questions in air pollution reproductive epidemiology in a population-based study using individual esti-mates of exposure to air pollutants. We
observed small-magnitude associations between a number of traffic-related pollutants and SGA birth weight. Consistent associations were also observed between PM2.5 and preterm births (< 37 weeks). For other pollutants, associations with gestational duration were observed only for the small subset of births at < 30 weeks ges-tation. Given high correlations between NO, NO2, CO, and SO2, it was not possible to dif-ferentiate impacts of specific pollutants. Associations with SGA were, however, gener-ally of lower magnitude for PM10and PM2.5, and we did not detect any associations with black carbon, although our black carbon model performed relatively poorly in evalua-tion comparisons and was limited by a small number of measurements and seasonal adjust-ment by PM2.5 rather than black carbon trends. Our results suggest a general association between pollutants dominated by traffic sources (NOx and CO) and LBW in this study. This conclusion is supported by our finding of a strong association between resi-dence within 50 m of a highway or expressway, but not other measures of traffic proximity, and both SGA and LBW at full term.
Overall, results from the traffic-based land use regression models agree with analyses based on exposures estimated from the ambient monitoring network. Although effect estimates based on LUR models did have somewhat smaller CIs than those based on monitoring network data, they did not indicate increased estimates of effect, as one might expect given improved spatial resolution of the LUR models and the potential for reduced exposure misclas-sification. It is possible that LUR exposure esti-mates may be more appropriate for primary pollutants, such as NO and black carbon, that vary the most spatially, whereas monitor-based estimates are more appropriate for secondary pollutants such as NO2and PM2.5that display less spatial heterogeneity. In contrast to the improved spatial resolution of land use regres-sion-based exposure estimates, exposures deter-mined from ambient monitors are directly related to a larger number of measurements, include more precise temporal information,
and capture a different spatial scale of variabil-ity in ambient air pollution (Marshall et al. 2008). Exposure estimates from land use regression and monitoring network data for the same pollutant were only moderately corre-lated and appeared to be somewhat indepen-dent, with each capturing different aspects of spatiotemporal variability in exposure (Marshall et al. 2008).
Because exposures were estimated only for home addresses, it is also possible that subject mobility was related to varying degrees of exposure misclassification for the different modeling approaches. An evaluation of the LUR and IDW models for (short-term) meas-ured personal exposures of pregnant women indicated that for NO and NO2, especially for those who were the least mobile, LUR models were a stronger predictor of personal exposure and better explained between-subject variabil-ity in exposure. Monitor-based estimates better explained within-subject (temporal) variability in exposure. For PM2.5 and black carbon, monitor-based estimates (of PM2.5) were more highly correlated with personal exposures than were the LUR models (Nethery et al. 2007),
Overall, these differences between the monitor-based and LUR model exposure esti-mates suggest that our finding of risks associ-ated with both types of exposure estimates indicate some independence of these risks. In analysis of air pollution and childhood lung function, independent effects from both regional and local traffic-related air pollution have been reported (Gauderman et al, 2007).
Although simple measures of road prox-imity have been shown to predict substan-tially smaller percentages of variability in measured concentrations of NOx, PM2.5, and black carbon compared with LUR models (Brauer et al. 2003; Henderson et al. 2007), road distance measures are straightforward, precise, directly relevant to land use policy, and easy to assess and apply in areas without high monitor density. In particular, it is possi-ble that the LUR model estimates, though more specific measures of individual air pollu-tants, may incorporate more exposure mis-classification to the harmful components of traffic than do the measures of road proxim-ity. We found increased risks of SGA and LBW only for those subjects closest to roads of highest traffic intensity in our study area.
Our findings of associations between air pollution and SGA are consistent with reports from a number of studies (Dejmek et al. 1999; Hansen et al. 2007; Liu et al. 2003, 2007; Parker et al. 2005) and conclusions of reviews (Maisonet et al. 2004; Sˇrám et al. 2005), including studies that focus on spatial contrasts in exposure. For example, studies in Southern California (Ritz and Yu 1999; Wilhelm and Ritz 2005), which has a relatively dense ambient monitoring network, found Table 7.Crude and adjusted ORsafor preterm births < 30 weeks.
Exposure (entire pregnancy) Cases (n) Crude OR (95% CI) Adjusted bOR (95% CI)
NO–IDW (10 µg/m3) 170 1.19 (1.04–1.35) 1.26 (1.08–1.47)
NO–LUR (10 µg/m3) 166 1.08 (0.97–1.19) 1.05 (0.94–1.18)
NO2–IDW (10 µg/m3) 170 1.13 (0.92–1.39) 1.12 (0.89–1.40)
NO2–LUR (10 µg/m3) 166 1.11 (0.95–1.31) 1.08 (0.91–1.29)
CO–IDW (100 µg/m3) 170 1.13 (1.01–1.28) 1.16 (1.01–1.33)
PM2.5–IDW (1 µg/m3) 168 0.99 (0.86–1.14) 1.13 (0.92–1.39)
PM2.5–LUR (1µg/m3) 166 1.08 (1.00–1.18) 1.07 (0.98–1.16)
BC–LUR (10–5/m) 166 1.01 (0.89–1.15) 0.99 (0.87–1.13)
PM10–IDW (1 µg/m3) 170 1.11 (0.97–1.29) 1.13 (0.95–1.35)
SO2–IDW (1 µg/m3) 170 1.02 (0.96–1.08) 1.02 (0.96–1.09)
BC, black carbon.
aORs per standardized increases (in parentheses), roughly corresponding to interquartile range. bAdjusted for infant sex,
that exposure to higher levels of ambient CO, based on the nearest monitoring stations within 2 miles of the mother’s home address, during the last trimester was associated with increased risk of LBW (OR = 1.22; 95% CI, 1.03–1.44 for 3-month average exposures > 5.5 ppm). Similar effects were also observed for PM10, with stronger associations found for subjects living within 1 mile of a monitoring station. Most recently, Slama and colleagues (2007) applied LUR models for PM2.5, NO2, and black carbon to a smaller cohort of 1,016 full-term births (≥37 weeks) > 2,500 g in Munich. An increased prevalence ratio of 1.13 (95% CI, 1.00–1.29) for birth weight < 3,000 g at term was associated with a 1-µg/m3 increase in PM2.5 concentration, with associa-tions also observed for increased concentraassocia-tions of black carbon or NO2.
For preterm births, our study, even with its large population, had limited numbers of cases with which to detect a relationship with air pollution. We found consistent associa-tions with PM2.5but not other pollutants for births < 37, 35, or 30 weeks. For risk of very preterm birth (< 30 weeks), we observed ele-vated ORs for a larger number of pollutants (NO, NO2, CO, PM10, and PM2.5 but not SO2). As with SGA, we did not observe any association with black carbon. In addition to the poor performance of our black carbon LUR model in evaluation tests, the application of this model was further limited by our need to use PM2.5monitoring data, as opposed to black carbon measurements, for seasonal adjustment.
A general limitation for our modeling approach for analysis of preterm births arises from the fact that entire pregnancy exposure averaging periods will, by definition, be differ-ent for cases and noncases. Further, the last 3 months and last month of pregnancy occur at different gestational periods for cases and non-cases. The importance of these differences in exposure is less significant in our data, because air pollution exposures for different pregnancy periods were rather highly correlated.
Measures of road proximity, which do not suffer from this potential problem, were not associated with preterm births. This analysis, however, was limited by the low numbers of mothers with preterm births who resided < 50 m of a highway (for example, no births < 30 weeks).
In this analysis we did not identify specific exposure windows (early or late pregnancy) of greater or lesser relevance for SGA or preterm birth, although exposures from different periods of pregnancy were highly correlated. Reports from other studies have been inconsistent with regard to the importance of early or later preg-nancy exposures. The recent study of Slama and colleagues (2007) showed a tendency for third-trimester exposures to exhibit stronger
associations with LBW, but these associations were also highly correlated with exposures aver-aged over the full pregnancy. Multiple potential mechanisms by which air pollution may affect fetal growth and birth weight have been pro-posed, but there is little information regarding specific etiology on which greater importance of specific exposure windows can be based.
This study had several advantages over previous analyses of the relationship between air pollution and birth outcomes. First, the study was population based and estimated exposures at the individual level using both interpolated ambient monitoring network data and temporally adjusted LUR models to characterize spatio-temporal variability in exposure to a greater degree than in previous studies. A recent exception is the study from Munich, which also applied temporally adjusted LUR models, although to a smaller and more restrictive cohort (Slama et al. 2007). In addition, we accounted for residen-tial mobility during pregnancy when assign-ing exposures. Failure to account for mobility, especially in studies such as ours using very small areas to assign exposures, is likely to result in misclassified exposures (Fell et al. 2004). In our study we identified 35% of the population as changing a residence during pregnancy, highlighting the importance of accounting for mobility in residence-based assessment of exposure. Mobility rates among pregnant women reported in the literature range from 12% (Fell et al. 2004) to 33% (Canfield et al. 2006), although most studies were small population case–control studies. Further, by a unique linkage of multiple data-bases, we acquired individual information on several important covariates.
Largely because of the use of administra-tive databases, this study does have several important limitations. We defined fetal growth restriction as a weight below the 10th percentile for gestational age. This definition is imperfect and controversial because it does not make a distinction among fetuses who are constitutionally small, growth restricted and small, and growth restricted but not small. The data elements in our administrative data set did not allow us to make these distinctions (e.g., we did not have data on parental size or birth length). The definition used, however, represents a common definition of fetal growth restriction and increases the opportu-nity for comparisons among studies.
We were also limited by unavailability of individual data for indicators of socioeconomic status. In this case we had to rely on neighbor-hood-level census data, where there is a likeli-hood of misclassification at the individual level. In addition, no information was available on maternal ethnicity, except First Nations status, as ethnicity is known to affect birth weight dis-tributions (Janssen et al. 2007). We also had
no information regarding nutrition or prenatal care. Further, although unlike most previous studies we did account for residential mobility in assigning exposures, our ascertainment of mobility was imperfect because we had no information on the actual moving date; mov-ing was assumed from consistent changes in address information collected during health care system contacts. This limitation may have affected our sensitivity to detect more acute effects of air pollution—for example, impacts on preterm birth. In addition, exposures were based only on residential address and did not consider time weighting by other important microenvironments, which more closely approximates measured exposures (Nethery et al. 2007).
Conclusions
Our findings in a population-based study add to an expanding literature that links several traffic-derived air pollutants (e.g., NO, NO2, CO) to adverse birth outcomes, particularly increased risk of SGA birth weight. In addi-tion, we observed consistent associations between PM2.5 exposure and risk of preterm birth. The overall importance of proximity to highways, even in an area with relatively low levels of ambient air pollutants, suggests opportunities for urban planning approaches to prevention. The toxicologically relevant components of traffic-related air pollution remain unclear and deserve increased attention in future studies.
REFERENCES
Bayer-Oglesby L, Schindler C, Hazenkamp-von Arx ME, Braun-Fahrlander C, Keidel D, Rapp R, et al. 2006. Living near main streets and respiratory symptoms in adults: the Swiss cohort study on air pollution and lung diseases in adults. Am J Epidemiol 164(12):1190–1198.
Brauer M, Gehring U, Brunekreef B, de Jongste J, Gerritsen J, Rovers M, et al. 2006. Traffic-related air pollution and otitis media. Environ Health Perspect 114:1414–1418. Brauer M, Hoek G, Smit HA, de Jongste JC, Gerritsen J,
Postma DS, et al. 2007. Air pollution and development of asthma, allergy and infections in a birth cohort. Eur Respir J 29(5):879–888.
Brauer M, Hoek G, van Vliet P, Meliefste K, Fischer P, Gehring U, et al. 2003. Estimating long-term average particulate air pollution concentrations: Application of traffic indicators and geographic information systems. Epidemiology 14(2):228–239.
Brauer M, Hoek G, Van Vliet P, Meliefste K, Fischer PH, Wijga A, et al. 2002. Air pollution from traffic and the develop-ment of respiratory infections and asthmatic and allergic symptoms in children. Am J Respir Crit Care Med 166(8):1092–1098.
Canfield MA, Ramadhani TA, Langlois PH, Waller DK. 2006. Residential mobility patterns and exposure misclassifica-tion in epidemiologic studies of birth defects. J Expo Sci Environ Epidemiol 16(6):538–543.
Cano A, Fons F, Brines J. 2001. The effects on offspring of pre-mature parturition. Hum Reprod Update 7(5):487–494. Chamberlayne R, Green B, Barer ML, Hertzman C, Lawrence
JW, Sheps SB. 1998. Creating a population-based linked health database: a new resource for health services research. Can J Public Health 89:270–273.
Cyrys J, Heinrich J, Hoek G, Meliefste K, Lewne M, Gehring U, et al. 2003. Comparison between different traffic-related
and absorbance. J Expo Anal Environ Epidemiol 13(2): 134–143.
Dejmek J, Selevan SG, Benesˇ I, Solansky I, Sˇrám RJ. 1999. Fetal growth and maternal exposure to particulate matter dur-ing pregnancy. Environ Health Perspect 107:475–480. Dik N, Tate RB, Manfreda J, Anthonisen NR. 2004. Risk of
physician-diagnosed asthma in the first 6 years of life. Chest 126(4):1147–1153.
Dugandzic R, Dodds L, Stieb D, Smith-Doiron M. 2006. The association between low level exposures to ambient air pollution and term low birth weight: a retrospective cohort study. Environ Health 5:3.
Fell DB, Dodds L, King WD. 2004. Residential mobility during pregnancy. Paediatr Perinat Epidemiol 18(6):408–414. Gauderman WJ, Avol E, Lurmann F, Kuenzli N, Gilliland F,
Peters J, et al. 2005. Childhood asthma and exposure to traffic and nitrogen dioxide. Epidemiology 16(6):737–743. Gauderman WJ, Vora H, McConnell R, Berhane K, Gilliland F,
Thomas D, et al. 2007. Effect of exposure to traffic on lung development from 10 to 18 years of age: a cohort study. Lancet 369(9561):571–577.
Ghosh R, Rankin J, Pless-Mulloli T, Glinianaia S. 2007. Does the effect of air pollution on pregnancy outcomes differ by gender? A systematic review. Environ Res 105(3):400–408. Gilbert NL, Woodhouse S, Stieb DM, Brook JR. 2003. Ambient
nitrogen dioxide and distance from a major highway. Sci Total Environ 312(1-3):43–46.
Glinianaia SV, Rankin J, Bell R, Pless-Mulloli T, Howel D. 2004. Particulate air pollution and fetal health: a systematic review of the epidemiologic evidence. Epidemiology 15(1):36–45.
Hansen C, Neller A, Williams G, Simpson R. 2007. Low levels of ambient air pollution during pregnancy and fetal growth among term neonates in Brisbane, Australia. Environ Res 103(3):383–389.
Henderson SB, Beckerman B, Jerrett M, Brauer M. 2007. Application of land use regression to estimate long-term concentrations of traffic-related nitrogen oxides and fine particulate matter. Environ Sci Technol 41(7):2422–2428. Hoek G, Brunekreef B, Goldbohm S, Fischer P, van den Brandt
PA. 2002a. Association between mortality and indicators of traffic-related air pollution in the Netherlands: a cohort study. Lancet 360(9341):1203–1209.
Hoek G, Meliefste K, Cyrys J, Lewne M, Bellander T, Brauer M, et al. 2002b. Spatial variability of fine particle concentra-tions in three European areas. Atmos Environ 36(25):4077–4088.
Janssen PA, Thiessen P, Klein MC, Whitfield M, MacNab YC, Cullis-Kuhl S. 2007. Standards for the measurement of birth weight, length and head circumference at term in neonates of European, Chinese and South Asian ancestry. Open Medicine 1(2):e74–88.
Jerrett M, Arain A, Kanaroglou P, Beckerman B, Potoglou D, Sahsuvaroglu T, et al. 2005. A review and evaluation of intraurban air pollution exposure models. J Expo Anal Environ Epidemiol 15(2):185–204.
Leem JH, Kaplan BM, Shim YK, Pohl HR, Gotway CA, Bullard SM,
et al. 2006. Exposures to air pollutants during pregnancy and preterm delivery. Environ Health Perspect 114:905–910. Lewne M, Cyrys J, Meliefste K, Hoek G, Brauer M, Fischer P,
et al. 2004. Spatial variation in nitrogen dioxide in three European areas. Sci Total Environ 332(1-3):217–230. Liu S, Krewski D, Shi Y, Chen Y, Burnett RT. 2003. Association
between gaseous ambient air pollutants and adverse pregnancy outcomes in Vancouver, Canada. Environ Health Perspect 111:1773–1778.
Liu S, Krewski D, Shi Y, Chen Y, Burnett RT. 2007. Association between maternal exposure to ambient air pollutants dur-ing pregnancy and fetal growth restriction. J Expo Sci Environ Epidemiol 17(5):426–432.
Maisonet M, Correa A, Misra D, Jaakkola JJ. 2004. A review of the literature on the effects of ambient air pollution on fetal growth. Environ Res 95(1):106–115.
Mannes T, Jalaludin B, Morgan G, Lincoln D, Sheppeard V, Corbett S. 2005. Impact of ambient air pollution on birth weight in Sydney, Australia. Occup Environ Med 62(8):524–530.
Marshall JD, Nethery EN, Brauer M. 2008. Within-urban vari-ability in ambient air pollution: comparison of estimation methods. Atmos Environ 42(6):1359–1369.
Mattison DR, Wilson S, Coussens C, Gilbert D (eds). 2003. The Role of Environmental Hazards in Premature Birth: Workshop Summary. Institute of Medicine. Roundtable on Environmental Health Sciences, Research, and Medicine. Washington, DC:National Academies Press.
Maynard D, Coull BA, Gryparis A, Schwartz J. 2007. Mortality risk associated with short-term exposure to traffic parti-cles and sulfates. Environ Health Perspect 115:751–755. McConnell R, Berhane K, Yao L, Jerrett M, Lurmann F, Gilliland
F, et al. 2006. Traffic, susceptibility, and childhood asthma. Environ Health Perspect 114:766–772.
Miller KA, Siscovick DS, Sheppard L, Shepherd K, Sullivan JH, Anderson GL, et al. 2007. Long-term exposure to air pollu-tion and incidence of cardiovascular events in women. N Engl J Med 356(5):447–458.
Nafstad P, Haheim LL, Wisloff T, Gram F, Oftedal B, Holme I, et al. 2004. Urban air pollution and mortality in a cohort of Norwegian men. Environ Health Perspect 112:610–615. Nethery E, Leckie S, Teschke K, Brauer M. 2007. From
meas-ures to models: an evaluation of air pollution exposure assessment for epidemiologic studies of pregnant women. Occup Environ Med; doi:10.1136/oem.2007.035337 [Online 10 December 2007].
Noullett M, Jackson PL, Brauer M. 2006. Winter measurements of children’s personal exposure and ambient fine particle mass, sulphate and light absorbing components in a north-ern community. Atmos Environ 40(11):1971–1990. Parker JD, Woodruff TJ, Basu R, Schoendorf KC. 2005. Air
pol-lution and birth weight among term infants in California. Pediatrics 115(1):121–128.
Pollack RN, Divon MW. 1992. Intrauterine growth retardation: definition, classification, etiology. Clin Obstet Gynecol 35(1):99–107.
Puderer H. 2001. Introducing the Dissemination Area for the
2001 Census: An Update. Georgraphy Working Paper Series No. 2000-4. Ottawa:Statistics Canada.
Rich K. 2003. Air Pollution and Patients with Implanted Cardiac Defibrillators: An Epidemiological Analysis and Assessment of Exposure [MSc Thesis]. Vancouver, BC, Canada:The University of British Columbia.
Ritz B, Yu F. 1999. The effect of ambient carbon monoxide on low birth weight among children born in southern California between 1989 and 1993. Environ Health Perspect 107:17–25.
Ritz B, Yu F, Chapa G, Fruin S. 2000. Effect of air pollution on preterm birth among children born in southern California between 1989 and 1993. Epidemiology 11(5):502–511. Roemer WH, van Wijnen JH. 2001. Daily mortality and air
pollu-tion along busy streets in Amsterdam, 1987-1998. Epidemiology 12(6):649–653.
Ryan PH, LeMasters G, Biagini J, Bernstein D, Grinshpun SA, Shukla R, et al. 2005. Is it traffic type, volume, or distance? Wheezing in infants living near truck and bus traffic. J Allergy Clin Immunol 116(2):279–284.
Sagiv SK, Mendola P, Loomis D, Herring AH, Neas LM, Savitz DA, et al. 2005. A time-series analysis of air pollution and preterm birth in Pennsylvania, 1997–2001. Environ Health Perspect 113:602–606.
Salam MT, Millstein J, Li YF, Lurmann FW, Margolis HG, Gilliland FD. 2005. Birth outcomes and prenatal exposure to ozone, carbon monoxide, and particulate matter: results from The Children’s Health Study. Environ Health Perspect 113:1638–1644.
Slama R, Morgenstern V, Cyrys J, Zutavern A, Herbarth O, Wichmann HE, et al. 2007. Traffic-related atmospheric pol-lutants levels during pregnancy and offspring’s term birth weight: a study relying on a land-use regression exposure model. Environ Health Perspect 115:1283–1292. Smargiassi A, Berrada K, Fortier I, Kosatsky T. 2006. Traffic
intensity, dwelling value, and hospital admissions for res-piratory disease among the elderly in Montreal (Canada): a case-control analysis. J Epidemiol Community Health 60(6):507–512.
Sˇrám RJ, Binková B, Dejmek J, Bobak M. 2005. Ambient air pol-lution and pregnancy outcomes: a review of the literature. Environ Health Perspect 113:375–382.
Wilhelm M, Ritz B. 2003. Residential proximity to traffic and adverse birth outcomes in Los Angeles County, California, 1994–1996. Environ Health Perspect 111:207–216. Wilhelm M, Ritz B. 2005. Local variations in CO and particulate
air pollution and adverse birth outcomes in Los Angeles County, California, USA. Environ Health Perspect 113:1212–1221.
Zhang KM, Wexler AS, Zhu YF, Hinds WC, Sioutas C. 2004. Evolution of particle number distribution near roadways. Part II: The ‘road-to-ambient’ process. Atmos Environ 38(38):6655–6665.