Issue 1 Latino Children
2010
Poverty, Educational Attainment and Health Among America’s
Poverty, Educational Attainment and Health Among America’s
Children: Current and Future Effects of Population Diversification
Children: Current and Future Effects of Population Diversification
and Associated Socioeconomic Change
and Associated Socioeconomic Change
Steve Murdock
Rice University, shm3@rice.edu
Mary Zey
The University of Texas at San Antonio, mary.zey@utsa.edu
Michael E. Cline
Rice University, Michael.E.Cline@rice.edu
Stephen Klineberg
Rice University, slk@rice.edu
Follow this and additional works at: https://digitalcommons.library.tmc.edu/childrenatrisk
Recommended Citation Recommended Citation
Murdock, Steve; Zey, Mary; Cline, Michael E.; and Klineberg, Stephen (2010) "Poverty, Educational Attainment and Health Among America’s Children: Current and Future Effects of Population Diversification and Associated Socioeconomic Change," Journal of Applied Research on Children: Informing Policy for Children at Risk: Vol. 1 : Iss. 1 , Article 2.
Available at: https://digitalcommons.library.tmc.edu/childrenatrisk/vol1/iss1/2
The Journal of Applied Research on Children is brought to you for free and open access by CHILDREN AT RISK at
Non-Introduction
The characteristics of children in the United States are changing demographically, economically and socially.1 Of these changes the demographics are among the most important, establishing the basic characteristics of the population of children who will ultimately become the nation’s adult population.2, 3, 4 Although progression to adulthood is inevitable, the human capital they will possess when they reach adulthood is not. Their socioeconomic, educational, and health characteristics will play major roles in determining their financial success and their physical and mental health conditions as adults.
This article examines the changing number and racial/ethnic characteristics of the children of the United States both now and as projected for the future. We examine current socioeconomic, health and educational differences among children from specific subgroups using national data, and Texas data to demonstrate the implications of failing to address children’s socioeconomic, health and educational needs in the wake of dramatic demographic change.
Specifically, after reviewing some of the extensive literature on the socioeconomic, health and educational differences among demographic subgroups of children, the article presents basic data on the current and projected changes in the future child population of the United States. It then provides the results of a direct standardization process4 that simulates the potential implications of these demographic changes if the nation fails to address the current economic, health and educational conditions and differences among America’s children.
Socioeconomic and Demographic Interrelationships
conditions limiting children’s life chances (for a discussion of how such factors interact to affect children see Duncan et al., 2010).5 In this work we simulate the effects of racial/ethnic change on several of these socioeconomic, educational and health factors based on projected changes in race/ethnicity. It should be noted, however, that although such an analysis is useful in delineating what may happen in the absence of actions that mitigate the relationships among such factors and racial and ethnic, particularly minority, status, one must never mistake such concomitant factors for causal ones. It is essential to understand some of the key relationships among such factors but causality is not implied.
Socioeconomic, Educational and Health Characteristics Associated with Minority Status
Education Disparities
Roughly one-half of African Americans, Hispanics and American Indians graduate from high school compared to three-fourths of non-Hispanic Whites.6 Only 76% of African Americans and 56% of Hispanic adults have basic English literacy compared with 93% of non-Hispanic Whites.7 In addition, poor and minority children are more likely to attend under resourced schools located in poverty areas.5
The educational gap appears to occur even before formal education begins. Black and Hispanic children living in poverty lag behind Whites on standard measures of achievement.8, 9 Gaps between African Americans and Hispanics relative to non-Hispanic Whites are “one standard deviation” apart meaning that Hispanic and African American children are less likely to finish school and likely to complete fewer years of school.9 This preschool gap is largely explained by poverty and differences in home environments. Nevertheless, currently, among schools with more than 75% minority students, 43% of their students are failing to make the yearly progress necessary to be promoted to the next grade compared with only 16% of students failing to make progress among schools with less than 25% minority students.10
Income and Poverty Disparities
In 2006, 40% of African American children and 30% of Hispanic children under age 5 lived in poverty compared with 17% of White and 8% of Asian children.11 As recently as 1997, during one of the most prosperous periods the United States has ever experienced, 13.4 million children (19.2% of all children) living in the United States were poor.11
that the current extent and effects of poverty in the United States can be traced back to the Personal Responsibility and Work Opportunity Reconciliation Act signed into law by President Clinton on August 22, 1996. This law ended 60 years of guaranteed government aid to the economically deprived children of the United States, the Aid to Families with Dependent Children (AFDC), in favor of providing block grants to states to provide Temporary Assistance for Needy Families (TANF). State control of funds has resulted in differential allocations to children in poverty across the nation. It has also resulted in deep poverty for single mothers unable to make a successful transition to full-time employment in the recession ridden economy of the first decade of the 21st Century. The United States has one of the highest rates of child poverty among developed countries due, in part, to fewer transfer payments to needy families.
Health Disparities
The physical health results of poverty among minority populations are evident in a 1.7 times higher rate of low-birth-weight babies, 3.5 times higher levels of exposure to lead, and a 1.7 times higher rates of child mortality among minority compared to non-Hispanic White children.14
Although academics have studied health and education separately, there is a recursive relationship between these two variables. Generally education has been treated as causal and thus disparities in education have been seen as leading to disparities in health. This causal relationship is generally through the mechanism of occupation status, income, residence in poor neighborhoods, and wealth.15 The racial gap in education is a primary contributor to racial disparities in child mortality with children from households with more highly educated parents having lower rates of mortality. Child poverty and lack of insurance explain many of the racial disparities in adult health with these effects being mediated through disparities in educational achievement.16 However, education also affects health independently of socioeconomic factors. Gaps in educational achievement are key determinants of racial, ethnic and socioeconomic disparities in adult health.17 For example, less education is associated with earlier onsets of chronic diseases, disabilities and declining functional status.
Interrelationships among Race/Ethnicity and Poverty, Educational Attainment, and Health Status
consequences include the fact that poor children are 6.8 times more likely to experience child abuse and neglect, 3.1 times more likely to give birth out of wedlock, and 2.2 times more likely to experience violent crimes, including homicide.14,18
Parental income and education strongly affect general child development particularly among the poorest of children. Findings from a natural experiment19 using the earned income tax credit and those from experiments involving random assignment to welfare show that increases in family income promote child achievement in preschool years. Dahl and Lockner19 note that a $3,000 increase in family income in early and middle childhood boosts reading and math achievement. Work by Duncan et al.5 and Duncan and Brooks-Gunn14 show nonlinear effects indicating that income effects matter more for lower income children than for higher income children.5
However, studies in the United States demonstrate that income is more predictive of some types of outcomes than others. For example, verbal ability and achievement appear to be more affected by family income than are behavioral, mental health and physical health.19 Behavioral, mental, and physical health are causally related to a lack of educational achievement. Schools serving poor and minority children, face far greater risk of closure for lack of achievement under the No Child Left Behind (NCLB) program. In addition, although charter schools and voucher programs are sometimes seen as providing alternatives to such schools, there is little evidence that these schools, when populated by poor and racial minorities, perform any better than public schools. Urban schools with high concentrations of poverty despite insufficient supplemental funding are mandated by NCLB to meet benchmarks that only a small fraction of them have achieved so far.20
Inequities at the Start
It is clear that many of the inequalities that have the most lasting effects on later educational and socioeconomic achievement are those which appear in early childhood. In order to eliminate the lack of readiness to learn at age 6, analysts21 strongly suggest that children from minority and poor backgrounds be provided with early childhood education between the ages of 3 and 5. Early intervention is far more effective than remediation.11, 22
the racial and ethnic gaps in reading readiness by as much as 36 percent.24 Economic studies suggest that investment in early childhood education would yield large savings over the long-run, including improved employment and earnings and reduction in crime and rates of incarceration.25,26
The extent and complexity of interactions among race/ethnicity, educational, income and poverty, and health factors at different stages of the life cycle are illustrated in an excellent analysis by Duncan and associates5 in which they note that their analysis
…shows striking differences in adult outcomes depending on whether childhood income prior to age 6 was below, close to, or well above the poverty line during their early childhood. Compared with children whose families had incomes of at least twice the poverty line during their early childhood, poor children complete 2 fewer years of schooling, work 451 fewer hours per year, earn less than half as much, received $826 per year more in food stamps as adults, and are more than twice as likely to report poor overall health or high levels of psychological distress. Further, poor children have BMIs [Body Mass Indices] that are 4 points higher than those well above the poverty line, and are almost 50% more likely to be overweight as adults. Poor males are twice as likely to be arrested and for females, poverty is associated with a $200 annual increase in cash assistance, and a six fold increase in the likelihood of bearing a child out of wedlock prior to age 21. . . Children with average annual incomes below poverty in the earliest [age] period have lower average income for all three [adult] periods compared with the other two [more affluent] groups. Additionally, the poorest children are less likely to be White and born into an intact family, and more likely to be born in the South, have younger mothers, more siblings, household heads with lower test scores and educational attainment, homes rated dirtier by interviewers, lower parental expectations, and household heads who report less preference for challenge versus affiliation, less personal control, and less risk avoidance compared with their higher income counterparts.5
Methodology
that given current relationships between minority racial/ethnic status and socioeconomic factors including education, it is useful to examine the socioeconomic implications of current and projected patterns of racial/ethnic population change among America’s children. In this article we use recent and projected change in population growth and diversity as an indicator of what will happen if changes are not made in the socioeconomic conditions of minority populations in the United States.
In addition to examining such patterns for the nation as a whole we examine such changes in the state with the largest increase in its child population during this decade. Texas has a large number of children (6.7 million in 2008) and accounted for 839,012 of the net national increase of 1,648,036 children [persons less than 18 years of age] from 2000 to 2008. In addition, Texas has a large number of children in poverty (1.6 million in 2008) and data suggest it has had historically poor educational attainment patterns for its minority residents. It is also one of the most diverse states with more than 50 percent of its population being members of minority groups. Texas provides an excellent example of the conditions likely to characterize the conditions of children in the most diverse states in the nation in the future. By examining the United States as a whole and Texas, we are thus able to demonstrate how, in the absence of socioeconomic change, demographic change will impact children nationally as well as those who live in racially and ethnically diverse states.
The analysis focuses on identifying the role of racial/ethnic diversity. To uniquely identify the effects of diversity we examine the results of two simulations that use direct standardization techniques in which the total 2040 population for the United States and Texas are assumed to be the correct total population for both areas for 2040 for both simulations. One simulation assumes that the race/ethnicity composition of the population remains the same as that which existed in 2008. The second assumes the same total population as the first simulation but assumes that the projected race/ethnicity compositions for 2040 are those as projected by the United States Census Bureau (for the United States) and the Texas State Data Center (for Texas). Comparing these two simulations for each of the populations (those in the United States and in Texas) enables us to indicate the effects of projected racial/ethnic change on the child population of the future, holding population size constant.
populations in both the United States and in Texas. Throughout the analysis we emphasize that race/ethnicity itself is not the causal factor but rather, due to a variety of historical, discriminatory and other factors, race/ethnicity is concomitant with the poverty, educational and health factors examined in the analysis.
Current Patterns of Population Growth and Diversification in the Child Population
The data in Table 1 show changes in the child population of the United States from 2000 to 2008. These data indicate an increase of only 1.6 million children during the first 8.25 years (from April 1, 2000 to July 1, 2008) of the post-2000 decade compared to an overall population increase of 22.6 million. Although children accounted for 25.6 percent of the total population in 2000 and 24.3 percent in 2008, the growth in the child population accounted for only 7.3 percent of population growth from 2000 to 2008. As a result, the proportion of the population made up of children decreased by 1.3 percent from 2000 to 2008 indicating both that birth rates for many population subgroups remain quite low and other age groups are increasing more rapidly because of past differentials in growth.
Table 1: Child Population by Age Group and Race/Ethnicity for the United States for 2000 and 2008 and Numerical and Percentage Population Change by Age Group and Race/Ethnicity Between 2000 and 2008
Race/ Ethnicity
Age 0 - 4
Age 5 - 17
Age 0 - 17
Total Population
Age 0 - 4
Age 5 - 17
Age 0 - 17
Total Pop
Census 2000 Population Percent of Age Group Pop
White 11,287,342 33,043,665 44,331,007 195,575,485 58.9 62.3 61.3 69.5
Black 2,760,926 7,980,866 10,741,792 34,313,007 14.4 15.0 14.9 12.2
Hispanic 3,717,974 8,624,285 12,342,259 35,305,818 19.4 16.2 17.1 12.5
Other 1,409,556 3,469,198 4,878,754 16,227,596 7.3 6.5 6.7 5.8
Total 19,175,798 53,118,014 72,293,812 281,421,906 100.0 100.0 100.0 100.0
Estimated Population in 2008 Percent of Age Group Pop
White 11,065,386 30,498,450 41,563,836 199,491,458 52.6 57.6 56.2 65.6
Black 2,853,546 7,623,424 10,476,970 37,171,750 13.6 14.4 14.2 12.2
Hispanic 5,287,996 10,804,541 16,092,537 46,943,613 25.2 20.4 21.7 15.4
Other 1,798,924 4,009,581 5,808,505 20,452,903 8.6 7.6 7.9 6.8
Total 21,005,852 52,935,996 73,941,848 304,059,724 100.0 100.0 100.0 100.0
Numeric Change, 2000-2008 Percent Change, 2000-2008
White -221,956 -2,545,215 -2,767,171 3,915,973 -2.0 -7.7 -6.2 2.0
Black 92,620 -357,442 -264,822 2,858,743 3.4 -4.5 -2.5 8.3
Hispanic 1,570,022 2,180,256 3,750,278 11,637,795 42.2 25.3 30.4 33.0
Other 389,368 540,383 929,751 4,225,307 27.6 15.6 19.1 26.0
Total 1,830,054 -182,018 1,648,036 22,637,818 9.5 -0.3 2.3 8.0
of the total population but only 61.3 percent of the 0-17 population in 2000. In 2008, they represented 65.6 percent of the total but 56.2 percent of the child population.
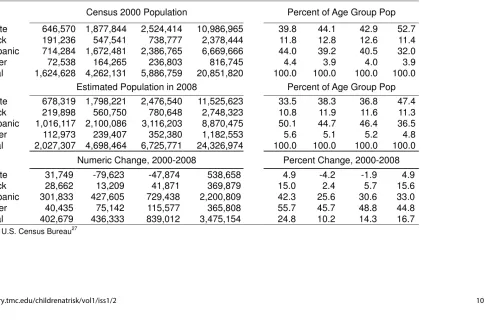
Even in a rapidly growing state such as Texas in which more than 3.4 million persons were added from 2000-2008 (see Table 2), the increase in the child population is less than for the total population -- 14.3 percent for children compared to 16.7 percent for the population as a whole. But the changing racial and ethnic composition of the population of the United States and rapidly growing states such as Texas is particularly evident among children, especially Hispanic and non-Hispanic Other children. Although the number of non-Hispanic White children in Texas decreased by nearly 48,000 and the number of non-Hispanic Black children increased by nearly 42,000, the number of non-Hispanic Other children increased by nearly 116,000 and the number of Hispanic children increased by more than 729,000.
Texas total non-Hispanic White Population dropped from 52.7 percent in 2000 to 47.4 percent in 2008 (5.3 percent) but the percent of non-Hispanic White children decreased from 42.9 to 36.8 (6.1 percent) and the percent of non-Hispanic White children among those 0-4 years of age decreased from 39.8 to 33.5 percent (6.3 percent). The percent of all children who are Hispanic increased from 40.5 to 46.4 percent and the percentage among those who are 0-4 years of age increased from 44.0 to 50.1 percent.
The data in Tables 1 and 2 indicate that the proportion of children in the total population is decreasing while at the same time becoming more diverse with the largest increases among Hispanic youth. This clearly suggests that the patterns of recent population change are ones likely to lead to a more diverse America, particularly at the youngest ages.
Projected Future Trends in Population Growth and Diversification in the Child Population
Table 2: Child Population by Age Group and Race/Ethnicity for Texas for 2000 and 2008 and Numerical and Percentage Population Change by Age Group and Race/Ethnicity Between 2000 and 2008
Race/ Ethnicity
Age 0 - 4
Age 5 - 17
Age 0 - 17
Total Population
Age 0 - 4
Age 5 - 17
Age 0 - 17
Total Pop
Census 2000 Population Percent of Age Group Pop
White 646,570 1,877,844 2,524,414 10,986,965 39.8 44.1 42.9 52.7
Black 191,236 547,541 738,777 2,378,444 11.8 12.8 12.6 11.4
Hispanic 714,284 1,672,481 2,386,765 6,669,666 44.0 39.2 40.5 32.0
Other 72,538 164,265 236,803 816,745 4.4 3.9 4.0 3.9
Total 1,624,628 4,262,131 5,886,759 20,851,820 100.0 100.0 100.0 100.0
Estimated Population in 2008 Percent of Age Group Pop
White 678,319 1,798,221 2,476,540 11,525,623 33.5 38.3 36.8 47.4
Black 219,898 560,750 780,648 2,748,323 10.8 11.9 11.6 11.3
Hispanic 1,016,117 2,100,086 3,116,203 8,870,475 50.1 44.7 46.4 36.5
Other 112,973 239,407 352,380 1,182,553 5.6 5.1 5.2 4.8
Total 2,027,307 4,698,464 6,725,771 24,326,974 100.0 100.0 100.0 100.0
Numeric Change, 2000-2008 Percent Change, 2000-2008
White 31,749 -79,623 -47,874 538,658 4.9 -4.2 -1.9 4.9
Black 28,662 13,209 41,871 369,879 15.0 2.4 5.7 15.6
Hispanic 301,833 427,605 729,438 2,200,809 42.3 25.6 30.6 33.0
Other 40,435 75,142 115,577 365,808 55.7 45.7 48.8 44.8
Total 402,679 436,333 839,012 3,475,154 24.8 10.2 14.3 16.7
Table 3: Child Population by Age Group and Race/Ethnicity for the United States for 2000 and Projected for 2040 and Numerical and Percentage Population Change by Age Group And Race/Ethnicity
Between 2000 and 2040
Race/ Ethnicity
Age 0 - 4
Age 5 - 17
Age 0 -17
Total
Population
Age 0 - 4
Age 5 - 17
Age 0 -17
Total Pop
Census 2000 Population Percent of Age Group Pop
White 11,287,342 33,043,665 44,331,007 195,575,485 58.9 62.3 61.3 69.5
Black 2,760,926 7,980,866 10,741,792 34,313,007 14.4 15.0 14.9 12.2
Hispanic 3,717,974 8,624,285 12,342,259 35,305,818 19.4 16.2 17.1 12.5
Other 1,409,556 3,469,198 4,878,754 16,227,596 7.3 6.5 6.7 5.8
Total 19,175,798 53,118,014 72,293,812 281,421,906 100.0 100.0 100.0 100.0
Projected Population in 2040 Percent of Age Group Pop
White 10,602,435 28,622,121 39,224,556 206,064,884 40.6 42.2 41.7 50.8
Black 3,023,457 8,029,212 11,052,669 48,780,297 11.6 11.8 11.8 12.0
Hispanic 9,462,750 23,876,967 33,339,717 108,223,292 36.2 35.2 35.5 26.7
Other 3,028,274 7,341,185 10,369,459 42,586,822 11.6 10.8 11.0 10.5
Total 26,116,916 67,869,485 93,986,401 405,655,295 100.0 100.0 100.0 100.0
Numeric Change 2000-2040 Percent Change 2000-2040
White -684,907 -4,421,544 -5,106,451 10,489,399 -6.1 -13.4 -11.5 5.4
Black 262,531 48,346 310,877 14,467,290 9.5 0.6 2.9 42.2
Equally dramatic is the fact that the 17.1 percent of the child population that was Hispanic in 2000 will increase to 35.5 percent by 2040 while the non-Hispanic White child population which was 61.3 percent of the total child population in 2000 is projected to be only 41.7 percent in 2040.
The child population of Texas will increase and diversify more dramatically than the child population of the United States as a whole (see Table 4). Although already more than 40 percent of the child population in 2000, Hispanic children will account for nearly two of every three (63.5 percent of) Texas children by 2040. As with the United States child population increases in minority child populations the increase in Texas will offset a decrease of more than 579,000 non-Hispanic White children with the nearly 3.4 million increase in the Hispanic population of children, the 110,000 increase in non-Hispanic Black children and the nearly 269,000 increase in the number of non-Hispanic Other children resulting in a net increase of more than 3.1 million children in Texas. Because of projected increases in young adult populations (from immigration and domestic immigration), the percent of the increase in the total population accounted for by children is even less than that for the United States population as a whole with the increase in the child population of Texas accounting for only 13.1 percent of the total population compared to the 17.5 percent of the total increase accounted for by children in the United States as a whole. Nevertheless, the data for Texas, as that for the United States, show a growing and rapidly diversifying child population. In both Texas and the United States, the racial and ethnic diversification of the child populations will be extremely critical in determining the demand on educational and other public services and on the socioeconomic and physical well-being of children.
Socioeconomic Implications of the Diversification of the Child Population of the United States and Texas
Effects on Poverty
Table 4: Child Population by Age Group and Race/Ethnicity for Texas for 2000 and Projected for 2040 and Numerical and Percentage Population Change by Age Group And Race/Ethnicity Between 2000 and 2040
Race/ Ethnicity
Age 0 - 4
Age 5 - 17
Age 0 - 17
Total Population
Age 0 - 4
Age 5 - 17
Age 0 - 17
Total Pop
Census 2000 Population Percent of Age Group Population
White 646,570 1,877,844 2,524,414 10,986,965 39.8 44.1 42.9 52.7
Black 191,236 547,541 738,777 2,378,444 11.8 12.8 12.6 11.4
Hispanic 714,284 1,672,481 2,386,765 6,669,666 44.0 39.2 40.5 32.0
Other 72,538 164,265 236,803 816,745 4.4 3.9 4.0 3.9
Total 1,624,628 4,262,131 5,886,759 20,851,820 100.0 100.0 100.0 100.0
Projected Population in 2040 Percent of Age Group Population
White 520,624 1,424,365 1,944,989 11,196,427 19.7 22.3 21.5 24.9
Black 227,182 621,501 848,683 4,341,627 8.6 9.7 9.4 9.7
Hispanic 1,741,194 4,000,115 5,741,309 25,090,745 65.9 62.5 63.5 55.9
Other 153,505 352,358 505,863 4,243,239 5.8 5.5 5.6 9.5
Total 2,642,505 6,398,339 9,040,844 44,872,038 100.0 100.0 100.0 100.0
Numeric Change, 2000-2040 Percent Change, 2000-2040
White -125,946 -453,479 -579,425 209,462 -19.5 -24.1 -23.0 1.9
Black 35,946 73,960 109,906 1,963,183 18.8 13.5 14.9 82.5
Hispanic 1,026,910 2,327,634 3,354,544 18,421,079 143.8 139.2 140.5 276.2
Other 80,967 188,093 269,060 3,426,494 111.6 114.5 113.6 419.5
Total 1,017,877 2,136,208 3,154,085 24,020,218 62.7 50.1 53.6 115.2
children are 10-12 percent. The data also suggest that if the additions of minority, particularly Hispanic, children shown in Tables 3 and 4 occur without changes in the socioeconomic characteristics of minority children, the result will be to increase substantially the number of children in poverty.
The data in Tables 5 and 6 verify patterns suggested by the analysis presented above. These tables show in the top panel the projected number of children in poverty when the 2008 race/ethnicity composition of the population is applied (or assumed to apply to) the 2040 total population projection and the poverty rates shown in Figure 1 are applied to that projected population. In the second panels of Tables 5 and 6 the number of children in poverty is shown using the race/ethnicity composition of the population as actually projected for 2040 and assuming the 2008 poverty values shown in Figure 1. A comparison of data in these two panels of Tables 5 and 6 (and subsequent tables similarly constructed) allow one to control for the effects of the projected change in size (since both use the same total population value) so that the differences resulting from racial/ethnic differentiation are identified. Also shown in these tables are the total number of persons in poverty if total poverty rates by race/ethnicity are applied to the 2040 population with the 2008 and the actual 2040 population racial/ethnic compositions.
The data in Tables 5 and 6 show first the effects of changes in the population composition on the number of children in poverty. For example, in the absence of changes in the socioeconomic conditions of minority children (see Table 5) the number of children in poverty will increase by nearly 1.8 million in the United States and (Table 6) by more than 306,000 in Texas.
Table 5: Child Population in Poverty in the United States in 2040 Assuming 2008 Poverty Rates and U.S. Census Bureau Projected Population Composition Compared to a Projected 2040 Population Assuming 2008 Demographic Composition and 2008 Poverty Rates
Race / Ethnicity
Age 0 - 4
Age 5 - 17
Age 0 - 17
Percent of Poverty Pop
Age 0 – 17 2008 Composition
White 1,966,231 4,534,767 6,500,998 35.2 Black 1,426,438 3,244,704 4,671,142 25.3 Hispanic 2,097,389 3,918,241 6,015,630 32.5
Other 406,130 887,190 1,293,320 7.0
Total 5,896,188 12,584,902 18,481,090 100.0 Projected Composition
White 1,516,148 3,320,166 4,836,314 23.8
Black 1,215,430 2,665,698 3,881,128 19.1
Hispanic 3,018,617 6,757,182 9,775,799 48.2
Other 548,118 1,262,684 1,810,802 8.9
Total 6,298,313 14,005,730 20,304,043 100.0
Numeric Difference
White -450,083 -1,214,601 -1,664,684 ----
Black -211,008 -579,006 -790,014 ----
Hispanic 921,228 2,838,941 3,760,169 ----
Other 141,988 375,494 517,482 ----
Total 402,125 1,420,828 1,822,953 ----
Percent Difference
White -22.9 -26.8 -25.6 ----
Black -14.8 -17.9 -16.9 ----
Hispanic 43.9 72.4 62.5 ----
Other 35.4 42.8 40.5 ----
Table 6: Child Population in Poverty in Texas in 2040 Assuming 2008 Poverty Rates and Texas State Data Center Projected Population Compared to a Projected 2040 Population Assuming 2008 Demographic Composition and 2008 Poverty Rates
Race / Ethnicity
Age 0 - 4
Age 5 - 17
Age 0 - 17
Percent of Poverty
Pop Age 0 – 17 2008 Composition
White 108,884 237,705 346,589 16.2
Black 108,449 236,035 344,484 16.1
Hispanic 485,869 900,918 1,386,787 64.8
Other 18,202 44,705 62,907 2.9
Total 721,404 1,419,363 2,140,767 100.0
Projected Composition
White 64,037 138,163 202,200 8.3
Black 86,329 192,665 278,994 11.4
Hispanic 639,018 1,260,036 1,899,054 77.6
Other 18,881 48,273 67,154 2.7
Total 808,265 1,639,137 2,447,402 100.0
Numeric Difference
White -44,847 -99,542 -144,389 ----
Black -22,120 -43,370 -65,490 ----
Hispanic 153,149 359,118 512,267 ----
Other 679 3,568 4,247 ----
Total 86,861 219,774 306,635 ----
Percent Difference
White -41.2 -41.9 -41.7 ----
Black -20.4 -18.4 -19.0 ----
Hispanic 31.5 39.9 36.9 ----
Other 3.7 8.0 6.8 ----
Figure 1: Percent of Children and Percent of the Total Population in the United States and Texas in Poverty in 2008 by Race/Ethnicity
---similar data for Texas with Hispanic children accounting for 77.6 percent of all children in poverty by 2040 if the projected race/ethnicity composition of the population actually occurs in 2040. In sum, the data in Tables 5 and 6 show that unless steps are taken to reduce the poverty levels of minority children, especially Hispanic children, the total number of children in poverty will increase significantly and (when combined with expected demographic trends) lead to an even more significant increase in the number and percent of all children in poverty who are minority group members.
Effects on Educational Attainment
The data in Tables 7 and 8 show the population of children in poverty in households by the educational levels of the householders. The data in these tables indicate that racial and ethnic disparities in educational attainment are extensive. Thus, among non-Hispanic Whites in the United States, 20.7 percent of children in poverty have householders who have less than a high school education and in Texas that percentage is 22.1 percent but the percentage of Hispanic children in poverty living with householders without a high school level of education was 52.5 percent in 2008 in the United States as a whole and 56.0 percent in Texas. Whether viewed as a cause or an effect of poverty it is evident that levels of educational attainment among householders in households with children in poverty are reflective of non-competitive levels of education.
The data in Tables 9 and 10 suggest what the effects of poverty are if the rates of educational attainment by race/ethnicity and poverty continue. If one examines the numerical difference by educational level the results show the expected decrease in the number of non-Hispanic Whites in the population resulting from the slow growth of this population segment and the rapid increase in the number of minorities, particularly Hispanics at all levels.
Table 7: Child Population in Poverty by Race/Ethnicity of the Child and Educational Attainment of the Householder for the United States
in 2008
Educational Attainment of
Householder White Black Hispanic Other Total
Estimated Population in Poverty
< H.S. Diploma 1,059,875 945,272 2,490,892 247,722 4,743,761 H.S. Grad./GED 1,771,579 1,268,945 1,148,183 281,225 4,469,932 Some College 1,694,776 1,162,280 782,852 334,018 3,973,926 Bachelor’s
or More 593,940 301,604 322,630 151,273 1,369,447
Total 5,120,170 3,678,101 4,744,557 1,014,238 14,557,066
Percent of Poverty Population
< H.S. Diploma 20.7 25.7 52.5 24.4 32.6
H.S. Grad./GED 34.6 34.5 24.2 27.7 30.7
Some College 33.1 31.6 16.5 33.0 27.3
Bachelor’s
or More 11.6 8.2 6.8 14.9 9.4
Total 100.0 100.0 100.0 100.0 100.0
Table 8: Child Population in Poverty by Race/Ethnicity of the Child and Educational Attainment of the Householder for Texas in 2008
Educational
Attainment White Black Hispanic Other Total
Estimated Population in Poverty
< H.S. Diploma 56,987 59,201 579,288 7,751 703,227
H.S. Grad./GED 85,610 92,147 234,818 10,460 423,035
Some College 83,547 83,396 163,442 16,530 346,915
Bachelor’s
or More 31,717 22,651 56,894 11,954 123,216
Total 257,861 257,395 1,034,442 46,695 1,596,393
Percent of Poverty Population
< H.S. Diploma 22.1 23.0 56.0 16.6 44.1
H.S. Grad./GED 33.2 35.8 22.7 22.4 26.5
Some College 32.4 32.4 15.8 35.4 21.7
Bachelor’s
or More 12.3 8.8 5.5 25.6 7.7
Total 100.0 100.0 100.0 100.0 100.0
Table 9: Child Population in Poverty by Educational Attainment of Householder in the United States in 2040 Assuming 2008 Poverty Rates and U.S. Census Bureau Projected Population Compared to a Projected 2040 Population Assuming 2008 Demographic Composition and 2008 Poverty Rates
Race /
Ethnicity < H.S.
H.S./ GED
Some College
Bachelor's
or More Total
2008 Composition
White 1,345,707 2,249,345 2,151,830 754,116 6,500,998 Black 1,200,483 1,611,544 1,476,081 383,034 4,671,142 Hispanic 3,158,206 1,455,782 992,579 409,063 6,015,630
Other 315,887 358,608 425,927 192,898 1,293,320
Total 6,020,283 5,675,279 5,046,417 1,739,111 18,481,090 Projected Composition
White 1,001,117 1,673,365 1,600,820 561,012 4,836,314
Black 997,451 1,338,989 1,226,436 318,252 3,881,128 Hispanic 5,132,295 2,365,743 1,613,007 664,754 9,775,799 Other 442,279 502,094 596,350 270,079 1,810,802 Total 7,573,142 5,880,191 5,036,613 1,814,097 20,304,043
Numeric Difference
White -344,590 -575,980 -551,010 -193,104 -1,664,684
Black -203,032 -272,555 -249,645 -64,782 -790,014
Hispanic 1,974,089 909,961 620,428 255,691 3,760,169
Other 126,392 143,486 170,423 77,181 517,482
Total 1,552,859 204,912 -9,804 74,986 1,822,953
Percent Difference
White -25.6 -25.6 -25.6 -25.6 -25.6
Black -16.9 -16.9 -16.9 -16.9 -16.9
Hispanic 62.5 62.5 62.5 62.5 62.5
Other 40.0 40.0 40.0 40.0 40.0
Table 10: Child Population in Poverty in Texas in 2040 by Educational Attainment of Householder Assuming 2008 Poverty Rates and Texas State Data Center Projected Population Compared to a Projected 2040 Population Assuming 2008 Demographic Composition and 2008 Poverty Rates
Race /
Ethnicity < H.S.
H.S./ GED
Some College
Bachelor's
or More Total
2008 Composition
White 76,596 115,068 112,295 42,630 346,589 Black 79,231 123,325 111,613 30,315 344,484 Hispanic 776,601 314,801 219,112 76,273 1,386,787 Other 10,443 14,091 22,269 16,104 62,907 Total 942,871 567,285 465,289 165,322 2,140,767
Projected Composition
White 44,686 67,130 65,513 24,871 202,200
Black 64,169 99,880 90,394 24,551 278,994
Hispanic 1,063,470 431,085 300,051 104,448 1,899,054
Other 11,148 15,042 23,773 17,191 67,154
Total 1,183,473 613,137 479,731 171,061 2,447,402
Numeric Difference
White -31,910 -47,938 -46,782 -17,759 -144,389
Black -15,062 -23,445 -21,219 -5,764 -65,490
Hispanic 286,869 116,284 80,939 28,175 512,267
Other 705 951 1,504 1,087 4,247
Total 240,602 45,852 14,442 5,739 306,635
Percent Difference
White -41.7 -41.7 -41.7 -41.7 -41.7
Black -19.0 -19.0 -19.0 -19.0 -19.0
Hispanic 36.9 36.9 36.9 36.9 36.9
Other 6.8 6.7 6.8 6.7 6.8
to 37.3 percent in that category in the projected composition scenario and to decreases in the percentage of children in households that are in all other educational categories. For Texas 240,602 (79.2 percent) of the total increase of 306,635 is due to racial/ethnic change in the less than high school category leading to an increase of all children in households in this category from 44.1 percent to 48.4 percent. In both the United States as a whole and in Texas, this difference is largely a result of the addition of the large number of Hispanics assuming that they continue to have the low levels of education that prevailed in Hispanic poverty households in 2008.
Effects on Health Conditions
Effects on health conditions resulting from the changing demographic composition of children are shown in Figure 2. These values use different age delineations of childhood which are adjusted for the United States and Texas to indicate the number of children experiencing each condition in both the United States as a whole and in Texas.
The data in Figure 3 show the impacts of the change in the racial/ethnic composition on the number of children with selected health conditions. In this figure, the difference in the number with selected conditions for the 2008 and 2040 compositions are shown for the United States and Texas.
When one examines the numerical differences between the two scenarios in Figure 3 the impacts of the change in racial/ethnic composition are evident. For all conditions, the changing race/ethnicity composition of the child population increases the total number of persons with the condition. The largest increases for both the United States and Texas are the number of children with untreated cavities which increase by 10.8 percent for the United States and 14.9 percent for Texas.
The data in Figure 3 also show increases in the number of children experiencing each condition in Texas. These are increases directly attributable to the racial/ethnic change expected by 2040. These changes indicate that in Texas, as in the United States, the increases in the population that are largely attributed to minority, particularly Hispanic, population growth will lead to disproportionate increases in the number of children with negative health conditions.
Summary and Implications
Figure 2: Estimated Number of Children in the United States and Texas in Poverty with Selected Health Conditions in 2008
socioeconomic, educational, and health conditions of children in the United States examined here form an interrelated set of conditions which jointly and interactively affect child well-being. We demonstrate through demographic simulations employing direct standardization techniques the effects of projected demographic trends in racial and ethnic composition in the absence of change in the socioeconomic, educational and health characteristics that are associated with minority population status. We document the effects of United States and Texas demographic change if nothing changes in the related socioeconomic conditions of the minority populations of children. We describe such patterns for the United States to demonstrate where the nation is headed in the absence of change and examine Texas as an example of a large, diverse, and rapidly growing state with a rapidly growing child, particularly Hispanic child population.
The results show that 2000 to 2008 patterns of change indicate relatively extensive population growth in the United States and in Texas. In both, however, a dominant pattern is that of very rapid racial/ethnic diversification in the population, particularly among children. Thus, whereas the non-Hispanic White population of children in the United States decreased by nearly 2.8 million from 2000 to 2008 and the non-Hispanic Black population declined by nearly 265,000, the non-non-Hispanic Other population increased by nearly 930,000 and the number of Hispanic children increased by nearly 3.8 million. Similarly, the number of non-Hispanic White children in Texas declined by nearly 48,000, and the number of non-Hispanic Black children increased by less than 42,000, but the non-Hispanic Other population of children increased by almost 116,000 and the number of Hispanic children increased by more than 729,000. As a result, the proportion of the United States child population that was Hispanic increased from 17.1 to 21.8 percent while the percentage that was non-Hispanic White decreased from 61.3 percent to 56.2 percent and in Texas the percentage of all children that were Hispanic increased from 40.5 percent in 2000 to 46.3 percent in 2008 while the percent of all children who were non-Hispanic White decreased from 42.9 percent in 2000 to 36.8 percent in 2008. The post-2000 period has witnessed rapid diversification in both the child population of the United States and that in rapidly growing states such as Texas.
21.6 million from 2000 to 2040 and in Texas the child population will increase by more than 3.1 million. These represent projected increases of 30.0 percent in the child population of the United States from 2000 to 2040 compared to a total population increase of 44.1 percent while the child population of Texas is projected to increase by 53.6 percent and the total population by 115.2 percent from 2000 to 2040.
Racial/ethnic diversification is extensive in both areas with the percentage of all children who are non-Hispanic White in the United States declining from 61.3 percent in 2000 to 41.7 percent in 2040 and the percentage of children who are non-Hispanic Black declining from 14.9 to 11.8 percent while the percentage of non-Hispanic Other children increasing from 6.7 percent of the child population in 2000 to 11.0 percent of all children in 2040 and the percentage of all children who are Hispanic is projected to increase from 17.1 percent in 2000 to 35.5 percent of all children by 2040.
In Texas, the 2000 to 2040 changes show the percent of all children who are non-Hispanic White declining from 42.9 of the child population in 2000 to 21.5 percent in 2040, the percentage of children who are non-Hispanic Black declining from 12.6 to 9.4 percent, the percentage of children who are non-Hispanic Other children increasing from 4.0 to 5.6 percent and the percent of children who are Hispanic increasing from 40.5 percent of all children in Texas in 2000 to 63.5 percent of all Texas children in 2040.
children in poverty who are members of minority populations, particularly Hispanic populations.
The next section examined the effects of race/ethnicity change on educational change assuming that householders with children in poverty continue to have the same school completion levels as in 2008 in 2040. These data (in Table 7 for the United States and Table 8 for Texas) show already high rates of concentration of children in poverty in households where householders have low levels of education. Nearly 33 of all such householders in the United States and nearly 44 percent of such children in Texas had less than a high school level of education.
When such data are combined with projections with differentials in assumed rates of racial/ethnic change (compared to 2008 from none [current] to actual projected compositions) the results show a marked decrease in the educational attainment of the householders in households with children in poverty. In the United States (Table 9) the projected race/ethnicity change leads to a more than 1.8 million increase in the number of children in such poverty households with nearly 1.6 million of that increase being a result of increases in children living with householders with less than a high school level of education and with a majority of these children from the increases in the number of Hispanic children. In Texas (Table 10) the results show smaller overall increases but of the roughly 307,000 increase in the number of Texas children in poverty households roughly 245,000 of them would be living with householders with less than a high school level of education and most would be Hispanic.
Conclusions
We draw several overall conclusions. First, it is evident that most of the conditions that will impact minority children will primarily impact Hispanic children. Throughout the analysis the central role played by Hispanic children is evident. They are the dominant minority population and will come to form more than one-third of all children in the United States as a whole by 2040 and account for nearly two of every three children in Texas by 2040. In addition, they are particularly disadvantaged relative to income (with very high rates of poverty), education (with the highest percentage of children living with householders with less than a high school education), and have high rates of negative health outcomes. Addressing the needs of the nation’s children and those child populations in states such as Texas will primarily require addressing the needs of Hispanic children. This, in turn, will require that one take into account language, a possible lack of familiarity with American practices and culture, and the need for substantial assistance in establishing a minimum economic base. The fact that so many of the children in need are those with the most dire levels of need, makes addressing the needs of Hispanic children especially important if we are to improve the conditions for all of America’s children.
References
1. Cosby, A. (ed.) 2004. About Children: An Authoritative Resource on the State of Childhood Today. Washington D.C.: American Academy of Pediatrics. 2004
2. Murdock, S.H. An America Challenged: Population Change and the Future of the United States. Boulder, Colorado, Westview Press. 1995
3. Murdock, S.H., White, S.W., Hoque, N., Pecotte, B., You, X, and J. Balkan. The New Texas Challenge: Population Change and the Future of Texas. College Station, TX: Texas A&M University Press. 2003
4. Siegel, J. S. and D.A. Swanson. The Methods and Materials of Demography. San Diego, California: Elsevier Academic Press. 2004
5. Duncan, G.J., Ziol-Guest, K.M. and A. Kalil. “Early-Childhood Poverty and Adult Attainment, Behavior, and Health.” Child Development 2010 81(1) 306-325.
6. Swanson C. 2004. Who graduates? Who Doesn’t? Washington, DC. Urban Institute. 2004
7. Kutner, M., I Greenberg, Y. Jin, B. Boyle, Y. Hsu, E. Dunleavy, 2007.ILiterarcy in Everyday Life: Results from the 2003 National Assessment of Adult Literacy. Washington, DC: US Department of Education: NCES 2007-4800. Available at:
http://nces.ed.gove/pubsearch/pubsinfo.asp?pubid=20077480. Accessed May 2008.
8. Carneiro P., J. Heckman. Human capital policy. In Friedman B. (ed.) Inequality in America. Cambridge, MA: MIT Press: 2005: 77-239.
9. Brooks-Gunn J. P. K. Klevanov, G. Duncan, “Ethnic Differences in Children’s Intelligence Test Scores: Role of Economic Deprivation, Home Environment, and Maternal Characteristics.”Child Development. 1996 67(2): 396-408.
Volume III. Accountability under NCLB: Interim Report. Washington, DC: US Department of Education 2007. Available at:
www.ed.gov/rschstat/eval/disadv/nclb-accountability/index.html. Accessed May 2008.
11. US Census Bureau. Current Population Survey (CPS) Annual Social and Economic (ASEC) Supplement POV03: People in families with relation children under 18 by family structure, age, and sex, iterated by income-to-poverty ratio and race: 2006. Available at:
http://pubdb3.census.gove/mancro/032007//pov/new03-100.htm. Accessed May 2008.
12. Brooks-Gunn, J., Berlin, L.J., & Fuligini, A.S. (in press). Early Childhood Interaction Programs: What about the family? In J.P. Shankoff & J.J. Meisels (Eds.). Handbook on Early Childhood Intervention (2nd Ed). New York: Cambridge University Press.
13. Brooks-Gunn, J. Phelps, E & Elder, GH. (1991) Studying lives through time: Secondary data analyses in developmental psychology. Developmental Psychology, 27(6), 899-910.
14. Duncan, G. and Brooks-Gunn, J. (Eds) Consequences of Growing Up Poor. New York: Russell Sage Foundation. 1997.
15. Backlund F., P.D. Sorlie, and N.J.Johnson. “A comparison of the relationships of education and income with mortality: the National Longitudinal Mortality Study”. Social Science Medicine 1999 49(10): 1373-1384.
16. Johnson R.C. and R. F. Schoeni. The Influence of Early-Life Events on Human Capital, Health Status, and Labor Market Outcomes over the Life Course: Ann Arbor, MI Institute of Research on Labor and Employment. Working Paper Series, 2007. RSC Research Report 2007 No. 07-616.
18. Blau, D. “The Effect of income on child development” Review of Economics and Statistics, 1999 81 (2), 261-276.
19. Dahl G. L. Lochner. 2005. “The Impact of Family Income on child Achievement.” Madison, WI: Institute for Research on Poverty Paper no. 1305-05.
20. Rothstein R. 2006. “Proficiency for All: An Oxymoron.”Paper presented for the Symposium. “Examining American’s Commitment to Closing Achievement Gaps: NCLB and Its Alternatives.” Sponsored by the Campaign for Educational Equality. Teachers College. Columbia University. November 13-14.
21. Tarlov, A. and M. P. Debbink. Investing in Early Childhood Development. New York: Palgrave McMillan. 2008
22. Lu M.C. and N. Halfon. “Racial and ethnic disparities in birth outcomes: a life-course perspective.” Modern Child Health Journal 7(1):13-30.
23. Love, J.M., E.E. Kisker, and C. Ross et al. “The effectiveness of early head start for 3-year-old children and their parents; lesions for policy and programs.”Developmental Psychology42 2005 (6):885-901.
24. Magnuson K.A. and J. Waldfogel. 2005. “Early childhood care and education effects on ethnic and racial gaps in school readiness. Future Child. 2005 (1):169-196.
25. Karoly L., M. Kilburn and J Cannon. 2005 Early Childhood Interventions, Proven Results, Future Santa Monica, CA: Rand Corporation.
26. Lynch, R.G. 2007. Enriching Children. Enriching the Nation: Public Investment in High-Quality Prekindergarten. Washington, DC: Economic Policy Institute.
28. U.S. Census Bureau. 1996. Population Projections of the United States by Age, Sex, Race, and Hispanic Origin: 1995 to 2050 (P25-1130).
29. Texas State Data Center. 2008. Projections of the Population of Texas and Counties in Texas by Age, Sex, and Race/Ethnicity for 2000-2040.
30. U.S. Census Bureau. 2009. American Community Survey, 2008 1-Year Public Use Microdata Sample.
31. U.S. Center for Disease Control. 2009. America’s Children in Brief: Key National Indicators of Well-Being, 2010.