Account and Financial Management Journal ISSN: 2456-3374
Growth Performance Vis-à-Vis Enterprise Size: A Study of SMEs
in Akwa Ibom State, Nigeria
Ntiedo B. Ekpo1 (PhD, FCA), John Udoidem2 (PhD), Ikechukwu A. Acha3 (PhD)
1,2,3
Department of Banking & Finance, University of Uyo, Nigeria
ARTICLE INFO ABSTRACT
corresponding Author:
Ntiedo B.Ekpo1 1
Department of Banking & Finance, University of Uyo, Nigeria
Most studies on growth drivers of business enterprises are based on experiences in the more-developed countries, the policy conclusions of which may not be appropriate for the development of businesses in the less-developed countries like Nigeria. This study examined the size-growth relationship in56 small and 15 medium enterprises in Akwa Ibom State, Nigeria. With number of employees and total assets as selected measures of size, Fisher Z in conjunction with the correlation model was used for the examination. Results revealed that while a small but positive relationship exists between number of employees and growth, total assets showed a negative relationship in the two groups of enterprises. Also, the Fisher Z results confirmed that the observed relationship did not differ between the two groups of sampled enterprises. In view of the mixed findings, the study recommends size as a necessary, but not sufficient variable in formulating policies for the growth of small and medium scale industries.
KEYWORDS:Enterprise size, Growth performance, Small and Medium Enterprises (SMEs).
1. Introduction
Recent developments in the global economy have clearly revealed that decisions about the Small and Medium Enterprises(SMEs) should not be left to chance, or entirely based on received doctrine. This is because this group of business entities form the great majority of businesses in almost all countries in the world, and hold the promise for the development and transformation of our economy in terms of domestic capital formation
and industrialization (Venkatraman and Ramanujam,
1998; Zahara, 1991,; Kishore, 2010). They are a vital component of every successful economy, accounting for 98% of the total employment in Indonesia, 78% in Thailand, 81% in Japan and 87% in Bangladesh (Kozak, 2007; Kishore, 2010); and has been globally acknowledged as critical
breeding and nurturing ground for domestic entrepreneurial capacities, technical skills, technological innovativeness and managerial competencies for private sector development. The significance of SMEs in the development, productivity and competitiveness of national economies is universally recognized.
growth of enterprises on a gross-sectional basis (Weiss, 1998; Trigueiros, 2000 and Piergiovanni, 2010), others support negative relationship (Hart and Oulton, 1996). Thus, the contradictory empirical results on the relationship between size and growth of enterprises has given rise to a number of opposing theories in the finance literature, ranging from those supporting a positive relationship among the underlying variables and those that do not.
One of the theories on the subject is the theory of proportionate effect propounded by Gilbrat (1931). The theory asserts that size does not affect the growth performance of enterprises. The argument is premised on the assumption that both small and large scale enterprises have equal chance to perform and grow to any desired level. In contrast to the theory, two popular schools of thought on the link between size and growth of enterprises also emerged. The first school (otherwise referred to as the traditional economic theory) argues that there is a negative relationship between sizeand growth of enterprises. The theory suggests that as enterprises attain medium or large scale level, their overall growth performance would be low and might tend to decline afterwards. The theory believes that small-scale enterprises are below the optimum size level and have very high propensity to grow faster. Small-scale enterprises require less funds to invest, market and innovate, thus making them more cost efficient. The argument as furthered by Pagano and Schivardi (2001) is that small enterprises play fundamental role in the process of job creation and growth, by fostering competition and bringing new products to the market.
Scholars in the second school of thought(the bigger the better theory) believe that medium or large enterprises have more privileges and advantages than smaller enterprises due to their size and scale of operations. Large enterprises are said to have economies of scale in many areas of
business including obtaining capital, production, and leverage of their research and development efforts.Other advantages of size include political clout, more diversified revenue streams and specialized capabilities. Small enterprises are argued to suffer disproportionately from regulations, government policies and other economic and environmental conditions because of higher fixed compliance costs and their resilience to external shocks due to limited resources (Chittenden, Kauser and Poutziouris, 2002; Ekpo, 2015).
2. Conceptual Clarifications and Empirical Review
2.1 Small and Medium Enterprises (SMEs)
Evidence from the literature has revealed that there is no universal definition of Small and Medium Enterprises (SMEs) across all academic disciplines (Nguyen, 2001; Zindiye, 2008; Maseko and Manyani, 2011 and Ekpo, 2015). This is as a result of the difficulty in obtaining a single definition that is capable of integrating all the dimensions of SMEs as well as defining the differences and peculiarities among diverse industrial sectors in different countries over time. However, SMEs may be viewed in terms of their qualitative and quantitative characteristics. The qualitative definition attempts to identify the certain characteristics which are more peculiar to small businesses than large ones. Ojo (2010) identifies the characteristics to include small scale operations, ease of entry into the economic activities and reliance on indigenous resources. The quantitative definition on the other hand focuses more explicitly on quantitative characteristics such as number of employees, value of sales and/or value of assets. The quantitative characteristics of SMEs vary from industry to industry and from country to country (Fatoki, 2011). In Nigeria, the definition changes over time and depends, to a greater extent, on institutions and the level of development.
In this paper the researcher focuses on quantitative characteristics of SMEs, and adopts the definition used by the National Policy on Micro, Small and Medium Enterprises (MSMEs), which is based on dual criteria of employment and assets. Based on the criteria, micro enterprises are those whose total assets (excluding land and buildings)are less than five million naira with a workforce not exceeding ten employees. Small enterprise on the other hand, are those total assets (excluding land and building) are worth five million naira and above but not exceeding forty-nine million naira, with a total workforce of 10 to 49 employees,
whereas medium enterprises are those whose total assets (excluding land and building) are worth fifty million naira and above, but not exceeding five hundred million naira, with a total workforce of between 50 and 199 employees. However, there is an exception to the rule. Where a disparity occurs in classification between employment and asset criteria, such as an enterprise with assets worth N5.0 million, but employs 7 persons, the employment-based classification should take precedence and the enterprise be regarded as micro.
2.2 Enterprise Size and Growth Performance
An enterprise’s size and growth are integrally connected. Studies have shown that the concept of size of enterprise is multidimensional in nature (Aregbeyen, 2010). In the corporate finance literature, various measures have been used for enterprise size, such as market value, net assets, sales turnover, capital employed, value added, total assets, number of employees, profitability and output. However, given the information available for research, enterprise size in this study only focuses on number of employees and total assets (net of land and buildings). This decision is consistent with the Nigerian National Policy on MSMEs, which categorized all enterprises based on employment and asset criteria for the purposes of government statistics.
According to Sandberg, Vinberg and Pan (2002) cited in Akinruwa, Awolusi and Ibojo (2013) growth performance is the ability of an enterprise to create value for owners, managers and other stakeholders. It is the enterprise’s success in the market, or ability to create acceptable outcomes and action (Chittitaworm, Islam, Keawchanai and Yusuf, 2011).
terms of sales, market share and wealth creation (3) stakeholders’ satisfaction and (4) competitive position which include: competitive advantage and success rate in launching new products. Traditionally, financial indicators (such as profits, productivity, and return on investment) were the primary measures of growth. But more recently, attention has been shifted from financial to less tangible and non-financial measures to include just-in-time delivery, total quality management, shareholders satisfaction and quality of products. Akinruwaet al (2013), have argued that most performance measures that are appropriate for large businesses may not always be suitable for MSMEs. In all cases, regardless of business sizes, the literature has strongly recommended the use of multiple performance measures (Hall, 1982; Cochran and Wood, 1984; Ibrahim and Rule, 1998; Alasadi and Abdelrahim, 2007, Richard and Yip, 2008). Also, Lumpkin and Dess (1996) pointed out that it is essential to recognize the multidimensional nature of the performance construct, and that a research that only considers a single dimension or narrow range of performance construct may result in misleading descriptive and normative theory building.
This study adopts a balance scorecard approach, which according to Kaplan and Norton (1996), emphasizes a balance between the use of financial and non-financial measures to achieve strategic alignment. Financial measures used are profitability, sales, output and employment growth; while the non-financial measure is the owners’ satisfaction with the business performance. This position is also consistent with the views of Atieno (2009), that both the objective and subjective measures be used to assess organizational performance.
2.3 Existing Empirical Literature
In the developed economies such as the USA, Canada, the UK and Australia studies on
enterprise size and growth relationship have long attracted the considerations of many researchers. For instance, Hall (1987)investigated the dynamics of firm growth using panel data on the publicly traded firms in the US manufacturing sector and modern econometric techniques. The study revealed that most of the change in employment at the firm level in any given year was permanent, that year-to-year growth rates were largely uncorrelated over time or with prior characteristics of the firm, and that Gibrat’s Law was weakly rejected for the smaller firms in the sample and accepted for the larger firms. Also, Evans (1987), using a sample of all firms operating in 100 manufacturing industries examined some aspects of firm dynamics and found that firm growth, the variability of firm growth, and the probability that a firm will fail decrease with firm age. The study also revealed that firm growth decreases at a diminishing rate with firm size even after controlling for the exit of slow-growing firms from the sample.
In a recent study, Vlachvei and Notta (2008) utilized financial data of 178 manufacturing and trading firms, which are listed in the Greek Stock Market between 1995 and 2000 to analyze the factors affecting the growth of Greek firms. Growth rates were defined in terms of the number of employees and sales. Using models of optimal firm size as a theoretical framework, the researchers found that the relationship between growth, size and the age of firms is very sensitive with respect to methods of estimation and growth and size definitions. Earlier on, Beck, Demirguc-Kunt and Maksimovic (2005) investigated the effect of financial, legal and corruption problems on firms’ growth rates, with data base covering 54 countries. It was found that the effect of these factors depends on firm size, and that it is consistently the smallest firms that are most constrained. The investigation also revealed that financial and institutional development weakens the constraining effects of financial, legal and corruption obstacles, but the smallest firms tend to benefit the most.
Capasso and Cefis (2010) studied the effect of the existence of natural/or exogenously imposed thresholds in firm size distributions, on estimations of the relation between firm size and variance in firm growth rates. Using a comprehensive dataset of Dutch manufacturing and service firms, the authors explained why the results in the literature on the relationship are not consistent. They argued that a natural threshold (0 number of employees or 0 total sales) and/or the existence of truncating thresholds in the data set, can lead to upwardly biased estimations of the relation. The study concluded that the only stable relation between firm size and growth rate variance is negative regardless of how the measure of firm growth is defined. Also, Pervan and Visic (2012) investigated the relationship between firm size and performance for the 2002 – 2010 period, and the results revealed that firm size
has a significant positive (although weak) influence on firm profitability.
Samuel (1965) examined the validity of Gibrat’s Law using 400 UK companies drawn from the commercial, industrial and brewery sectors. Size of the companies were measured on the basis of issued capital, resulting in 98 very large, 142 medium large, 100 small large and 60 small. The results revealed that larger firms were growing at a significantly faster rate than small firms.
3. Methodology
3.1 Data Collection Procedure and Sample
Data were collected through an in-depth examination of financial records of the enterprises, as well as face-to-face interviews with enterprises’ owners or managers. According to SMEDAN (2013), there were 1,320,700 MSMEs in Akwa Ibom State, comprising 1,319,607 micro (accounting for 99.92%); 898 small (accounting for 0.07%) and 195 medium (accounting for 0.01%).
The number of enterprises was drawn in a two-stage sampling process. First, to ensure that the two categories of SMEs were proportionately represented, and to account for the differences in sub-categories characteristics, stratified sampling method was adopted. Second, purposive random sampling method was used to select 56 small and 15 medium enterprises from their respective sub-categories. In total, a sample of 71 enterprises was used for data analysis.
3.2 Variables and their Measures
were computed by taking the difference between two years values and dividing by the earlier year value, resulting in two years growth rates for each variable (2013-2014; 2014-2015).This procedure is widely used in management research such as Rose, Westerfield and Jaffe (1999) to measure growth. On the other hand, size of enterprise was measured using number of employees and total assets (net of land and buildings)in line with the National Policy on MSMEs, which uses these parameters to classify enterprises in Nigeria. To determine whether a relationship exists between the size variables and the growth variables of the enterprises, two composite analyses were carried out for each sub-group. Correlation analysis was carried out to ascertain the degree of effect the individual independent variables have on the dependent variable. Also, to investigate whether the effect each independent variable has on the dependent variable differs significantly between the small and medium enterprises, the Fisher’s Z for test of difference between two correlation coefficients was used.
4. Results and Discussion
To estimate the reliability for scales, Cronbach’s Alpha was calculated, and a coefficient of 0.78 obtained. Nunnaly (1994) suggested that a value for Cronbach’s Alpha coefficient greater than 0.5 is acceptable for internal consistency of the scale. Demographics of the respondents have shown that 94% of the enterprises fell in the age brackets of 3 to 10 years, while only 6% were 11 years and above. Regarding economic sectors, service firms were the highest in number, 36%, followed by trading firms, 33% and manufacturing firms, 31%. Also, in the categorization of ownership structure, 30% of the enterprises were sole proprietorships, 25% were partnerships, while 46% had limited liability status. All the enterprises were registered with the Corporate Affairs Commission of Nigeria, and could be reasonably assumed to be paying their corporate taxes.
The study aimed at examining the effects of the independent variables (number of employees and total assets)on the dependent variable (growth performance), and whether the effects differ between small and medium enterprises. Before testing the hypotheses of the study, one-to-one relations among the dimensions of enterprise size and growth performance have been investigated via correlation analysis. The results of correlation between the variables in small enterprises is presented in tables 4.1.
Table 4.1: Correlation between dependent and independent variables in small enterprises
Growth performance
Number of employees
Total assets Growth
performance
1.000
0.181
- 0.141 Number of
employees
0.181
1.000 0.262 Total assets - 0.141 0.262 1.000
Source: Field survey (2016).
From the above table, the correlation (r) value of 0.181 indicate that there is a weak positive rank correlation between number of employees and growth of small enterprises. The positive value of (r) implies that an increase in the dependent variable would result in an increase in the independent variable and vise-versa. Conversely, the negative correlation value of r (= -0.141) indicates that there is a weak negative rank correlation between total assets and growth performance of small enterprises. The implication is that both the dependent and in dependent variables tend to move in opposite direction. That is, as one increases, the other decreases.
Table 4.2: Correlation between dependent and independent variables in medium enterprises
Growth performance
Number of employees
Total assets Growth
performance
1.000
0.282
- 0.264 Number of
employees
0.282
1.000 0.578 Total assets - 0.264 0.578 1.000
Source: Field survey (2016).
Table 4.2 discloses a positive correlation (r) value of 0.282, indicating a weak rank correlation between number of employees and growth of medium enterprises. The positive value of (r) means that both the dependent and independent variables move in the same direction; an increase in one would result in an increase in the other. Similarly, the negative correlation value of (r) (= -0.264) indicates that there is a weak negative relationship between total assets and growth of medium enterprises. This implies that the dependent and independent variables move in opposite direction. That is, as one increases, the other decreases.
As can be seen in tables 4.1 and 4.2, the correlation analyses have given some evidence of individual effects of enterprise size dimensions on growth performance. The correlation coefficients between number of employees and growth performance are0.181 and 0.282 for small and medium enterprises respectively. Although both show a positive correlation, number of employees could be said to have more impact on growth in medium enterprises than small enterprises. This is also the case with total assets with negative correlations of -0.141 and -0.264 for small and medium enterprises respectively, and of which negative impact is more on medium enterprises than small enterprises.
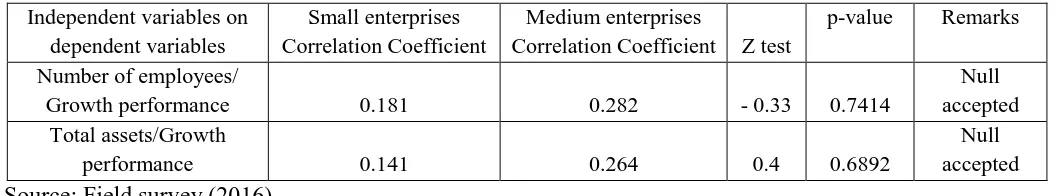
However, the findings of correlations are subject to confirmatory tests (test of hypotheses). The essence of the hypotheses is to find out whether the degree of impact which each independent variable has on growth performance differs significantly between the small and medium enterprises or whether the observed difference in the correlation results was due to chance. The summary of empirical results on test of the hypotheses is presented in table 4.3.
Table 4.3: Summary of calculation of Fisher Z for test of hypotheses
Independent variables on dependent variables
Small enterprises Correlation Coefficient
Medium enterprises
Correlation Coefficient Z test
p-value Remarks
Number of employees/
Growth performance 0.181 0.282 - 0.33 0.7414
Null accepted Total assets/Growth
performance 0.141 0.264 0.4 0.6892
Null accepted
Source: Field survey (2016).
As indicated in table 4.3, the correlation coefficient (r) of number of employees for small enterprises is 0.181 and medium enterprises 0.282. The Z tests reveals that the P-value (0.7414) is greater than the level of significance α(=0.05), implying that there is no significant difference between the two correlation coefficients, number of employees have positive impact on both small
and medium enterprises. The observed difference in the correlation coefficients was therefore due to chance. Thus, the null hypothesis that the effects of number of employees on growth performance does not differ significantly between small and medium enterprises is supported.
confirming that total assets have negative impacts on both small and medium enterprises. Again, the observed difference in the correlation coefficients of -0.141 and -0.264 for small and medium enterprises respectively was due to chance. Accordingly, the Fisher Z for test of difference in the two correlation coefficients has provided evidence for the acceptance of the null hypothesis that the effects of total assets on growth performance does not differ significantly between small and medium enterprises.
The results of the hypotheses are contrary to the findings of
5. Conclusion
The efforts of this study was an attempt to investigate the effects of enterprise size on growth of small and medium enterprises, and whether the effects differ between the enterprise groupings in Akwa Ibom State, Nigeria. On the basis of survey data, it was possible to establisha positive and significant correlation across the enterprise size groupings and growth performance. It was also evident from the findings of the study that while the effects of number of employees on growth performance did not differ significantly between small and medium enterprises, whereas the effects of total assets differed.
From the empirical findings, the study finds no clear evidence to supportthe research hypotheses on the relationship between size and growth of SMEs in Akwa Ibom State. It is however, recommended that size may be used to complement other factors in formulating policies for the development of small and medium scale industries. Furthermore, since the study was conducted based on cross-sectional data with the attendant difficulty in looking at changes over time, longitudinal research model may provide a clearer picture of the relationship across the enterprise groupings.
References
1. Akinruwa, T. E., Awolusi, O. D. and Ibojo, B. O. (2013). Determinants of small and medium enterprises (SMEs) in Ekiti State, Nigeria: A business survey approach.
Journal of Humanities and Social Sciences. 27(1):1-23.
2. Alasadi, R. and Abdelrahim, A. (2007). Critical analysis and modelling of small business performance (Case study: Syria).
Journal of Asia Entrepreneurship and Sustainability. 3(2):5-22
3. Aregbegyen, O. (2010). Firm size and growth relationship: Evidence from Nigeria. Nigerian Journal of Securities and Finance, 15(1):7-29.
4. Atieno, R. (2009). Linkages, asses to finance and the performance of small-scale enterprises in Kenya. Journal of Accounting and Business Research. 3(1):33-48.
5. Beck, T., Demirguc-Kunt, A. and Maksimovic,
V. (2005). Financial and legal constraints to growth: Does firm size matter? The Journal of Finance, Vol. LX, No. 1, 137-177. 6. Capasso, M. and Cefis, E. (2010). Firm size
and growth rate variance: The Effects of data truncation. Utrecht School of Economics, Tjalling C. Koopmans Research Institute, Discussion Paper Series 10-23. 7. Chittenden, F., Kauser, S. and Poutiouris,
P. (2002). Regulatory burdens of small business: A literature review. Available at:
http://www.sbs.gov.uk/content/analytical/re
search/Regulation-Report.pdf (Accessed:
September 25, 2016).
8. Chittithaworn, C., Islam, M. A., Keawchana, T. and Yusuf, D. H. (2011). Factors affecting business success of small and medium enterprises in Thailand.
Journal of Asian Social Science. 7(5):1-11. 9. Cochran, R. L., and Wood, R. A. (1984).
performance. Academy of Management Journal. pp. 736-742.
10.Ekpo, N. B. (2015). Financial management practices and growth performance of micro, small and medium enterprises in Akwa Ibom State, Nigeria. PhD Thesis, University of Uyo, Nigeria.
11.Evans, D. S. (1987). The Relationship between firm growth, size and age:
Estimates for 100 manufacturing industries.
The Journal of Industrial Economics, 35(4): 567-581.
12.Fatoki, O.O. (2011). The Impact of Human, Social and Financial Capital on the Performance of Small and Medium-sized Enterprises (SMEs) in South Africa.
Journal of Social Sciences. 29(3):193-204. 13.Garrigos-Simon, F. J., Marques, D. P. and
Narangajavana, Y. (2005). Comparative strategies and performance in Spanish Hospitality Firms. International Journal of Contemporary Hospitality Management.
17(1):22-38.
14.Gilbrat,R. (1931). Les inegaliteseconomiques. Librairie du RecueilSirey, Paris.
15.Hall, R. H. (1982). Organizations: Structure and process. Englewood Cliffs, N. J. Prentice Hall.
16.Hall, B. H. (1987). The Relationship between firm size and firm growth in the US manufacturing sector. The Journal of Industrial Economics, XXXV (4):0022-1821. 17.Hart, P. E. and Oulton, N. (1996). Growth and size of firms. The Economic Journal, 106(438): 1242-1252.
18.Ibrahim, N. and Rue, L. (1998). The
Relationship between planning sophistication
and performance in small business. Journal
of Small Business Management. 36(4):24-32.
19.Kaplan, R. and Norton, D. (1996). Using the balanced scorecard as a strategic management system, Harvard Business Review, pp. 75-85
20.Kishore, J. (2010). MSME-the growth engine of Indian economy. Speech by Sr. Vice President, IIA, at a seminar organized by IIA in Meerut, 25 April. Available at:
iiaonline.in/docfiles/growth%20engine.pdf
(Accessed: April 15, 2014), pp. 2-14. 21.Kozak, R. (2007). E-Commerce barriers for
small and medium-sized enterprises (SMEs)
Worldwide and Turkish Travel Agencies.
E-Journal of New World Science Academy,
4(4): 307-319.
22.Lumpkin G.T. and Dress G.G. (1996). Clarifying the entrepreneurial orientation construct and linking it to performance.
Academy of management review. 21(1): 135-172.
23.Maseko, O. and Manyani, O. (2011). Accounting practices of SMEs in Zimbabwe: An investigative study of record keeping for performance measurement (A case study of Bandura). A journal of Accounting and Taxation. 3(8):171-181. 24.Nguyen, K. M. (2001).Financial management
and profitability of small and medium enterprises. DBA Thesis, Lismore, NSW: Southern Cross University.
25.Nunnally, J. C. (1994). Psychometric theory
(2nd Edition). New York: McGraw-Hill. 26.Ojo, A.T. (2010). The Nigerian maladapted
financial system: Reforming tasks and development dilemma. Lagos Nigeria: The CIBN Press Limited. pp. 343-380.
27.Pagano, P. and Schivardi, F. (2001). Firm size distribution and growth. Bank of Italy, Research Department, pp. 1-36.
28.Pervan, M. and Visic, J. (2012). Influence of firm size on its business success.
Croatian Operational Research Review, 3:1-11.
29.Piergiovanni, R. (2010). Gilbrat’s Law in the ‘Third Italy’: Firm growth in the Veneto
30.Richard, P. D. and Yip, G. J. (2008). Measuring organisational performance as a
dependent variable: Towards methodological
bestpractice. Available at:
http://ssrn.com/abstract=814285
(Accessed: March 14, 2014).
31.Ross, S. A., Westerfield, R. W. and Jaffee, J. (1999). Corporate finance (5th edition). Boston: Irwin and McRaw-Hill.
32.Samuel, J. (1965). Size and the growth of firms. Review of Economic Studies, 32(1): 105-112.
33.Sandberg, K., Vinberg, S. and Pan, Y. (2002). An exploratory study of women in micro enterprises: Owner perception of economic policy in rural municipality; gender-related differences. In: CD- Proceedings of 12th Nordic Conference on Small Business Research. Kuopio Finland, May 26-28, 2014.
34.Trigueiros, D. (2000). A Theoretical definition and statistical description of firm size. Available at:
iscte-iul>pt>home>~dmt>publ>20…
(Accessed: Sept. 25, 2016) pp. 1-25.
35.Venkatraman, N. and Ramanujam, V.(1998).
Measurement of business performance in strategy research: A comparison of approaches. The Academy of Management Review, 11(4): 801- 814.
36.Vlachvei, A. and Notta, O. (2008). Firm growth, size and age in Greek firms.
International Conference on Applied
Economics, pp. 1-7.
37.Weiss, C. R. (1998). Firm size, firm growth and survival in the upper Austrian farm sector. Small Business Economics, 10(4): 305-312.
38.Zahra, S. A. (1991). Predictors and financial outcomes of corporate entrepreneurship: An exploratory study. Journal of Business Venturing, 8: 319-340.
39.Zindiye, S. (2008). Anempirical investigation into the factors affecting the performance of small and medium enterprises in the manufacturing industry of Harare,