Everant.org/AFMJ
Account and Financial Management Journal ISSN: 2456-3374 Impact Factor: 4.614
Evaluation of Technical Efficiency in the Reflection of the Bank
Management
Olena Khrystoforova1, Rami Matarneh2, Vyacheslav Lyashenko3
1Department of economics, management and business, Kharkiv Institute of Banking of the University of Banking of the National Bank of Ukraine, Kharkiv, Ukraine
2Department of Computer Science, Prince Sattam Bin Abdulaziz University, Al-Kharj, Saudi Arabia 3Department of Informatics, Kharkiv National University of RadioElectronics, Kharkiv, Ukraine
Corresponding Author: Rami Matarneh2
2Department of Computer Science, Prince Sattam Bin Abdulaziz University, Al-Kharj, Saudi Arabia
ARTICLE INFO
ABSTRACT
corresponding Author: Rami Matarneh
Department of Computer Science, Prince Sattam Bin Abdulaziz University, Al-Kharj, Saudi Arabia
Banks play an important role in the financial system of the country. Therefore, it is necessary to consider the effectiveness of management by each bank. We consider the relationship between the technical efficiency of banking and the costs of conducting banking activities. We showed consistency between technical efficiency and cost per unit volume of loans. However, this can not be argued from the point of view of attracting resources to banks deposit accounts. The analysis is carried out on a sample of banks in Ukraine within the period from 2009 to 2014 years.
KEYWORDS: Technical efficiency, bank management, stochastic efficiency boundary, costs, loans.
INTRODUCTION
Banks play an important role in the formation and transformation of free financial resources between various business entities. Together with the stock market, banks are able to transform and redistribute free financial resources taking into account all participants interests in such processes. It is also important to take into account banks existing interconnection and interaction, both with business entities in the real economy sector, and between banks. It can be explained by the fact that each bank functioning, bank effective management depends on the balance of input and output financial flows mutual movement, which in their turn are determined by the interaction between all participants in economic relations (A.
Kuzemin and V. Lyashenko, 2009; A. Kuzemin and V. Lyashenko, 2008; A. Ataullah, T. Cockerill and H. Le, 2004).
Bank output financial flows are associated with the bank's active operations, and input financial flows are associated with the bank's passive operations (A. Kuzemin and V. Lyashenko, 2008; G. Allayannis and A. Mozumdar, 2004). Thus, banks input and output financial flows balance mutual analysis allows not only to assess the banking activities overall effectiveness, but also to analyze bank management effectiveness.
experiencing various economic difficulties, it is important to consider as input flows - funds on deposit resources amount, and as output financial flows - the bank lending volume (G. Allayannis and A. Mozumdar, 2004; I. A. Dobrovolskaya and V. V. Lyashenko, 2013).
In this case, the definition, disclosure and generalization of any possible banking activities assessment is an important practical condition for disclosing bank management effectiveness.
METHODOLOGY
Banking activities effectiveness assessment can be carried out by indicators set considering using different approaches to obtain such assessments.
Among the indicators used for considering banking activities effectiveness assessments we can distinguish (A. S. Cebenoyan and P. E. Strahan, 2004; A. Ataullah, T. Cockerill and H. Le, 2004; J. Goddard, P. Molyneux, J. O. Wilson and M. Tavakoli, 2007; N. Bayraktar and Y. Wang, 2004):
– the value of the effective credit rate, which depicts the real relative income, obtained on the whole within a year;
– the net resulted income, which generalizes absolute meanings of the result obtained from bank credit activity;
– the domestic norm of profitability, reflecting debit percentage rate, according to which loans are viable and many others.
Among the approaches for banking activities assessments obtaining, it should be noted (A. S. Cebenoyan and P. E. Strahan, 2004; N. Bayraktar and Y. Wang, 2004):
– the approach, based on the analysis of a battery of indicators of lending quality rating as some integral rating;
– the approach, based on taking into account lending risks;
– the approaches on the basis of statistic analysis methods;
– the approaches on the basis of fuzzy set theory – the methods of distribution-free analysis.
The most common approach to assessing banking activities effectiveness is methods that operate with technical efficiency concept using. Technical efficiency is the efficiency that allows to determine the assesment of the ability to get the maximum output (a certain result) using a number of inputs that reveal achieving a certain result (maximum input) possibility various factors combination (M. J. Farrell and M. Fieldhouse, 1962).
Technical efficiency using in the field of banking activities analysis is presented in number of works (K. Raghoober, R. B. Babajee, N. G. Ramdhany and B. Seetanah, 2017; S. A. George, 2016; M. Kumar, V. Charles and C. S. Mishra, 2016; W. P. Wong and Q. Deng, 2016).
For the purpose of uncovering technical efficiency in the field of banking activity analysis one constructs the so called efficiency border, which is typical for the methodology of stochastic boundaries analysis. The essence of such a methodology, according to studies of M. J. Farrell (1957; 1962), D. Aigner, C. A. L. Lovell and P. Schmidt (1977), G. E. Battese and T. J. Coelli (1992) lies in:
– constructing the efficiency boundaries of the process or the phenomenon under research using the methods of statistic analysis in the form of some regressive dependence between the variables, chosen for such an analysis;
– positioning the process, phenomenon or object under investigation relative to the efficiency boundary obtained;
) | w ( M i e i i
EF
, (1)
which EFi – technical efficiency (further also just
efficiency) of the process, phenomenon or object
under research (i,i1,P, P – a general number of
the processes, phenomena or objects under research. In this case it is a number of banks under research, which realize lending of the business entity of the real sector of the Ukraine’s economy);
) | w (
M i i - a conditional mathematic
expectation of a magnitude ui where estimated
values i which are the complex constituent
occasional members of the model for obtaining the efficiency boundaries of the process, object or phenomenon under research using the methods of a statistic analysis:
g(x,B)
z , (2)
w v
, (3)
where z – is a vector of the results under research;
x – is a vector of resources, used for obtaining results under research;
g – is a function of the efficiency boundary under research;
B – is a vector of function g parameters;
– a complex constituent random member of the model, which on the whole reflects inaccuracy of the model;
v – is a vector of random fluctuations of the model;
w – is a vector, characterizes technical inefficiency of the activity of the process, phenomenon or an object under research. On the assumption of the requirement of positive values of all constituent vectors v and w, it is supposed, that these random components of the formalization of the efficiency boundary model can have in particular, a form of half-normal
distribution N(0,2) and wN(0,2w), but
their values 2 and 2w.
At the same time, taking into account an unusual structure of the inaccuracies of the efficiency boundary model, which has an asymmetric distribution and consists of two constituents, the remainders of the regression are principally assessed by the method of maximal plausibility. It is also worth mentioning, that at the whole the function model of the efficiency boundaries of the processes, phenomena or objects under research for obtaining the efficiency values, can be defined in a form of translog function or its reductive conception in a form of Kobb-Duglas’s function.
For uncovering stochastic efficiency boundary when studying technical efficiency in the analysis of banking activity is made according to the following approaches for the direct description of banking activity:
– an industrial approach, which regards to banks as the suppliers of services for depositors and borrowers (I. Hasan and K. Marton, 2003);
– an operational approach, the aim of which is determination of the efficiency of the income obtained, despite the fact at the expense of which resources and products such an income was obtained (I. Hasan and K. Marton, 2003);
– an intermediary approach, in measures of which the banks are regarded to as an intermediate between depositors and borrowers (I. Hasan and K. Marton, 2003).
DATA ANALYSIS MODEL
Model of the efficiency stochastic boundary for assessment technical efficiency in the analysis of banking activity can be generalized as following (M. Ahmad, G. Kots and V. Lyashenko, 2015):
i i i 3 i 2 i 1 0 i w v ) AOB ln( B ) DPB ln( B ) MBR ln( B B ) KRB ln(
where KRBi - lending capacity of business
entities in the real sector of economy in the context of each i-th from the group of banks under study on the certain date of time, mn. hrn.;
i
MBR – funds of other banks, that are
attracted by means of interbank lending market in the context of each i-th from the group of banks under study on the certain date of time, mn. hrn.;
i
DPB – a volume of the funds attracted in
the form of deposits from natural and legal persons – bank customers in the context of each i-th from i-the group of banks under study on i-the certain date of time, mn. hrn.;
i
AOB – a volume of administrative and
other costs in the context of each i-th from the group of Ukraine’s banks under study on the certain date of time, mn. hrn.
Administrative and other operating costs in general characterize the i-th bank costs level. Then we can also consider the bank cost effectiveness to perform some banking activities. For example, from the point of view of attracted funds to the bank's deposit accounts or in terms of loans issued volume. In formalized form it can be represented in next way:
i i i
KRB AOB
EFKR , (5)
i i i
DPB AOB
EFDR , (6)
where EFKRi – expenses in the context of the i –
th bank on the volume unit of loans issued;
i
EFDR – expenses in the context of the i –
th bank on the volume unit of attracted resources to its deposit accounts.
Then comparison of technical efficiency (EFi )
and corresponding expenses per volume unit of financial resources input or output flow (EFKRiand EFDRi) provides an opportunity to
conduct additional banking activities and bank management effectiveness analysis.
DATA
In this paper we will consider technical efficiency values (EFi), which were obtained earlier in the
works M. Ahmad, G. Kots, V. Lyashenko (2015) and M. A. Ahmad, G. P. Kots, V. V. Lyashenko (2016).
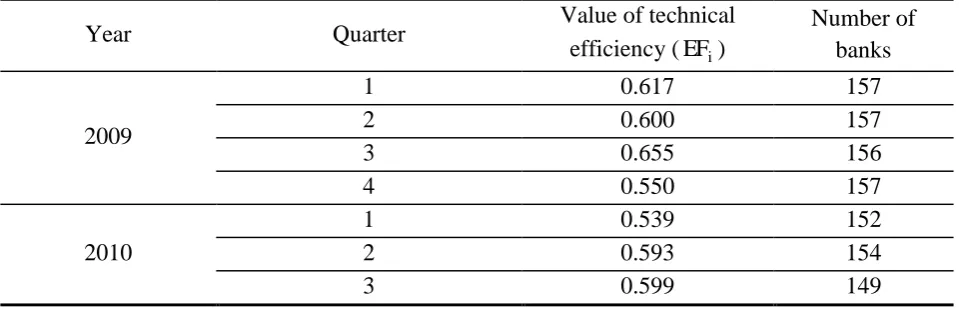
Technical efficiency change dynamics (EFi) for
Ukraine bank system in its quarterly measurement is represented in Table 1.
Table 1 shows that technical efficiency importance in assessing banking activity in accordance with the formula (4) during the analyzed time period decreases. Therefore, it is also important to analyze banking management effectiveness. At the same time, such an analysis should be made in the context of input and output financial flows.
Table 1: Technical efficiency change dynamics (EFi) for Ukraine bank system
Year Quarter Value of technical
efficiency (EFi)
Number of banks
2009
1 0.617 157
2 0.600 157
3 0.655 156
4 0.550 157
2010
1 0.539 152
2 0.593 154
4 0.561 154
2011
1 0.527 154
2 0.524 154
3 0.531 154
4 0.528 151
2012
1 0.492 155
2 0.442 156
3 0.456 154
4 0.463 148
2013
1 0.527 152
2 0.536 156
3 0.487 154
4 0.556 154
2014
1 0.388 154
2 0.518 141
3 0.548 137
4 0.502 127
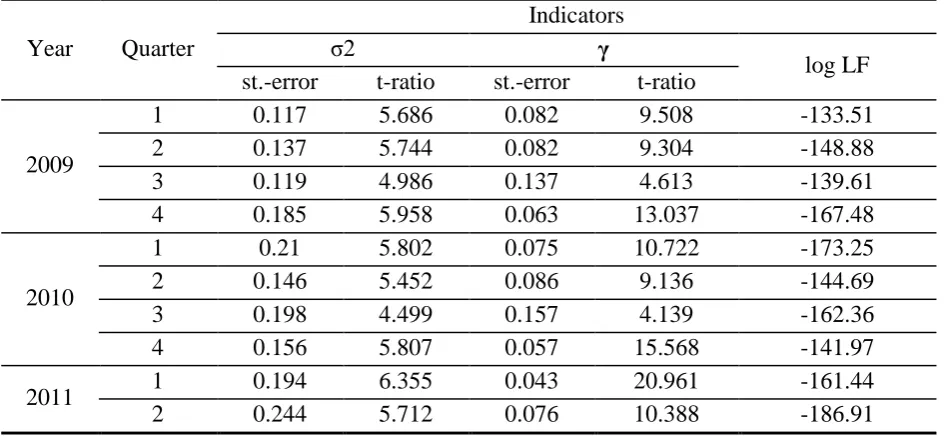
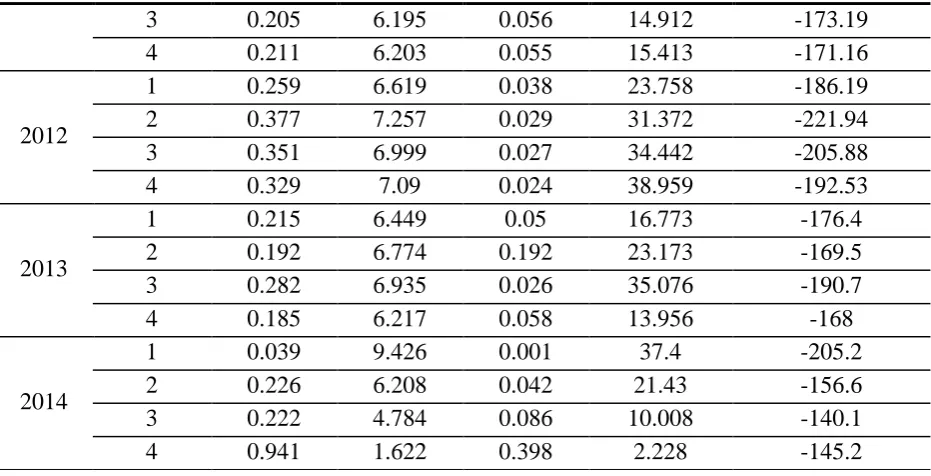
Table 2 shows data significance for Table 1. In table 2 depicts:
statistic values (standard error and t-ratio at the relevancy level 0.05 for certain periods of
time) of full dispersion inaccuracy 2 22w,
which determines the key parameters of occasional components distribution in the model under study (4);
statistic values (a standard error and t-ratio at the relevancy level 0.05 for certain periods of
time) of inefficient constituent share 2 2 w
in
full dispersion of inaccuracy;
a ratio of a logarithm function of maximal likelihood (LR) for certain periods of time.
Table 2: Indicators of the significance of the results for Table 1
Year Quarter
Indicators
σ2 γ
log LF st.-error t-ratio st.-error t-ratio
2009
1 0.117 5.686 0.082 9.508 -133.51
2 0.137 5.744 0.082 9.304 -148.88
3 0.119 4.986 0.137 4.613 -139.61
4 0.185 5.958 0.063 13.037 -167.48
2010
1 0.21 5.802 0.075 10.722 -173.25
2 0.146 5.452 0.086 9.136 -144.69
3 0.198 4.499 0.157 4.139 -162.36
4 0.156 5.807 0.057 15.568 -141.97
2011 1 0.194 6.355 0.043 20.961 -161.44
3 0.205 6.195 0.056 14.912 -173.19
4 0.211 6.203 0.055 15.413 -171.16
2012
1 0.259 6.619 0.038 23.758 -186.19
2 0.377 7.257 0.029 31.372 -221.94
3 0.351 6.999 0.027 34.442 -205.88
4 0.329 7.09 0.024 38.959 -192.53
2013
1 0.215 6.449 0.05 16.773 -176.4
2 0.192 6.774 0.192 23.173 -169.5
3 0.282 6.935 0.026 35.076 -190.7
4 0.185 6.217 0.058 13.956 -168
2014
1 0.039 9.426 0.001 37.4 -205.2
2 0.226 6.208 0.042 21.43 -156.6
3 0.222 4.784 0.086 10.008 -140.1
4 0.941 1.622 0.398 2.228 -145.2
The data in Table 2 confirm technical efficiency values significance, which are reflected in Table 1.
RESULTS AND DISCUSSION
At first, we will analyze the overall technical efficiency indicator (EFi) value changes dynamics
for all banks. To do this, we will consider the overall technical efficiency indicator (EFi) change
dependence for all banks, starting from its minimum values to the maximum values. We will
analyze this dynamic for each year, taking into account separate year quarters.
Figure 1, Figure 2, Figure 3, Figure 4, Figure 5 and Figure 6 present the overall technical efficiency indicator (EFi ) change dynamics for
Ukraine bank system.
0.00E+00 1.00E-01 2.00E-01 3.00E-01 4.00E-01 5.00E-01 6.00E-01 7.00E-01 8.00E-01 9.00E-01 1.00E+00
1 7 13 19 25 31 37 43 49 55 61 67 73 79 85 91 97 103 109 115 121 127 133 139 145 151 157 Banks Technical efficiency
1 quarter 2009 2 quarter 2009 3 quarter 2009 4 quarter 2009
Fig. 1. Dynamics of change in the indicator of technical efficiency (EFi) for the banking system of Ukraine
0.00E+00 1.00E-01 2.00E-01 3.00E-01 4.00E-01 5.00E-01 6.00E-01 7.00E-01 8.00E-01 9.00E-01 1.00E+00
1 7 13 19 25 31 37 43 49 55 61 67 73 79 85 91 97 103 109 115 121 127 133 139 145 151 Banks Technical efficiency
1 quarter 2010 2 quarter 2010 3 quarter 2010 4 quarter 2010
Fig. 2. Dynamics of change in the indicator of technical efficiency (EFi) for the banking system of Ukraine
in 2010
0.00E+00 1.00E-01 2.00E-01 3.00E-01 4.00E-01 5.00E-01 6.00E-01 7.00E-01 8.00E-01 9.00E-01 1.00E+00
1 7 13 19 25 31 37 43 49 55 61 67 73 79 85 91 97 103 109 115 121 127 133 139 145 151 Banks Technical efficiency
1 quarter 2011 2 quarter 2011 3 quarter 2011 4 quarter 2011
Fig. 3. Dynamics of change in the indicator of technical efficiency (EFi) for the banking system of Ukraine
in 2011
0.00E+00 1.00E-01 2.00E-01 3.00E-01 4.00E-01 5.00E-01 6.00E-01 7.00E-01 8.00E-01 9.00E-01 1.00E+00
1 7 13 19 25 31 37 43 49 55 61 67 73 79 85 91 97 103 109 115 121 127 133 139 145 151 Banks Technical efficiency
1 quarter 2012 2 quarter 2012 3 quarter 2012 4 quarter 2012
Fig. 4. Dynamics of change in the indicator of technical efficiency (EFi) for the banking system of Ukraine
0.00E+00 1.00E-01 2.00E-01 3.00E-01 4.00E-01 5.00E-01 6.00E-01 7.00E-01 8.00E-01 9.00E-01 1.00E+00
1 7 13 19 25 31 37 43 49 55 61 67 73 79 85 91 97 103 109 115 121 127 133 139 145 151 Banks Technical efficiency
1quarter 2013 2 quarter 2013 3 quarter 2013 4 quarter 2013
Fig. 5. Dynamics of change in the indicator of technical efficiency (EFi) for the banking system of Ukraine
in 2013
0.00E+00 2.00E-01 4.00E-01 6.00E-01 8.00E-01 1.00E+00 1.20E+00
1 7 13 19 25 31 37 43 49 55 61 67 73 79 85 91 97 103 109 115 121 127 133 139 145 151 Banks Technical efficiency
1 quarter 2014 2 quarter 2014 3 quarter 2014 4 quarter 2014
Fig. 6. Dynamics of change in the indicator of technical efficiency (EFi) for the banking system of Ukraine
in 2014
Figure 1 – Figure 6 analysis shows that technical efficiency indicator (EFi ) change dynamics for
Ukraine bank system changes during each year, and also from year to year.
This is especially evident for technical efficiency indicator ( EFi ) quarterly changes for Ukraine
bank system. However, we can also point to general trends of technical efficiency indicator (EFi) changes for Ukraine bank system.
Now we consider the mutual dynamics of technical efficiency indicator (EFi) and indicators
i
EFKR , EFDRi.
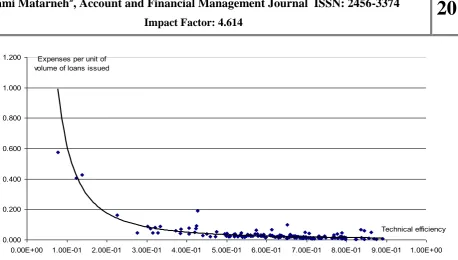
Figure 7 and Figure 8 show mutual dynamics EFi
and EFKRi, EFi and EFDRi respectively. In this
case we consider EFKRi or EFDRi values
0.000 0.200 0.400 0.600 0.800 1.000 1.200
0.00E+00 1.00E-01 2.00E-01 3.00E-01 4.00E-01 5.00E-01 6.00E-01 7.00E-01 8.00E-01 9.00E-01 1.00E+00 Technical efficiency Expenses per unit of
volume of loans issued
Fig. 7. Mutual dynamics of technical efficiency and costs per unit of volume of loans issued (the result of the first quarter of 2009 for the banking system of Ukraine)
0.000 0.100 0.200 0.300 0.400 0.500 0.600 0.700 0.800
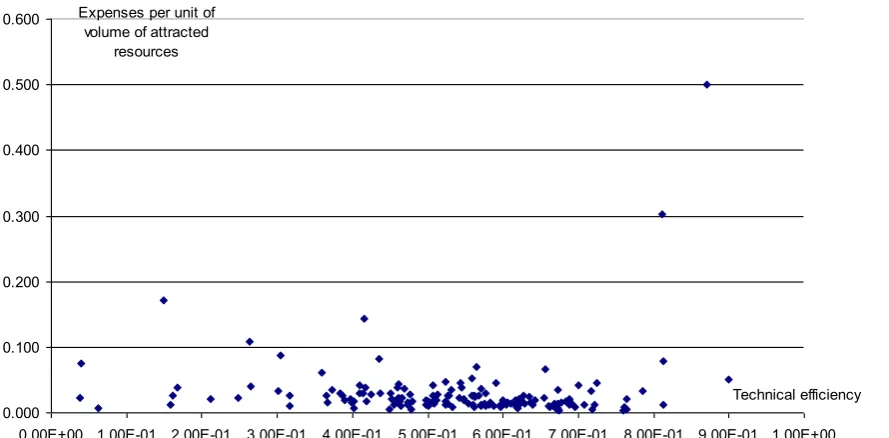
0.00E+00 1.00E-01 2.00E-01 3.00E-01 4.00E-01 5.00E-01 6.00E-01 7.00E-01 8.00E-01 9.00E-01 1.00E+00 Technical efficiency Expenses per unit of
volume of attracted resources
Fig. 8. Mutual dynamics of technical efficiency and costs per unit of attracted resources (the result of the first quarter of 2009 for the banking system of Ukraine)
Figure 7 shows that the mutual dynamics of technical efficiency and expenses per volume unit of loans issued has a certain tendency (look at the trend line – the solid curve in Figure 7). This trend means that technical efficiency values increase with decreasing expenses per volume unit of loans issued.
0.000 1.000 2.000 3.000 4.000 5.000 6.000 7.000 8.000
0.00E+00 1.00E-01 2.00E-01 3.00E-01 4.00E-01 5.00E-01 6.00E-01 7.00E-01 8.00E-01 9.00E-01 1.00E+00 Technical efficiency Expenses per unit of
volume of loans issued
Fig. 9. Mutual dynamics of technical efficiency and costs per unit of volume of loans issued (the result of the first quarter of 2010 for the banking system of Ukraine)
0.000 0.500 1.000 1.500 2.000 2.500
0.00E+00 1.00E-01 2.00E-01 3.00E-01 4.00E-01 5.00E-01 6.00E-01 7.00E-01 8.00E-01 9.00E-01 1.00E+00 Technical efficiency Expenses per unit of
volume of attracted resources
0.000 0.200 0.400 0.600 0.800 1.000 1.200 1.400 1.600
0.00E+00 1.00E-01 2.00E-01 3.00E-01 4.00E-01 5.00E-01 6.00E-01 7.00E-01 8.00E-01 9.00E-01 1.00E+00 Technical efficiency Expenses per unit of
volume of loans issued
Fig. 11. Mutual dynamics of technical efficiency and costs per unit of volume of loans issued (the result of the first quarter of 2013 for the banking system of Ukraine)
0.000 0.100 0.200 0.300 0.400 0.500 0.600
0.00E+00 1.00E-01 2.00E-01 3.00E-01 4.00E-01 5.00E-01 6.00E-01 7.00E-01 8.00E-01 9.00E-01 1.00E+00 Technical efficiency Expenses per unit of
volume of attracted resources
Fig. 12. Mutual dynamics of technical efficiency and costs per unit of attracted resources (the result of the first quarter of 2013 for the banking system of Ukraine)
Thus, we can argue that from the point of view of bank's credit resources management effectiveness and its technical efficiency values, there is complete consistency. However, this can not be argued from the point of view of attracting
CONCLUSION
We examined one of the approaches to analyzing banking effectiveness. This approach combines various classical methods that allows to disclose the consequences of influence on conducting banking activities effectiveness from various factors side and provide a comparable assessment bank management in the context of its individual activities.
We also examined the analytical tools that allow to analyze the effectiveness of banking activities particular direction conducting in a holistic way, taking into account various factors of impact (the ability to provide loans, bank's resource base adequacy, bank's personnel efficiency). Specific examples number is given. It allows to analyze credit resources allocation and resources attraction to Ukrainian banks deposit accounts managing effectiveness.
REFERENCES
1. Ahmad, M., Kots, G., & Lyashenko, V. (2015). Bank Lending Efficiency in the Real Sector of the Economy of Ukraine within the Period of 2011 to 2014 Years. Modern Economy, 6, pp. 1209-1218. 2. Ahmad, M. A., Kots, G. P., & Lyashenko,
V. V. (2016). Statistical Study of Bank Lending Efficiency in the Real Sector of the Economy of Ukraine within the Period of Years 2009 to 2012. Asian Academic Research Journal of Multidisciplinary, 3(2), pp. 104-120.
3. Aigner, D., Lovell, C. A. L., & Schmidt, P. (1977). Formulation and estimation of stochastic frontier production function models. Journal of econometrics, 6(1), pp. 21-37.
4. Allayannis, G., & Mozumdar, A. (2004). The impact of negative cash flow and influential observations on investment– cash flow sensitivity estimates. Journal of Banking & Finance, 28(5), pp. 901-930.
5. Ataullah, A., Cockerill, T., & Le, H. (2004). Financial liberalization and bank efficiency: a comparative analysis of India and Pakistan. Applied Economics, 36(17), pp. 1915-1924.
6. Battese, G. E., & Coelli, T. J. (1992). Frontier production functions, technical efficiency and panel data: with application to paddy farmers in India. Journal of productivity analysis, 3(1-2), pp. 153-169. 7. Bayraktar, N., & Wang, Y. (2004). Foreign
bank entry, performance of domestic banks, and sequence of financial liberalization. World Bank Policy Research Working Paper, (3416).
8. Cebenoyan, A. S., & Strahan, P. E. (2004). Risk management, capital structure and lending at banks. Journal of Banking & Finance, 28(1), pp. 19-43.
9. Dobrovolskaya, I. A., & Lyashenko, V. V. (2013). Interrelations of banking sectors of European economies as reflected in separate indicators of the dynamics of their cash flows influencing the formation of the resource potential of banks. European Applied Sciences, 1-2, pp. 114-118.
10.Farrell, M. J. (1957). The measurement of productive efficiency. Journal of the Royal Statistical Society. Series A (General), 120 (3), pp. 253-290.
11.Farrell, M. J., & Fieldhouse, M. (1962). Estimating efficient production functions under increasing returns to scale. Journal of the Royal Statistical Society. Series A (General), pp. 252-267.
12.George, S. A. (2016). Productive efficiency, service quality and profitability: a comparative analysis of foreign and private banks in India. International Journal of productivity and Quality Management, 18(4), pp. 518-536.
An overview. Journal of Banking & Finance, 31(7), pp. 1911-1935.
14.Hasan, I., & Marton, K. (2003). Development and efficiency of the banking sector in a transitional economy: Hungarian experience. Journal of Banking & Finance, 27(12), pp. 2249-2271.
15.Jondrow, J., Knox Lovell, C. A., Materov, I. S., & Schmidt, P. (1982). On the estimation of technical inefficiency in the stochastic frontier production function model. Journal of econometrics, 19(2), pp. 233-238.
16.Kumar, M., Charles, V., & Mishra, C. S. (2016). Evaluating the performance of indian banking sector using DEA during post-reform and global financial crisis. Journal of Business Economics and Management, 17(1), pp. 156-172.
17.Kuzemin A., & Lyashenko V. (2009). Methods of comparative analysis of banks
functioning: classic and new approaches.
International Journal Information
Theories & Applications, 16(4), pp. 384-396.
18.Kuzemin, A., & Lyashenko, V. (2008). Analysis of Spatial-temporal Dynamics in the System of Economic Security of Different Subjects of Economic
Management. International Journal Information Technologies and Knowledge, 2(3), pp. 234–238.
19.Raghoober, K., Babajee, R. B., Ramdhany, N. G., & Seetanah, B. (2017). An Analysis of the Efficiency of the Mauritian Banking Sector Using the Data Envelopment Analysis (DEA). Theoretical Economics Letters, 7(05), pp. 1423.