Issues
ISSN: 2146-4138
available at http: www.econjournals.com
International Journal of Economics and Financial Issues, 2016, 6(S7) 1-5.
Special Issue for "International Soft Science Conference (ISSC 2016), 11-13 April 2016, Universiti Utara Malaysia, Malaysia”
Estimating the Technical Efficiency of Smallholder Cocoa
Farmers in Malaysia
Wan Roshidah Fadzim
1, Mukhriz Izraf Azman Aziz
2*, Siti Hadijah Che Mat
3, Selamah Maamor
41School of Economics, Finance and Banking, Universiti Utara Malaysia, 06010 Sintok, Kedah, Malaysia, 2School of Economics,
Finance and Banking, Universiti Utara Malaysia, 06010 Sintok, Kedah, Malaysia, 3School of Economics, Finance and Banking,
Universiti Utara Malaysia, 06010 Sintok, Kedah, Malaysia, 4School of Economics, Finance and Banking, Universiti Utara
Malaysia, 06010 Sintok, Kedah, Malaysia. *Email: mukhriz@uum.edu.my
ABSTRACT
In Malaysia, cocoa production is characterized by several problems that lead to low productivity. The low productivity is evident from the continuous drop in cocoa production since 2001 despite efforts from governing bodies to boost output. This study investigates this issue by looking into the production efficiency among smallholder cocoa farmers in Malaysia. The technical efficiencies of cocoa farmers in Malaysia is estimated using data envelopment analysis. The study relies upon primary data gathered during the 2013 production season. Data are collected from a set of structured questionnaire administered on 375 smallholder cocoa farmers throughout Malaysia. Result of the analysis shows that the mean efficiency score is 0.526. In short, there existed inefficiency among the sampled farmers.
Keywords: Cocoa, Technical Efficiency, Data Envelopment Analysis
JEL Classifications: D24, Q12
1. INTRODUCTION
In 1953, the first cocoa project in Malaysia started at Jerangau, covering 403 hectares of land (Malaysian Cocoa Board [MCB]). Cocoa was traded commercially in Malaysia since 1960s and it is currently ranked fourth after palm oil, rubber and forestry products in the Malaysian agricultural sector. In 1990, Malaysia was the fourth largest cocoa producing countries in the world after Ivory Coast, Ghana and Brazil. However, in 2010, Malaysia was ranked 13th in the world. The decline of Malaysia’s position as a major exporter of cocoa in the world was due to the reduction in the local production of cocoa beans. According to MCB, small scale farmers prefer to grow oil palm and rubber trees instead of cocoa. The preference for oil palm and rubber trees is attributed to the simplicity in the plantation process.
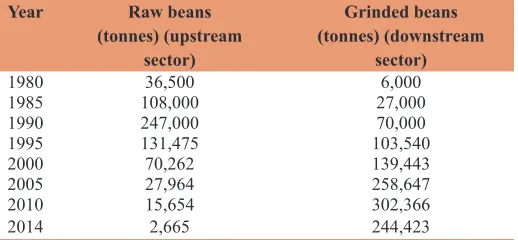
Malaysia’s raw cocoa beans production registered continuous decline since the mid 90’s. Based on Table 1, domestic raw cocoa
beans production achieved its peak in 1990 at 247,000 metric tons. A significant reduction in production occurs since 1995. Output dropped from 131,475 tons in 1995 to 70,262 tons in 2000. In 2014, only 2,665 tons were produced. In the cocoa grinding sector, production has increased from 103,540 tons in 1995 to 139,443 tons in 2000 and 244,423 tons in 2014. The continued growth in the cocoa grinding sector presents opportunities for farmers to increase raw cocoa beans output.
The rest of the paper is organized as follows. Section 2 reviews the existing literatures on cocoa productivity. Section 3 presents the empirical model and data. Section 4 discusses the empirical results and Section 5 concludes.
2. LITERATURE REVIEWS
Most studies on production efficiency of smallholder cocoa farmers are concentrated in major cocoa producing countries such as Nigeria and Ghana (Kolawole and Ojo, 2007; Amos, 2007; Taiwo et al., 2015; Binam et al., 2008; Aneani et al., 2011). In Malaysia, there is lack of research that investigates efficiencies of smallholder cocoa farmers. The only study was done by Othman in 1990 and only covers two states in the Peninsular Malaysia, namely Selangor and Perak.
Studies in Nigeria generally find consistent results on TE among cocoa farmers. Damian et al. (2012) estimated TE involving 200 cocoa farmers from Ikom Agricultural Zone in the state of Nigeria. The effects of some selected socio-economic characteristics of the farmers on the efficiency indices were also estimated. Result of the analysis showed that farmers were experiencing decreasing but positive returns to scale in the use of the farm resources. The result also confirmed that the cocoa farmers in that area were technically inefficient. The study observed that there is enough room to improve efficiency with the farmers’ current resource base and available technology and concluded that policies that would directly affect these identified variables should be pursued. In a study by Ogundari and Aladejimokun (2006) involving 240 cocoa farmers in Ondo, Nigeria, they found that farmers are efficient in allocating their resources. Furthermore, Amos (2007) in his study showed that farmers in Nigeria were experiencing increasing returns to scale in the use of the farm resources. The study nevertheless found that cocoa farmers in that area were technically inefficient. The efficiency level ranged between 0.11 and 0.91 with a mean of 0.72.
Binam et al. (2008) examine the TE and productivity potential of cocoa farmers in West and Central Africa. Separate stochastic frontier models were estimated for farmers in Cameroon, Ghana, Nigeria, and Côte to obtain alternative estimates for the technical efficiencies of farmers in the different countries. The study found that the productivity potential ratio plays an important part in
explaining the ability of cocoa farmers in one country to compete with other farmers from different countries at the regional level. This ratio provides an estimate of the technology gap between the country and the region as a whole.
Richman (2010) investigates the determinants of TE using a balanced longitudinal (panel) data on Ghanaian cocoa farmers for the period 2001-2006. The average efficiency was found to be 44.2%. This study recommends that effort aimed at raising productivity and efficiency must concentrate on reducing if not eliminating farm level problems and intensification of fertilizer usage. It is further recommended that farmers be given some education on maintenance practices. In Indonesia, Hanani et al. (2013) investigated the production efficiency of 98 cocoa farmers at Sigi, Indonesia. The study found that the average level of production efficiency among cocoa farmers in Indonesia is 0.8096. The results showed the level of technology adoption on cocoa farming was still low.
3. DATA AND METHOD
This study uses cross-section data for the production year 2013. The data for this study is collected through a cross sectional survey of cocoa farmers in the West and East Malaysia involving 375 smallholder cocoa farmers using simple cluster random sampling. Information are gathered using face-to-face interview via structured questionnaire designed for collecting information on output, inputs, prices of variables, and some important socio-economic variables about the farmers.
3.1. Analytical Techniques
In order to estimate the production efficiency for smallholder cocoa farmers in Malaysia, the study uses Data Envelopment Analysis method (DEA). DEA method is a non-parametric approach which was introduced by Charnes, Cooper and Rhodes (1978) (CCR) based on the model of production efficiency that spearheaded by Farrell (1957). DEA construct a piecewise linear production surface using linear programs and computes an efficiency score for each decision making unit (DMU) along the lines suggested by Farrell (1957). DEA is very versatile and can accommodate multiple inputs and multiple outputs. DEA also does not require any parametric specification and thus is not susceptible to specification error. In contrast, the DEA approach is sensitive to outliers that might exaggerate the actual frontier because it takes no account of the possible influence of measurement error and other noise in the data.
3.2. Basic DEA Models
In DEA, efficiency is measured by the ratio of output with input. The Charnes-Cooper-Rhodes (CCR) model is formulated in the following form:
Maximize u y v x
j s
i iq
j m
j jq
= =
=
∑
∑
1
1
�
�
�
�
(1) Subject to,
Table 1: Malaysia cocoa beans production
Year Raw beans (tonnes) (upstream
sector)
Grinded beans
(tonnes) (downstream
sector)
1980 36,500 6,000
1985 108,000 27,000
1990 247,000 70,000
1995 131,475 103,540
2000 70,262 139,443
2005 27,964 258,647
2010 15,654 302,366
2014 2,665 244,423
j s
i iq
j m
j jq
u
v k n
y x =
=
∑
∑
≤ = ……1
1
1 1 2 3, , , .,
(2)
ui=1, 2, 3,…, n vj=1, 2, 3,…,n
Where,
vjis the weights to be determined for input j;
m is the number of inputs;
ui is the weights to be determined for output i;
s is the number of outputs and
n is the number of entities.
In Equation (1), x and y are for inputs and outputs respectively. μ is
denoted for output weights and v for input weights and μ and v will be calculated for efficiency maximization subject to constraints in Equation (2). If maximize score = 1, it means that DMUk is
efficient and efficiency is achieved. On the contrary, if maximize score is <1, DMUk is considered inefficient and efficiency is not
achieved. DMUk is relatively inefficient if it is possible to expand
its outputs without increasing any of its inputs.
The CCR model assumes each DMU operates at constant return to scale (CRS). According to Coelli et al. (2005), the CRS assumption is only applicable when all DMUs are operating optimally. However, this condition is difficult to attain especially in the cocoa plantation industry. This is because cocoa farmers are faced with various constraints such as imperfect market competition, financial limitations, constant policy changes and other related problems that hinder optimal output production (Krasachat, 2001). Correspondingly, Banker, Charnes and Cooper (1984) (BCC) augmented the CCR model which overcomes the CRS assumption of the CCR model. The most important extension of the original CCR model by BCC is the additional constraint introduced as:
λj j s
= =
∑
1 1(3) Specifically, the BCC model explains TE from variable return to scale (VRS) perspective. This model assumes input and output changes disproportionately. The BCC model yields the scale efficiency (SE) score index. SE is defined as the ratio between the scores of CCR and BCC index. In other words, the SE is the ratio of TE to pure technical efficiency (PTE). If SE score equals to 1, it shows that the DMUs are operating at scale efficient level of output. If the SE score is <1, the DMUs are considered scale inefficient. The SE is derived as follows:
SE TE
PTE
j CCR
BCC
=
(4) Where,
SE is the scale efficiency of j;
TE is the technical efficiency CCR model; PTE is the pure technical efficiency BCC model.
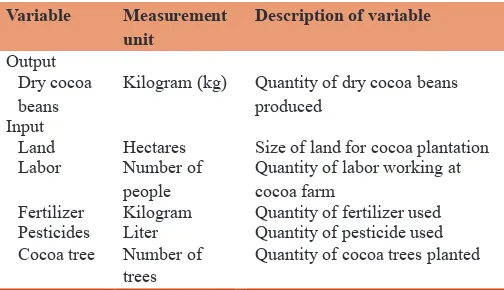
Accordingly, this paper employs both CCR and BCC models in the DEA analysis. The CCR model maximizes output under CRS assumption while BCC model assumes VRS. Table 2 provides list of inputs and output employ in the DEA analysis.
4. RESULTS AND DISCUSSION
This section discusses the findings of TE derived from Equation (1). Estimation for DEA is carried out using DEAP program version 2.1. The study applies the maximizing output method under the CRS and VRS assumptions.
Table 3 shows the summary statistics for 375 respondents who participated in this study. Results show that the average cocoa beans produced by respondents in 2013 are around 1049 kg. From the input side, the average size of cocoa farms is 1.32 hectares whereby the landowners themselves do most of the plantations. Additionally, most of the respondents use around 720 kg of fertilizers and 14.4 L of pesticides respectively.
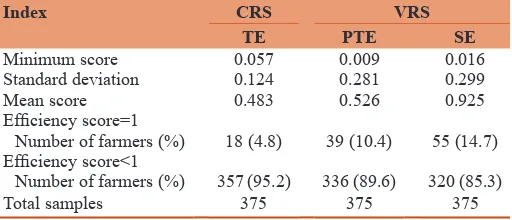
Table 4 provides results from DEA analysis. It shows efficiency index for smallholder cocoa farmers in Malaysia for the production year 2013. More than 85% of cocoa smallholders in Malaysia have efficiency score <1 for both TE measures under CRS and VRS. It reveals that majority of cocoa farmers do not produce at the optimum level of output under the existing technology and inputs combination. The number of efficient farmers measured under CRS is lower than that of VRS. In total there are 18 efficient
Table 2: Summary definitions of inputs and output in the DEA analysis
Variable Measurement
unit Description of variable
Output Dry cocoa
beans Kilogram (kg) Quantity of dry cocoa beans produced Input
Land Hectares Size of land for cocoa plantation
Labor Number of
people Quantity of labor working at cocoa farm
Fertilizer Kilogram Quantity of fertilizer used Pesticides Liter Quantity of pesticide used Cocoa tree Number of
trees Quantity of cocoa trees planted
DEA: Data envelopment analysis
Table 3: Summary statistics of input and output in cocoa production
Variable Mean±SD Minimum Maximum
Output
Dry cocoa beans (kg) 1049±1296 20 12000
Input
Land (hectare) 1.32±1.157 0.1 10
Labor (N) 1.78±1.016 1 8
Fertilizer (kg) 720±738 50 7500
Pesticides (L) 14.4±24.7 1 348
Tree (N) 1193±1149 30 10000
farmers measured under CRS compared to 39 and 55 farmers respectively under VRS. Differences exist because the TE index of cocoa farmers estimated under CRS is based upon the assumption that farmers will maximize output from the currently available resources.
However, this assumption is not relevant for cocoa farmers who do not produce at optimum level due to inefficient use of resources. This justifies the higher percentage of inefficient farmers estimated under CRS than VRS. For efficiency measured under VRS, the index can be observed from two aspects; PTE and SE. The average efficiency score under VRS’ PTE and SE estimates are 0.526 and 0.925 respectively. These results represent around 86% of cocoa farmers who recorded efficiency score <1. This finding is consistent with Kachroo et al. (2013) study on corn growers in India. They found that 85% of all corn growers are inefficient due to poor management of input resources.
4.1. SE Scores of Cocoa Farmers
The SE scores may be decomposed into three types of returns; increasing return to scale (IRS), decreasing return to scale (DRS) and CRS. For IRS, the percentage change of cocoa beans (output) is greater than the percentage change in the input. In DRS, the percentage change in output is smaller than the percentage change in input. Finally, CRS shows the percentage change in cocoa input is equal to the percentage change in output.
Table 5 shows the analysis of SE for all 375 cocoa farmers in the study. Results show that 60 farmers are operating at CRS, 279 at IRS and the remaining 36 are producing at DRS. As for average farm size and output level, farmers that experienced IRS produced on average 705 kg of output with 0.97 hectare of land. In contrast, farmers that produced under DRS recorded around 2745 kg of dry cocoa beans in 2013 with an average of 3.14 hectare of land.
In short, the study shows that most cocoa farmers could maximize output by making small adjustments or changes to the input use (as observed by large number of farmers operating under IRS). Since input use and output produced are positively correlated, cocoa farmers in Malaysia may increase output by greater proportion by making small changes (or increase) in the input.
5. CONCLUSION
TE is an important determinant of competitiveness especially for smallholder cocoa farmers in Malaysia. The results of this study show that most of the cocoa farmers in Malaysia are technically inefficient due to poor management and usage of inputs. Based on the findings, the MCB should engage the farmers with activities and programs that could help improve their TE. The low efficiency scores obtained from the DEA analysis show that smallholder cocoa farmers need to be efficient if they wish to remain competitive in the industry. Achieving this objective however requires strong commitments from cocoa farmers and all agencies involved. Relevant agencies should pursue policies that would directly affect the efficiency of the cocoa farmers vigorously.
REFERENCES
Amos, T.T. (2007), An analysis of productivity and technical efficiency of smallholder cocoa farmers in Nigeria. Journal of Social Sciences 15(2), 127-133.
Aneani, F., Anchirinah, V.M., Asamoah, M., Owusu-Ansah, F. (2011), Analysis of economic efficiency in cocoa production in Ghana. African Journal of Food, Agriculture, Nutrition and Development, 11(1), 4507-4526.
Banker, R.D., Charnes, A., Cooper, W.W. (1984), Some models for estimating technical and scale inefficiencies in data envelopment analysis. Management Science, 30(9), 1078-1092.
Binam, J.N., Gockowski, J., Nkamleu, G.B. (2008), Technical efficiency and productivity potential of cocoa farmers in West African countries. The Developing Economies, 46(3), 242-263.
Charnes, A., Cooper, W.W., Rhodes, E. (1978), Measuring the efficiency of decision making units. European Journal of Operational Research, 2(6), 429-444.
Coelli, T.J., Rao, D.S.P., O’Donnell, C.J., Battese, G.E. (2005), An Introduction to Efficiency and Productivity Analysis. Berlin: Springer Science & Business Media.
Damian, I.A., Ben, O.S., Okoi, I.K., Inyang, N.N. (2012), Analysis of technical efficiency of smallholder cocoa farmers in cross river state, Nigeria. International Journal of Agricultural Management and Development, 2(3), 177-185.
Farrell, M.J. (1957), The measurement of productive efficiency. Journal of the Royal Statistical Society. Series A (General), 120(3), 253-290. Hanani, N., Setiawan, B., Muhaimin, A.W. (2013), Effect characteristics
of farmers on the level of technology adoption side-grafting in cocoa farming at Sigi Regency-Indonesia. Journal of Agricultural Science, 5(12), 72.
Kachroo, J., Sharma, A., Bhat, A. (2013), Study on growth and instability of Maize in Jammu and Kashmir. Economic Affairs, 58(1), 21-28. Kolawole, O., Ojo, S.O. (2007), Economic efficiency of small scale food
crop production in Nigeria: A stochastic frontier approach. Journal of Social Sciences, 14(2),123-130.
Krasachat, W. (2001), Cost efficiency in Thai agricultural production.
Table 5: Scale efficiency of cocoa farmers
Scale efficiency Number of
farmers Average farm size (hectare) output (kg)Average
IRS 279 0.97 704.47
CRS 60 1.87 1575.37
DRS 36 3.14 2745.83
Number of
farmers 375
CRS: Constant return to scale, IRS: Increasing return to scale, DRS: Decreasing return to scale
Table 4: Mean technical efficiency score of smallholder cocoa farmers
Index CRS VRS TE PTE SE
Minimum score 0.057 0.009 0.016
Standard deviation 0.124 0.281 0.299
Mean score 0.483 0.526 0.925
Efficiency score=1
Number of farmers (%) 18 (4.8) 39 (10.4) 55 (14.7) Efficiency score<1
Number of farmers (%) 357 (95.2) 336 (89.6) 320 (85.3)
Total samples 375 375 375
Journal of Agricultural Economics, 20(2), 73-82.
Malaysian Cocoa Board. (2004), Available from: http://www.koko.gov. my/lkmbm/industry/statistic/cocoacultivated.cfm.
Ogundari, K., Aladejimokun, O.A. (2006), Resource-use and technical efficiency of small-holder cocoa farmers in ondo state: A stochastic frontier analysis. Journal of Applied Tropical Agriculture, 11(1), 26-31.
Othman, N.B. (1990), Factors Affecting Cocoa Productivity among the
Smallholders in West Malaysia. Malawi: University of Stirling. Richman, D. (2010), What Drives Efficiency on the Ghanaian Cocoa
Farm?. In CSAE Conference.