JIEM, 2014 – 7(1): 137-152 – Online ISSN: 2013-0953 – Print ISSN: 2013-8423 http://dx.doi.org/10.3926/jiem.838
Research on the Time Optimization Model Algorithm of
Customer Collaborative Product Innovation
Guodong Yu
1, Yang Yu
1, Qingsong Xing
2, Fei Li
11
State Key Laboratory of Mechanical Transmissions
(China)
2Chongqing Jiao Tong University (China)
[email protected], [email protected], [email protected], [email protected]
Received: April 2013 Accepted: October 2013
Abstract:
Purpose: To improve the efficiency of information sharing among the innovation agents of
customer collaborative product innovation and shorten the product design cycle, an improved
genetic annealing algorithm of the time optimization was presented.
Design/methodology/approach: On the basis of the analysis of the objective relationship
between the design tasks, the paper takes job shop problems for machining model and proposes
the improved genetic algorithm to solve the problems, which is based on the niche technology
and thus a better product collaborative innovation design time schedule is got to improve the
efficiency. Finally, through the collaborative innovation design of a certain type of mobile
phone, the proposed model and method were verified to be correct and effective.
elite reserved strategy was imported that optimal solution missing was avoided effectively and
evolution speed was accelerated; Finally, the new algorithm is tested by three typical functions
and the job shop scheduling problems. Respectively, the simulation results show that the
proposed algorithm can avoid the stagnation, which improves the global convergence ability
and attains better optimization performance.
Originality/value: Firstly, the improved genetic simulated annealing algorithm overcomes some
defects such as effective gene easily lost in early search. It is helpful to shorten the calculation
process and improve the accuracy of the convergence value. Moreover, it speeds up the
evolution and ensures the reliability of the optimal solution. Meanwhile, it has obvious
advantages in efficiency of information sharing among the innovation agents of customer
collaborative product innovation. So, the product design cycle could be shortened.
Keywords: genetic simulated annealing algorithm, niche, customer collaborative product innovation
scheduling, simulation
1. Introduction
The prosperity of the market and the rapid development of technology lead to the increasing complexity of the products. Each agent of product innovation design needs to deal with an increasing amount of information, and the division of labor is becoming more and more refined, which makes it hard for a single enterprise to complete the product development and manufacturing independently (Andresen, Brasel & Morig, 2008). Conversely, the strength of the customers, suppliers and scientific research institutes and other units need to be fully utilized for the collaborative innovation. Thus, product collaborative innovation design research around the cross-organizational and cross-unit has become an important direction in the field of product development (Hou, Han & Lin, 2006).
priority. Hou, Chen and Wen (2007) took the decomposition and distribution of product design task as the breakthrough point, and through considering the interaction and influence between different tasks, studied the decomposition of inter-organizational collaborative product design task and selection and matching of coordinal suppliers which was based on the fuzzy matching method. Ming and Yan (2008) made a systematic and qualitative description for the process framework of the collaborative design and manufacturing which was based on product life cycle theory and the consideration of the technical features of the product design, while lacking of the quantitative analysis of product design time and design efficiency. Sheng, Lin and Ding (2006) used the theory and method of attributes importance in the rough set to determine the similarity of design tasks and knowledge source case, and calculated the weight of the task, so as to define task priorities, eliminate confliction of product collaborative design task and improve the efficiency of collaborative design. Considering to problems exist for collaborative design task scheduling, in the establishment of designing task network chart, Pang, Fang and Guo (2008) took comprehensive consideration of the specific autoimmune factors and constraints of collaborative projects and tasks. Based on Equilibrium - moderation principle, a task assignment from tasks to team members extended mathematical model was established, and Hungary algorithm was used for solving. Zhang, Liu and Zhang (2009) depended on the structure matrix to construct the overall time model of collaborative product development, designed the particle swarm optimization algorithm for task optimization distribution, and achieved optimal allocation of development subtasks among organizations, so as to guarantee manufacturers to finish product development projects in the scheduled time and response to the rapid changes in the market. As, for the multitasking complex cross-coordination difficult problems in distributed collaborative design environment, Liang, Ge and Yang (2011) had a logic decomposition for collaborative design business rules and task - resource dependence relationship, which was based on the coordination theory (CT) depending on the analysis method and project management of work breakdown structure (WBS) method. And single main task coordination model proposed in complex collaborative design environment was put forward. At the same time, considering the coupling relationship between the coordination tasks, the grey relational analysis (GRA) was adopted for the assignment of collaborative design task weight, and the weighted design task was sorted so as to optimize the overall time of product collaborative innovation design.
design time consuming. Meanwhile, algorithms the research institutes above selected are mainly non-intelligent. When the quantity of tasks and agents participating in collaborative innovation design increasing, the problem solving time would increase or even be difficult to obtain effective solution. For this reason, the paper based on of the analysis of the objective relationship between the design tasks, takes the kinds of job shop problems for machining model and proposing the improved genetic algorithm to solve the problems, which is based on the niche technology and thus a better time schedule of collaborative product innovation design is got to improve the efficiency. Finally, through the collaborative innovation design of a certain type of mobile phone, the proposed model and method were verified to be correct and effective.
2. Modeling of time optimization for collaborative innovation design of products
For product collaborative innovation designing organizations, there are m design agents, a certain object to be designed and n tasks need to be done. The goal of product collaborative innovation designing is to determine the start time and end time of each task by distributing the n tasks to the m design subjects according to the design sequence optimization, and ultimately to guarantee the minimum of time to finish the design of the scheduled target.
2.1. Related definitions and constraints
Definition 1, design task set: the collection of all pending design tasks, which is represented by
Ta = { Tai | 1 ≤ i ≤n} and n indicates the number of tasks.
Definition 2, design the subject - task relationship
X
ijk=
{
1
0
Series j of Task i operated by subject k
others
Ri1j1i2j2k=
{
1 Series j1of Task i1and Series j2operated by subject k , Serier j2completed before Series j1
0 others
Besides, TFi is the task completion time, and Pijk is the operating time for the subject k of
designing to complete the design sequence j of the task Tai. TSijk represents the operation
starting time for the subject k of designing to complete the j design sequence of the task Tai.
TFijk is the operating completion time for the subject k of designing to complete the j design
sequence of the task Tai. However, in the actual process of products collaborative innovation
(1) The constraint of designing task sequence: the operation of the later design sequence of a task must be done after the consummation of the former design sequence.
TF
ijk−
TF
i(j−1)l−
P
ijk≥
0
(
1
<
j
≤
N
i, X
ijk=
X
i(j−1)l=
1
)
(1)(2) The constraint of design subject: the design subject k can only start another task after one design task operation is completed by design subject k,
TF
i2j2k−
TF
i1j2k−
P
i2j2k≥
0
, X
i1j2k=
X
i2j2k=
1
, R
i1j1i2j2k=
1
(2)(3) The completion time constraint of the task:
TF
ijk=
max
{
TF
i(j−1)l, ST
ijk}+
P
ijki
=
1,...
, n ;
j
=
2,...
, n
i; k ,l
=
1,2
,
...
, m
(3)At the same time, the finish timeTFi k1 of the first design sequence in the taskTaineeds to meet
the constraint:
TF
i1k=
ST
i1k+
P
i1k (4)2.2. The model of time optimization
On the basis of the above definitions and constraints, m design subjects (M1, M2,...,Mm) and n
design tasks (Ta1, Ta2,...,Tan) form a product collaborative innovation design organization. Under
the circumstances of knowing the design task processing time and the constraint of operation sequence for the design subject to complete the design task, the goal to minimize the maximum completion time of the design task is defined. And the mathematical model aiming at shortening the product collaborative innovation design cycle and improving the efficiency of collaborative design should be constructed.
G
=
min
[
max
(
∑
i=1 n
TF
i)]
(5)3. Implementation procedure of model algorithm
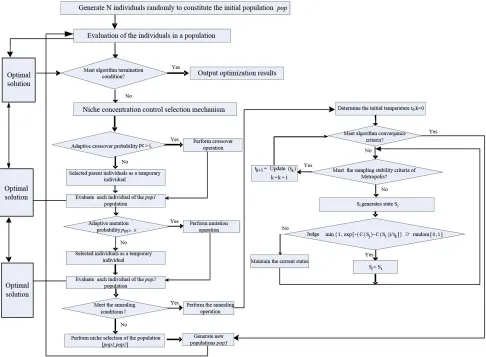
3.1. Process of improvement genetic annealing algorithm based on niche technology
the specific problems, so a variety of methods are needed to be merged to make up for lack of their fusion, and finally realizing the correct and effective solution of the problem. Genetic annealing algorithm based on niche technology should firstly define the individual sharing function according to the hamming distance between the individuals, and the fitness of each individual of the population should be adjusted through the sharing function, and adjusted fitness will be treated as the basis of genetic operators, so as to maintain the diversity of the population and improve the probability of the optimal solution (Chunqiang, Ling & Jun,2007). Through the ecological niche concentration control mechanism realize the excellent individual choice of the initial population, and use the advantage of genetic algorithm on the global search generating a group of excellent. Thus, the gene individuals will be adjusted combined with the characteristics of the local search of the simulated annealing, which will be operated
iteratively until the termination conditions is satisfied. At the same time, because the method used a positive feedback mechanism of group optimization formatted by the cognitive memory function of each chromosome itself and the cooperative behavior of group to complete the global optimization process, it is similar to the thought of multi-agent cooperation and coordination in collaborative innovation, which is more suitable for solving the product collaborative innovation design coordination and optimization problems with multiple subjects to participate in. Specific steps of this algorithm and are as follows:
Step1. Set evolution algebra counter t=1,randomly generate initial population Pop0(t) with m
individuals; then calculate the fitness fi(i = 1,2,...,m) of each individual, and range them in
descending orders according to the size, and store the highest fitness of the individual and target value in the optimal solution concentration;
Step2. Determine whether it meets the convergence conditions, if it meets then terminate the operations and output the calculation results; If it doesn't meet then turn to Step 3;
Step3. Niche concentration control the selection operator, with m individuals obtained in the step 1,work out the Hamming distance between the every two individuals and the fitness according to the following formula, namely,
d
=
√
∑
a=1 m
∑
b=1 m
∑
k=1 n
(
ObjV
(
a , k
) −
ObjV
(
b , k
))
2 (6)While a ≠ b, ObjVObjVwas the individual target value, and k presented the decision variables of the problems to be solved. When d < L (L is the distance parameters between the pre-specified niche, comparing the size of the fitness of the individuals, and imposed a penalty function
fmin(xi,xj) = penalty to the lower one, so as to dramatically reduce its fitness, namely their
Step4. Conduct bets preliminary selection operation to populations Pop0(t) and elite selection; then, adaptive crossover operator was used on the populations Pop0(t) for crossover operation, so as to get the population Pop1(t). At the same time, the optimal solution was stored into the
knowledge base. During the search process, firstly the knowledge base was inquired to avoid the loss of the optimal solution and improve the ability of evolution. Finally, adaptive uniformity mutation operator was used to conduct the mutation operation for population Pop1(t), and
population Pop2(t) was got.
Step5. Define G1 and G2 as the gold point of division and annealing temperature controlling
value Θ, G1 = G2 – round(0.618*G2), G2 = MaxGen – round(0.618*MaxGen), among them MaxGenis the largest cyclic algebra. Determine whether executive annealing operation is needed according to the cyclic algebra j. If it meets the annealing conditions (L = 1) then step (6) would be executed, otherwise (L = 0), turn to step (7), steps are as follows:
Step6. Define Pop2(t) as the initial population, then annealing operation was simulated to each
individual in it, namely, when the temperature was T, new state j was generated from the current state i, and the energy of each are Ei and Ej. If Ej < Ei, then the new state j is accepted
as the current state. Otherwise, if the probability pr = exp[-(Ej – Ei)/kT] is greater than any
random number in the interval [0, 1], then the new state j is still accepted as the current state, if not, then state i is restrained as the current state. Among them is the Boltzmann constant, T is the absolute temperature. A new population Pop3(t) with a scale of m, and the
individuals were ranged in descending order according to the size of fitness.
Step7. Merge Pop1(t) and Pop2(t) to form a new group, and range the fitness of it. At the same
time, updating the individuals of Pop3(t), then turn to step 1.The specific processes is shown in
Figure 1. Flow chart of improved genetic annealing algorithm
3.2. The realization of model algorithm
(1) Algorithm coding. In the process of initialization, the method based on the design of the task sequence was used for coding. For example, the problem 5*5 in Table 1, if the given chromosome are[23514 13254 31524 43251 25413]. Among them, 1 represents task Ta1, 2
represents task Ta2, 3 represents task Ta3, 4 represents task Ta4, 5 represents task Ta5. Because
Design task Design sequence
Ta1 M3 M1 M5 M4 M2
Ta2 M1 M5 M2 M4 M3
Ta3 M4 M2 M3 M1 M5
Ta4 M2 M5 M3 M1 M4
Ta5 M5 M2 M4 M3 M1
Table 1. Collaborative innovation problems of five design subjects and design tasks
Chromosome 2 3 5 1 4 … 2 5 4 1 3
Design task Ta2 Ta3 Ta5 Ta1 Ta4 Ta2 Ta5 Ta4 Ta1 Ta3
Design subject M1 M4 M5 M3 M2 M3 M1 M4 M2 M5
Table 2. Corresponding relationship of chromosome, design task and design subject
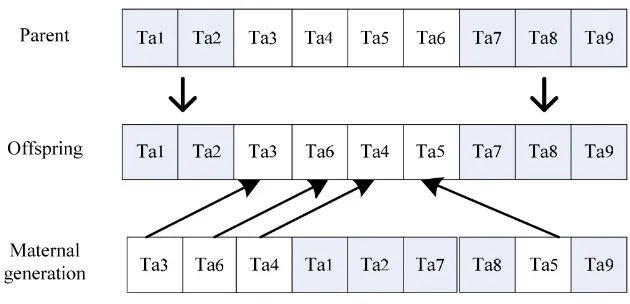
(2) Adaptive double point crossover operation. To make full use of historical information, this paper adopts double point crossover to increase the population diversity and to prevent the operation of algorithm premature and stagnation. As shown in Figure 2.
Figure 2. Double point crossover
In the evolutionary process, when the population individual fitness of the current generation is below the average fitness value, the crossover rate should be improved to achieve faster search speed. Conversely, the crossover rate need to be reduced and can be automatically adjusted with the fitness value. For this reason, this paper puts forward dynamic adjustment strategy of crossover probability. The adaptive adjustment formula is:
P
C=
{
P
C1−
(
P
C1−
P
C2)(
f
−
f
avg)
f
max−
f
avgf
≥
f
avgP
C1f
<
f
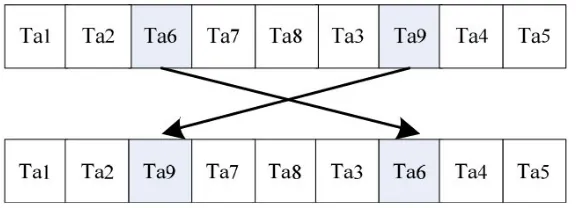
avg(3) The adaptive random mutation operation. In order to increase the diversity of population, maintain the diversity of population, and improve the local search ability, the paper adopts the random interchangeable variability that is to select bit of the two genes in the chromosome randomly, so as to achieve the purpose of preventing premature. As shown in Figure 3.
Figure 3. Random interchangeable variation
Meanwhile, adaptive mutation probability is used to improve the convergence speed, and the adaptive adjustment formula is:
P
M=
{
P
M1−
(
P
M1−
P
M2)(
f
max−
f
*
)
f
max−
f
avgf
*≥
f
avgP
M1f
*<
f
avg(8)
(4) Introduce the niche elitist retention strategy based on the sharing mechanism. The pseudo code is as follows:
Identify distance=zeros(popsize,popsize); DIstance=zeros(popsize,popsize);
share=zeros(popsize,popsize); SHare=zeros(1,popsize);
Do Two individual hamming spacing
distance(i,j)=distance(i,j)+(Chrom(i,k)-Chrom(j,k))^2; DIstance=sqrt(distance);
Do Two individual fitness distance
adapt-abs(i,j)=abs(Chrom(i,length+1)-Chrom(j,length+1));
Do Hamming spacing and fitness mean
Do The adjustment of sharing function adjustment
if DIstance(i,j)<average1&adapt-abs(i,j)>=average2
share(i,j)=1-DIstance(i,j)/average1;
elseif DIstance(i,j)>=average1&adapt-abs(i,j)<average2
share(i,j)=1-adapt-abs(i,j)/average2;
elseif D(i,j)<e1&adapt-abs(i,j)<average2
share(i,j)=1-DIstance(i,j)*adapt-abs(i,j)/average1*average2;
else share(i,j)=0;
Do The adjustment of individual fitness value
SHare(1,i)=SHare(1,i)
+share(i,j);fitnew1(1,i)=Chrom(i,n+1)/SHare(1,i);fitnew=abs(fitnew1);
Pop ← initialize
Min-fitness, adapt(popsize)← Adapt(pop)
Best-fitness,best-individual← keepbest (min-fitness, adapt(i),pop)
For k=1: maxgen
pop← Select(pop, adapt)
pop1← Cross(pop, adapt, min-fitness)
min-fitness, adapt(popsize) ← Adapt(pop1)
Update(Best-fitness, best-individual) ← keepbest(Best-fitness, min-fitness, adapt(popsize).best-individual,pop1)
Pop2←mutation(pop1,adapt,min-fitness)
min-fitness, adapt(popsize) ← Adapt(pop2)
Update(Best-fitness, best-individual) ← keepbest(Best-fitness, min-fitness, adapt(popsize).best-individual,pop2)
If need simulated annealing operation
Else
pop3 ← niching choice (pop1,pop2)
min-fitness, adapt(popsize) ← Adapt(pop3)
Update(Best-fitness, best-individual) ← keepbest(Best-fitness, min-fitness, adapt(popsize).best-individual,pop3)
4. Case Study
4.1. The Application case analysis
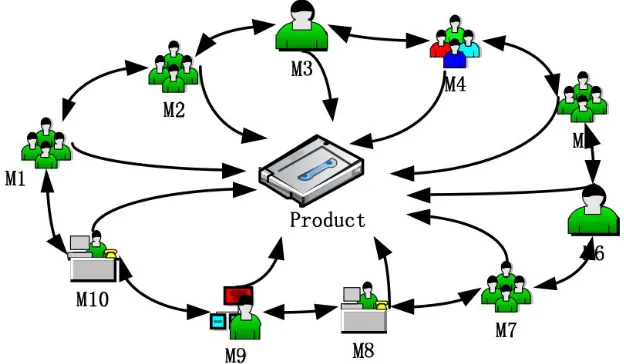
The F Company mainly engages in the research and development of mobile phone. The company is developing a new product Duff, and the innovative design of the product D is directed by a collaborative innovation design alliance composed of 10 design agents (M1, M2, …,
M10) (Figure 4).
Figure 4. 10 design agents of the Duff development
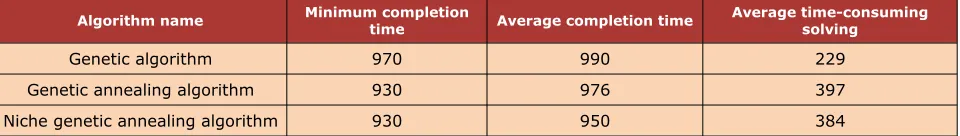
Algorithm name Minimum completiontime Average completion time Average time-consumingsolving
Genetic algorithm 970 990 229 Genetic annealing algorithm 930 976 397 Niche genetic annealing algorithm 930 950 384
Table 3. Product collaborative innovation design time-consuming in the different algorithms
4.2. Algorithm performance analysis
In order to validate the solving efficiency, effectiveness and reliability of the above niche
genetic annealing algorithm, three typical nonlinear functions ( f1=
∑
i=1
n
xi
2
x∈[−1000,1000];
f2=
∑
i=1
n−1
[100(xi+1−xi)2+(xi−1)2] xi∈[−30, 30];
f3=4x12
−21x14
+x16
/3+x1x2−4x22
+4x24, x
1,x2∈[−5,5]) are adopted as examples to verify the
algorithm performance, and each of them run 20 times independently. The results compared with other algorithms are shown in Table 4. In the experiments:
(1) Genetic algorithm crossover and mutation probability are set as 0.85 and 0.1 respectively.
(2) The optimization parameters accuracy of the niche genetic annealing algorithm is set as 10e-4, the adaptive crossover probability varying from 0.6 to 0.99, the adaptive mutation
probability varying from 0.01 to 0.1, the upper bound of distance threshold is 3, initial temperature is 100, temperature reduction parameter is 0.98, and annealing temperature controlling value is 0.15.
(3) The population size of the annealing genetic algorithm is set as 100, evolution algebra as 800, crossover and mutation probability as 0.7 and 0.1 respectively, initial temperature as 100, temperature reduction parameter as 0.98.
(4) The improved cooperative particle swarm divided into five subgroups, the population scale is 100, evolution algebra is 800, inertia weight is 0.4, learning factor c1 = c2 is 1.49, disturbance factor is 150.
(5) The variable precision of the hybrid quantum genetic algorithm is 10e-6, crossover and
Method Test function solutionOptimal solutionWorst Average Time Standarddeviation
Genetic Algorithm
f1(100,1000)
4.768×10⁻⁶ 4.768×10⁻⁶ 4.768×10⁻⁶ 14.64 0
Niche Genetic Annealing Algorithm 7.153×10⁻¹¹ 7.153×10
-11 7.153×10⁻¹¹ 4.01 0
Genetic Annealing Algorithm
f2(100,800)
0.0016 0.464 0.1899 6.25 0.1346 Niche Genetic Algorithm 6.11×10⁻⁵ 0.008 0.0016 150.5 0.0024
Improved Cooperative Particle Swarm
Optimization Algorithm 0.0304 - 14.3211 28.96 -Niche Genetic Annealing Algorithm 0.0004 0.0844 0.0189 4.48 0.0257 Quantum Genetic Algorithm
f3(100,30)
-1.031 - -0.9817 6.578 0.0615 Niche Genetic Annealing Algorithm -1.031 -0.9822 -1.0165 0.986 0.0189
Table 4. Performance comparison of each method
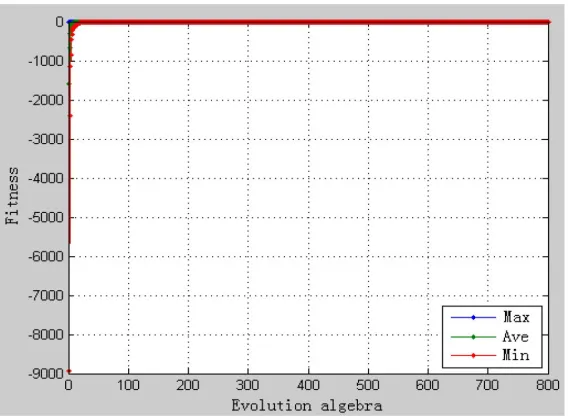
Figure 5. Genetic annealing algorithm of f2
The analyses from Table 4, Figure 5 and Figure 6 show that:
(1) In optimizing function f1, under the same population scale and evolution algebra, the niche
genetic algorithm in the convergence speed is faster than genetic algorithm, and it achieves a more optimal solution, with the search process showing robustness;
(2) In optimizing function f2, the niche genetic algorithm having the fastest convergence
speed, which could search for better solutions and t get the minimum mean and deviation, but its optimization time was about 34 times, which substantially increased the consumption of operational resources. The contrast analysis in Fig5 and Fig6 shows that the niche genetic annealing algorithm has a higher stability computing process and lower volatility to mean;
(3) In optimizing function f3, compared with the hybrid quantum genetic algorithm, the niche
genetic annealing algorithm shows faster convergence speed and more strong searching capability.
The numerical experiment proves that NGSA hybrid algorithm has obvious advantages in terms of searching capability and optimization efficiency.
5. Conclusions
In order to improve the efficiency of processing large amounts of complex information in customer collaborative product innovation, the paper presents a time optimization based on improved genetic annealing algorithm. The main contributions are as follows.
(1) The defects that traditional genetic annealing algorithm is easy lost of the effective gene in early search was analyzed, and niche genetic annealing algorithm was proposed.
(2) Adaptive two-point crossover and swap mutation strategy were introduced during solving process in order to shorten the calculation process and improve the accuracy of the convergence value.
(3) The elite strategy was introduced to speed up the evolution and ensure the reliability of the optimal solution.
References
Cai-Mao, S.U., & Ke, Y.L. (2006). Task planning and decoupling strategy for collaborative design. Computer Integrated Manufacturing Systems, 12(1), 22-26.
Chunqiang, J., Ling, Y., & Jun, S. (2007). Optimal design of hydraulic manifold blocks based on niching genetic simulated annealing algorithm. High Technology Letters (English Language Edition), 13(4), 363-368.
Hou, L., Chen, F., & Wen, Z.J. (2007). Design task decomposition and allocation for inter-firm product collaborative development. Journal of Zhejiang University (Engineering Science), 41(12), 1976-1981.
Hou, L., Han, D.H., & Lin, Z.S. (2006). Research on the Architecture of Product Collaborative Development Chains. Science & Technology Progress and Policy, 23(4), 133-135.
Joglekar, N.R., & Ford, D.N. (2005). Product development resource allocation with foresight.
European Journal of Operational Research, 160 (1), 72-87.
http://dx.doi.org/10.1016/j.ejor.2003.06.021
Liang, X., Ge, P., & Yang, Y. (2011). Task Sequencing for Single Product Collaborative Designer Based on Dependency Logic. China Mechanical Engineering, 22(2), 227-231.
Ming, X.G., & Yan, J.Q. (2008). Collaborative process planning and manufacturing in product lifecycle management. Computers in Industry, 59, 154-166.
http://dx.doi.org/10.1016/j.compind.2007.06.012
Pang, H., Fang, Z.D., & Guo, H. (2008). Research on task scheduling method of cooperative design. Systems Engineering and Electronics, 30(10), 1899-1903.
Sheng, B.Y., Lin, Z.J., & Ding, Y.F. (2006). Rough set-based conflict resolution case reasoning in collaborative design. Computer Integrated Manufacturing Systems, 12(12), 1952-1956.
Song, L.J., Yang, Y., & Yang, J. (2008). Study on Task Scheduling in Collaborative Product Development. China Mechanical Engineering, 19(7), 798-803.
Zhang, W.J., Liu, W., & Zhang, Z.J. (2009). Task assignment for suppliers’ participation in collaborative product development. Computer Integrated Manufacturing Systems, 15(6), 1231-1236.
Journal of Industrial Engineering and Management, 2014 (www.jiem.org)
Article's contents are provided on a Attribution-Non Commercial 3.0 Creative commons license. Readers are allowed to copy, distribute and communicate article's contents, provided the author's and Journal of Industrial Engineering and Management's names are included.