ISSN 2324-805X E-ISSN 2324-8068 Published by Redfame Publishing URL: http://jets.redfame.com
Validity and Reliability Study of the Scale for Determining the
Civic-mindedness Levels of Teaching Staff
1Rüştü Yeşil
Correspondence: Rüştü Yeşil, Faculty of Education, Ahi Evran University, Turkey.
Received: December 29, 2016 Accepted: February 9, 2017 Online Published: March 1, 2017
doi:10.11114/jets.v5i4.2116 URL: https://doi.org/10.11114/jets.v5i4.2116
Abstract
The purpose of this study was to develop a valid and reliable scale that can be used in determining the civic-mindedness levels of teaching staff working at universities. The study group of the research consisted of 758 students, 256 of whom were male and 524 were female. The item list, which was based on the literature and expert opinions, was prepared for use after also being checked by linguists. The validity analysis of the scale for the data collected was performed with exploratory factor analysis and item-total correlation tests, while the property of reliability was determined using the Cronbach’s alpha internal consistency coefficient and the stability test was carried out by determining the relationship between two applications conducted at an interval of the five weeks. The scale, which is called the “Scale for Determining the Civic-Mindedness Levels of Individuals” is a five-step Likert-type scale and consists of 27 items that can be collected under three factors. The factor names are “Openness to Criticism/Development”, “Participation/Activeness” and “Lack of Prejudice/Flexibility”. The KMO value of the scale was 0.956; and the Bartlett Test values were x2=11001.719; sd=351; p<0.000. Items in the scale accounted for 56.619% of the total variance. As a result of the confirmatory factor analysis, the χ2
value was 808.07 and the degree of freedom was 321. Χ2/df is 2.51. The fit indices of the scale were determined as RMSEA=0.067; S-RMR=0.049; NFI=0.97. The item-total corrected correlation coefficients of the items in the scale varied between 0.40 and 0.703 (p<.01). The reliability coefficient of the scale was Cronbach’s alpha at 0.954 and the stability coefficients of the items were between 0.496 and 0.674 (p<,01). Keywords: civilizing, democratization, scale, validity and reliability
1. Introduction
The concept of “civic-mindedness” is among those that have recently been placed at the top of the agenda again as democracy has become more widespread around the world, despite its having been used in earlier periods of the history (Igci, 2008; Aytekin, 2013; Jonaski, 1998; Young, 1999) Considering the definitions of the term ‘civic-mindedness’ (TDK, 2015; Karakus, 2006) and the effects of non-governmental organizations on social life, that process of becoming civic-minded is closely related to concepts such as civil society, civilization, respect, pluralism, democracy, flexibility, productivity, not holding fixed views and prejudices, free will and legality, which all demand attention (Uluc, 2012; Cohen, Jean and Arato, 1992; Erkan, 2012; Jonaski, 1998).
Becoming civilized and civic-minded has a particular importance in terms of the countries that aim at democratization (Karakus, 2006; Tutar, Tutar and Erkan, 2012). It can be said that becoming civic-minded and democratization are a precondition of each other. It can be expected that a civil individual with the aforementioned properties will contribute significantly to the society in which he/she lives in political, social and economic terms (Uluc, 2012; Aytekin, 2013).
The civilizing of an individual or society is an educational issue from beginning to end as it is achieved throughout the course of life (Eraslan and Bertlek, 2011). Those who are responsible for the civilizing of an individual or society are educational institutions, and the people who teach there (Kondu and Sakar, 2013; Erkan, 2012). Accordingly, it can be said that one of the most important functions of educational institutions is to make individuals more civilized and civic-minded (Kondu and Sakar, 2013; Tutar, Tutar and Erkan, 2012).
Higher education institutions are productive environments as a result of legislation and their structures, which aim to create the culture of a ‘civil society’, as well as in preparing the next generation to enter society (Aksit, Sedar and
1
Tabakoglu, 2003; URL, 2016). The fact that civil society plays a dominant role in educational faculties in higher education and teacher training institutions is important. It is closely related to the civility of the communication and interaction between the teaching staff working there and their students (pre-service teachers), because education faculties are responsible for educating teachers responsible for passing on the idea of ‘civil society’ to the next generation.
It is important that the reforms aimed at promoting civil society is supported with teacher training which functions in terms of strengthening democracy and democratization. In other words, it can be said that teaching staff working as teachers at teacher training institutions are role models for their students and that they contribute significantly to civic-mindedness within a society. However, the transformation of this situation into a culture which goes beyond just being a discourse about the process of becoming civic-minded and democratization should be ensured in a scientific and rational way. This requires determining the civic-mindedness levels of teaching staff working at education faculties in scientific ways and taking the necessary measures. In other words, determining the levels of knowledge and how much a ‘civil culture’ is adopted by teaching staff, and making them reflecting on their behaviors can be considered an obligation.
In addition to this, no measurement tool was found that could be used to measure the civic-mindedness levels of teaching staff at education faculties. This study aimed to develop a valid and reliable scale that can be used in determining the civic-mindedness levels of the individuals working as the teaching staff in higher education institutions in general, and private institutions educating teachers.
2. Method
2.1 Study Group
The study group of this study consisted of 758 students studying in the third and fourth years of different departments in the Faculty of Education of Ahi Evran University, in the fall semester of 2015-2016. 256 of the students were male and 502 were female. Working with this study group resulted from the thought that teachers have the most important responsibility in expanding a ‘civil culture’ within a society. Students studying at the Faculty of Education were first grouped by their department and then data were collected in order to be able to perform the exploratory and confirmatory factor analysis studies on different groups.
2.2 Scale Development Process
In the process of developing the scale, a literature review and interviews with the students were first performed and a list of the qualities that a ‘civil individual’ must have was formed. The list formed was turned into expressions regarding behaviors with which teaching staff could be assessed by students, and the options (1) “Never”, (2) “Rarely”, (3) “Sometimes”, (4) “Most of the time” and (5) “Always” were added to them. It was accepted that the level of civic-mindedness increases with the increase in the frequency of related behavior.
A linguist and two pedagogical experts examined the draft scale in terms of expression, wording, spelling and punctuation errors. A draft scale consisting of 35 items was created after making the necessary corrections. The validity and reliability analysis of the scale was performed on the data collected with the help of SPSS 15.00.
The (1) construct validity and (2) item discrimination power analyses were performed on the data collected using the scale. The exploratory and confirmatory factor analysis techniques were used for the construct validity. The item-total correlation examination was performed for the item discrimination analysis. The reliability level of the scale was examined with the (1) internal consistency and (2) stability measurement tests.
Findings obtained from the validity and reliability analyses performed on the data are as follows.
3. Findings
3.1 Findings on the Validity of the Scale
The (1) exploratory factor analysis, (2) confirmatory factor analysis and (3) item discrimination (item-total correlation) examinations were performed for the construct validity in the framework of the validity analyses of the Scale for Determining Civic-Mindedness Levels of Individuals (SDCLI).
3.2 Construct Validity
between the loads in different factors were removed from the scale and the analyses were repeated (Buyukozturk, 2012; Eroglu, 2008).
27 items in total remaining in the scale were gathered under three factors. The KMO value of the scale with 27 items was 0.956; the Bartlett Test values were x2=11001.000. The factor loads remaining in the scale varied between 0.491 and 0.783. The items included in the scope of the scale explain 56.619% of the total variance. It is sufficient that the amount of variance explained in terms of behavioral sciences is 40% (Buyukozturk, 2012; Eroglu, 2008).
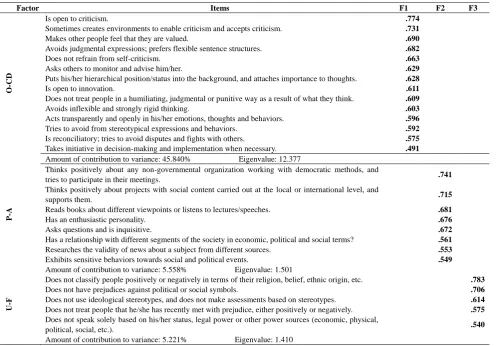
The content of the items in the factors was then examined, and names were given to the factors. 14 items were gathered under the factor named “Being Open to Criticism/Development (O-CD)”, 8 items under the factor named “Participation/Activeness (P-A)”, and 5 items under the factor named “(U-F)”. This is seen in Figure 1 for the eigenvalues.
Figure 1. Eigenvalue factor graph of the scale for determining civic-mindedness levels of individuals
Table 1. Factor analysis results of the scale
Factor Items F1 F2 F3
O
-CD
Is open to criticism. .774
Sometimes creates environments to enable criticism and accepts criticism. .731
Makes other people feel that they are valued. .690
Avoids judgmental expressions; prefers flexible sentence structures. .682
Does not refrain from self-criticism. .663
Asks others to monitor and advise him/her. .629
Puts his/her hierarchical position/status into the background, and attaches importance to thoughts. .628
Is open to innovation. .611
Does not treat people in a humiliating, judgmental or punitive way as a result of what they think. .609
Avoids inflexible and strongly rigid thinking. .603
Acts transparently and openly in his/her emotions, thoughts and behaviors. .596
Tries to avoid from stereotypical expressions and behaviors. .592
Is reconciliatory; tries to avoid disputes and fights with others. .575
Takes initiative in decision-making and implementation when necessary. .491
Amount of contribution to variance: 45.840% Eigenvalue: 12.377
P
-A
Thinks positively about any non-governmental organization working with democratic methods, and
tries to participate in their meetings. .741
Thinks positively about projects with social content carried out at the local or international level, and
supports them. .715
Reads books about different viewpoints or listens to lectures/speeches. .681
Has an enthusiastic personality. .676
Asks questions and is inquisitive. .672
Has a relationship with different segments of the society in economic, political and social terms? .561
Researches the validity of news about a subject from different sources. .553
Exhibits sensitive behaviors towards social and political events. .549
Amount of contribution to variance: 5.558% Eigenvalue: 1.501
U
-F
Does not classify people positively or negatively in terms of their religion, belief, ethnic origin, etc. .783
Does not have prejudices against political or social symbols. .706
Does not use ideological stereotypes, and does not make assessments based on stereotypes. .614
Does not treat people that he/she has recently met with prejudice, either positively or negatively. .575
Does not speak solely based on his/her status, legal power or other power sources (economic, physical,
political, social, etc.). .540
Amount of contribution to variance: 5.221% Eigenvalue: 1.410
The factor loads of 27 items in total remaining in the scale and the findings expressing the eigenvalue and variance of the factors are found in Table 1.
As seen in Table 1, the O-CD factor of the scale contained 14 items with loads between 0.491 and 0.774. The eigenvalue of the factor was 12.377, and its contribution to the general variance was 45.84%. The P-A factor contained 8 items with loads between 0.549 and 0.741. The eigenvalue of the factor was 1.501 and its contribution to the general variance was 5.558%. The third factor, the U-F factor, contained 5 items with loads between 0.540 and 0.783. The eigenvalue of this factor was 1.410, and its contribution to the general variance was 5.221%.
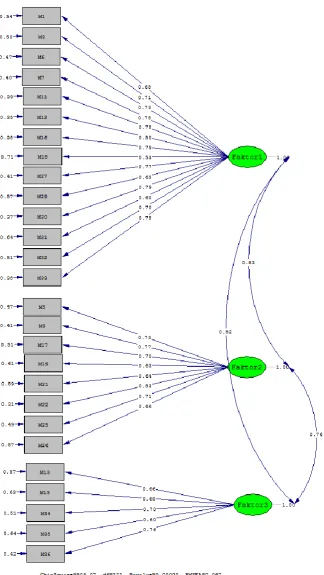
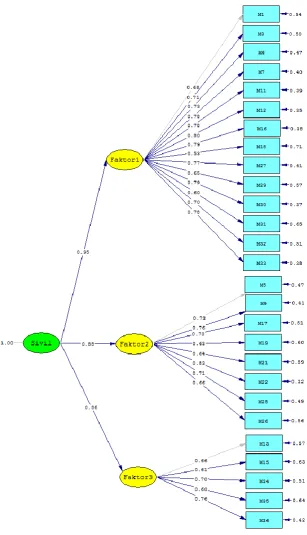
Findings on the confirmatory factor analysis:The first and second level confirmatory factor analysis was used in order to test the correctness of the 3-dimensional structure determined according to the results of the exploratory factor analysis. The confirmatory factor analysis was performed on the data collected from 454 students outside the sample where the data used for the exploratory factor analysis were used. While the covert variables represent a theoretical structure in the confirmatory factor analysis, the measurements observed are designed as the indicators of this structure (Joreskog and Sorbom, 1993). Starting from this, an equation modeling where the structure with 3 factors and 27 observed variables can be correctly estimated with the exploratory factor analysis was established, as is seen in Figure 2.
As a result of the confirmatory factor analysis, the χ2
value that varies by the sample size was 808.07 and the degree of freedom was 321. Χ2/df is 2.51. It can be said that this value indicates acceptable adaptation (Kline, 2005). In addition to this, RMSEA (Root Mean Square Error of Approximation), SRMR (Standardized Root Mean Square Residual), GFI (Goodness of Fit Index), AGFI (Adjusted Goodness of Fit Index), CFI (Comparative Fit Index) and NFI (Normed Fit Index) values among model fitness criteria were taken into consideration for the fitness of the structure. It was determined that the RMSEA value that must be below 0.05 for the fitness of the model (Browne and Cudeck, 1993) was below 0.067 and the SRMR value that must be below 0.10 (Kline, 2005) was 0.049. That the RMSEA and SRMR values were zero or quite close to zero shows the perfection of the model (Brown, 2006; Byrne, 2010).
Apart from this, it was determined that the GRI value, which must be 0.90 or above when the model is suitable, (Kline, 2005) was 0.85; and the AGFI value, which must be 0.90 or above, was 0.82. The GFI and AGFI values may be between 0 and 1 when the model is fit; they should be closer to 1 and they cannot be negative (Joreskog and Sorbom, 1993; Raykov and Marcoulides, 2006). It was seen that the NFI (Kline, 2005; Raykov and Marcoulides, 2006: 44) value, which must be between 0 and 1 and close to 1 was 0.97; and the CFI value, which must be between 0 and 1 and close to 1 again (Brown, 2006; Raykov and Marcoulides, 2006; Byrne, 2010) was 0.98. From the data obtained, it is seen that the model was confirmed.
Figure 2. First level confirmatory factor analysis correlation diagram
Figure 3. Second level confirmatory factor analysis correlation diagram
The factor loads related to the model obtained from the second level confirmatory factor analysis are seen in Figure 3. Factor loads varied between 0.53 and 0.80 for the sub-dimension O-CD; 0.63 and 0.83 for the sub-dimension P-A, and between 0.61 and 0.76 for the sub-dimension U-F.
Table 2. Fit Values and Fit Index Values Obtained from DFA Fit indices
examined Excellent fit Acceptable fit
First level fit indices
Second level fit indices
χ2/sd 0 ≤ χ2/sd ≤ 2 2 ≤ χ2/d<5 2,51 2,51
RMSEA 0 ≤ RMSEA ≤
0.05
0.05 ≤ RMSEA ≤
0.08 0.067 0.067
S-RMR 0 ≤ S-RMR ≤
0.05 0.05 ≤ S-RMR ≤ 0.10 0.049 0.049
NFI 0.95 ≤ NFI ≤ 1.00 0.90 ≤ NFI ≤ 0.95 0.97 0.97
CFI 0.97 ≤ CFI ≤ 1.00 0.95 ≤ CFI ≤ 0.97 0.98 0.98
GFI 0.95 ≤ GFI ≤ 1.00 0.90 ≤ GFI ≤ 0.95 0.85 0.85
AGFI 0.95 ≤ AGFI ≤
1.00 0.90 ≤ AGFI ≤ 0.95 0.82 0.83
According to the findings in Table 2, it can be seen that the fit indices of the first and second level confirmatory factor analysis were at an acceptable level. This means that the construct validity of SDCLI is confirmed.
3.3 Item Discrimination
According to the Classical Test Theory (CTT), the discrimination value (R-value) calculated in the form of the correlation coefficient varies between -1 and 1. It is necessary to investigate questions with a low r-value, and remove them from the test if necessary (Crocker and Algona, 1986). The most important criticism made about KTK parameters is that they are easily affected by the sample chosen (Hamilton and Jones, 1993). For this reason, in this study, Corrected Item Total Correlation values (Deville’s, 2003; Pall ant, 2007) are presented in Table 3 instead of KTK dependent parameter values:
Table 3. Item-total score corrected correlation analysis
O-CD P-A U-F
I. Num. r I. Num. r I. Num. r
1 0.681 (**) 15 0.410(**) 23 0.638(**)
2 0.578(**) 16 0.491(**) 24 0.486(**)
3 0.687(**) 17 0.532(**) 25 0.506(**)
4 0.628(**) 18 0.613(**) 26 0.628(**)
5 0.638(**) 19 0.523(**) 27 0.523(**)
6 0.432(**) 20 0.481(**)
7 0.585(**) 21 0.527(**)
8 0.691(**) 22 0.403(**)
9 0.703(**)
10 0.606(**)
11 0.677(**)
12 0.646(**)
13 0.580(**)
14 0.461(**)
As is seen from Table 3, the corrected correlation coefficients of the items range between 0.432 and 0.703 for the O-CD factor; between 0.403 and 0.613 for the P-A factor; and between 0.486 and 0.638 for the U-F factor. That the corrected correlation coefficients are higher than 0.20 means that the item can serve the aim of the relevant factor significantly (Pall ant, 2007). Accordingly, it can be said that each item serves the objective significantly.
3.4 Criterion Validity of the Scale
A relevant literature review was performed in order to determine the criterion reliability of the scale, and similar scales reliability cannot be calculated as there is no similar scale in terms of the content and objective.
3.5 Findings on the Reliability of the Scale
The internal consistency and stability analyses were performed on the data in order to calculate the validity of the scale.
3.6 Internal Consistency Level
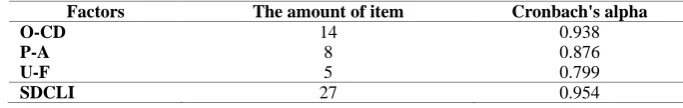
The reliability analysis of the scale consisting of 27 items and 3 factors in total was performed using the Cronbach’s alpha coefficient formula. The reliability values of the factors and the overall scale are summarized in Table 4.
Table 4. Reliability analysis results concerning the overall scale and its factors
Factors The amount of item Cronbach's alpha
O-CD 14 0.938
P-A 8 0.876
U-F 5 0.799
As is seen from Table 4, the Cronbach’s alpha reliability coefficients were determined as 0.938 for the O-CD factor, 0.876 for the P-A factor and 0.799 for the U-F factor. The reliability coefficient of SDCLI is 0.954. Accordingly, it can be said that the scale is able to make reliable (consistent) measurements (Buyukozturk, 2012; Balci, 2009).
3.7 The Ability to Make Stable Measurements
The stability level of the scale was calculated using the test-retest method. As is known, a reliable measurement tool should be able to make stable measurements (Balci, 2009). The 27-item form of the scale was applied again to 148 students five weeks later. The relationship between the scores obtained in the two applications was examined. The findings are summarized in Table 5.
Table 5. Test-retest results of the scale items
O-CD P-A U-F
I. Num. r I. Num. r I. Num. r
1 0.541(**) 15 0.538(**) 23 0.568(**)
2 0.650(**) 16 0.562(**) 24 0.585(**)
3 0.637(**) 17 0.496(**) 25 0.619(**)
4 0.694(**) 18 0.535(**) 26 0.548(**)
5 0.629(**) 19 0.610(**) 27 0.571(**)
6 0.649(**) 20 0.635(**)
7 0.618(**) 21 0.710(**)
8 0.551(**) 22 0.625(**)
9 0.458(**)
10 0.513(**)
11 0.514(**)
12 0.417(**)
13 0.518(**)
14 0.674(**)
N: 162; **=p<0.01
In Table 5, it is seen that the test-retest correlation coefficients of the items in the scale varied between 0.513 and 0.674 for the O-CD factor, between 0.496 and 0.710 for the P-A factor and between 0.548 and 0.619 for the U-F factor, and each relationship is significant (p<.01). Accordingly, it can be said that the scale can make stable measurements (Buyukozturk, 2012; Balci, 2009).
4. Discussion and Result
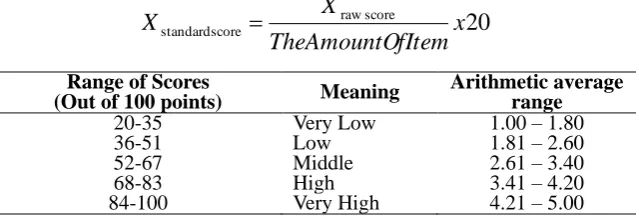
This study aimed to develop a scale that can be used in determining the civic-mindedness levels of the teaching staff working at a Faculty of education. The scale, named “The Scale for Determining Civic-Mindedness Levels of Individuals (SDCLI)” is a five-stage Likert-type scale and consists of 27 items that can be gathered under three factors. Each of the items in the factors was graded as (1) “Never”, (2) “Rarely”, (3) “Sometimes”, (4) “Most of the time”, (5) “All the time” to represent the frequency of behavior. Frequently exhibiting the relevant behaviors was assumed to mean that the characteristic of being civic-minded was ongoing and continuous. As the number of the items in the factors is different, it is possible to turn them into standard scores and structure and give meaning to the raw scores obtained from the scale/factor using the formula below, in such a way that the lowest is 20 and the highest is 100:
20
score raw score
standard
x
fItem
TheAmountO
X
X
Range of Scores
(Out of 100 points) Meaning
Arithmetic average range
20-35 Very Low 1.00 – 1.80
36-51 Low 1.81 – 2.60
52-67 Middle 2.61 – 3.40
68-83 High 3.41 – 4.20
84-100 Very High 4.21 – 5.00
The validity of the scale was determined by examining discrimination levels based on (1) the exploratory and confirmatory factor analysis and (2) item-total correlation.
First and second level confirmatory factor analysis was performed in order to confirm the factor structures of the scale that was found to consist of three factors as a result of the exploratory factor analysis. According to the results of both primary and secondary confirmatory factor analysis as a result of the confirmatory factor analysis, it was found that the observed values of the scale model were confirmed using the data of the model established (Kline, 2005; Joreskog and Sorbom, 1993; Brown, 2006);
The item-total score corrected correlation coefficients were calculated in order to determine the extent to which each of the items in the scale is able to measure the properties that it aims to measure. The corrected correlation values between each item of the scale and total scores varied between 0.403 and 0.703. Accordingly, it can be said that each item in the scale serves the objective of measuring the property that it is required to measure at a significant level with the overall scale, and each item is discriminative at the required level (Pallant, 2007; Balci, 2009).
A relevant literature review was performed in order to determine the criterion validity of the scale, but similar scale validity could not be calculated as there is no similar scale in terms of its content and objective.
The internal consistency levels varied between 0.799 and 0.938 by the factors of the scale calculated as the Cronbach’s alpha reliability coefficient. The reliability coefficient for the overall scale was 0.954. Within the framework of these values, it can be said that the scale is able make reliable measurements (Buyukozturk, 2012; Gorsuch, 1983).
The characteristics of being able to perform stable measurement of the items in the SDCLI were calculated with the test-retest method. The stability factors of the items varied between 0.496 and 0.710. All of these relationships were positive and significant at the level of p<0.001. Accordingly, each item on the scale is able to make stable measurements with their invariance aspect by time (Gorsuch, 1983; Buyukozturk, 2012).
Consequently, it can be said that SDCLI is a valid and reliable scale that can be used in determining the civility levels of individuals. In addition, it can be suggested that this scale could also be used for the measurement of the civic-mindedness levels of individuals working as employees and managers in different occupational groups and in different departments of secondary and higher education institutions. Nevertheless, the validity and reliability analyses of the scale should be performed again if they are applied to different segments of the population.
References
Aksit, B., Serdar, A., & Tabakoglu, B. (2003). The role of civil society organizations in strengthening civil society and participation. Research report. Ankara: TUBITAK-TUBA-YOK Sosyal ve Beseri Bilimler ve ODTU-AFP
Aytekin, S. (2013). The role of civil society institutions local economic development: The case of Kayseri. Unpublished master dissertation. Nigde Universitesi Sosyal Bilimler Enstitusu Iktisat Anabilim Dali, Nigde.
Balci, A. (2009). Sosyal bilimlerde arastirma: Yontem, teknik ve ilkeler. Ankara: PegemA Yayinevi.
Brown, T. A. (2006). Confirmatory factor analysis for applied research. New York: Guilford Press.
Browne, M. W., & Cudeck, R. (1993). Alternative ways of assessing model fit. In K. A. Bollen Editor & J. S. Long Editor (Eds.), Testing structural equation models (pp. 136–162). Newbury Park, CA: Sage.
Butler, S. F., Fernandez, K., Christine, B., Budman, S. H., & Jamison, R. N. (2008). Validation of the revisedscreenerand opioid assessment for patients with pain (SOAPP-R). J. Pain., 9(4), 360–372.
https://doi.org/10.1016/j.jpain.2007.11.014
Byrne, B. M. (2010). Structural equation modeling with AMOS. New York: Routledge.
Cohen, J. L., & Andrew, A. (1992). Civil society and political theory. Cambridge: MIT Press.
Crocker, L., & Algina, J. (1986). Introduction to classical and modern test theory. New York: Holt, Rinehart, & Winston.
DeVellis, R. F. (2003). Scale development: Theory and application. California: Sage Publications.
Eraslan, L., & Bertlek, S. B. (2011). The Evaluation of Problem Areas of the Educational Associations in Turkey, Gaziantep Universitesi Sosyal Bilimler Dergisi, 10(3), 1161-1181.
Erkan, E. (2012). The Possibility of Civil Society in the Muslim Societies. Din Bilimleri Akademik Arastirma Dergisi. 12(2), 195-206.
Eroglu, A. (2008). Factor analysis. S. Kalayci (Editor), SPSS Uygulamali Cok Degiskenli Istatistik Teknikleri (ss. 321-331). Ankara: Asil Yayin Dagitim.
Gorsuch, R. L. (1983). Factor Analysis. Hillsdale: Lawrence Erlbaum Associates.
IssuesandPractice, 12, 38–47. https://doi.org/10.1111/j.1745-3992.1993.tb00543.x
Igci, A. (2008). Political Participation Behavior of Join the Impact of Civil Society Organizations: Isparta Case Study. Unpublished master dissertation. Suleyman Demirel Universitesi Sosyal Bilimler Enstitusu, Isparta.
Jonaski, T. (1998) Citizenship and Civil Society. Cambridge: Cambridge University Press. https://doi.org/10.1017/CBO9781139174787
Joreskog, K., & Sorbom, D. (1993). Lisrel 8: Structural Equation Modeling with the Simplis Command Language. USA: Scientific Software International.
Karakus, O. (2006). Civil Society Organisations in the European Union harmonization process in Turkey. Unpublished master dissertation. Suleyman Demirel Universitesi, Isparta.
Keyman, E. F. (2015). Civil Society in Europe and Turkey. Retrieved from
http://www.siviltoplumakademisi.org.tr/index.php?option=comcontent&view=article&id=473:avrupada-ve-tuerkiy ede-sivil-toplum&catid=49:akademik&Itemid=113 (at 26.04.2015).
Kline, R. B. (2005). Principles and Practice of Structural Equation Modeling (2nd ed.). New York: Guilford. 366, ISBN 978-1-57230-690-5
Kondu, Z., & Sakar, T. (2013). Why Do We Give Education about Citizenship and Democracy? Mehmet Akif Ersoy Universitesi Egitim Bilimleri Enstitusu Dergisi, 2(3), 49-60.
Pallant J. (2007). SPSS Survivalmanual: A Step By Step Guide to data analysis using SPSS. Allen & Unwin, Sabon by Bookhouse, Sydney
Raykov, T., & Marcoulides, G. A. (2006). A First Course in Structural Equation Modeling. New Jersey: Lawrence Erlbaum Associates, Inc., Publishers.
Turk Dil Kurumu, (2015). Turkish Dictionary. Retrived from
http://www.tdk.gov.tr/index.php?option=com_bts&arama=kelime&guid=TDK.GTS.5560909dbc7060.88464491(2 5.04.2015).
Tutar, F., Tutar, E., & Erkan, C. (2012). The role of non-governmental organizations in european union - Turkey
relations. Adiyaman Universitesi Sosyal Bilimler Enstitusu Dergisi, 5(10), 439-459.
https://doi.org/10.14520/adyusbd.330
Uluc, A. V. (2012). Democracy Issue in Turkey within the Frame of Individual and Civil Society Relation. Mukaddime, 6, 1-19.
URL. (2016). 2547 Law No. 2547. Retrived from
http://mevzuat.basbakanlik.gov.tr/Metin.Aspx?MevzuatKod=1.5.2547&MevzuatIliski=0&sourceXmlSearch=([15. 06.2016).
Young, I. M. (1999). State, civil society and social justice. In I. Shapiro, C. Hacker (Eds), Democracy’s Value. Cambridge: Cambridge University Press.
Copyrights
Copyright for this article is retained by the author(s), with first publication rights granted to the journal.