Knowledge-Based Economy as a Foundation for the Economic
Development of Countries
Santos LOPEZ-LEYVA
Universidad Autónoma de Baja California
Calzada Universidad 14418, Parque Insutrial Internacional Tijuana 22390, Baja California, MX
Ana Bárbara MUNGARAY-MOCTEZUMA Universidad Autónoma de Baja California
Calzada Universidad 14418, Parque Insutrial Internacional Tijuana 22390, Baja California, MX
Abstract. This paper highlights the relationship between knowledge and economic development. The study considers nine countries grouped in three different development models: 1) the Asian model includes Japan, the Republic of Korea, and Singapore; 2) the Anglo-Saxon model includes the United Kingdom, the United States, and Canada and 3) the European model includes Germany, France, and the Netherlands. The data was sourced from the Global Competitiveness Report of the World Economic Forum, the PISA reports, the Academic Ranking of World Universities (ARWU) and the Global Innovation Index of the World Bank. The Asian group ranked highest for innovation as shown through the application of patents; they also obtained the highest scores in the PISA test. The Anglo-Saxon group stood out by having a good institutionalized knowledge system. From the European group, Germany is recognized by its innovation capabilities and the Netherlands by the quality of its higher education.
Keywords: knowledge-based economy, economic development, competitiveness, innovation, higher education.
Introduction
In this research paper, we analyze the relationship between knowledge and the economy of nine countries classified into three different models of economic development. The models are taken from Gregory and Stuart (2014), who point out the existence of four different models of development in the capitalist system: 1. The Anglo-Saxon: The United States, The United Kingdom, Switzerland, New
Zealand, Canada and Ireland
2. The Northern Europe: Germany, Norway, Sweden, The Netherlands, France, Finland, Denmark, Belgium, and Austria
The Anglo-Saxon model has its historical origins in Great Britain and is based on the ideas of Smith (1776/2008), and the fundamental concepts of classical liberalism that apply for both, individuals and the nations; where the factors of production are fully allocated by the market forces and there is non-interventionism.
The European model is based on ideas developed in Germany and France in the nineteenth century; these countries have less confidence in the invisible hand and allow a greater state intervention in economic affairs. It is mainly based on the Friedrich List doctrine where the state plays a central role in coordinating and promoting industrialization through the development of a "productive power" in the society. These countries pay special attention to the coordination of the different productive sectors and the protection of infant industries (Selwyn, 2014). The state widely intervenes in economic activity; therefore, it gives greater attention to the "common good," that in some ways is opposed to individual rights. In fact, during the first decade of the 21st century, the expenditure of the European governments was between 40% and 50% of the Gross Domestic Product (GDP), which reflects the high interventionism of the state in the economies.
The Asian model is focused on the accumulation of capital, very often with the help of the state. The goal is to reduce the economic gap and achieve a convergence with the high-developed countries in the less time possible. The countries of this group came from a recent industrialization process compared to the other models. They started their economic takeoff process via imitation, through the formation of human capital and industrialization policies to become innovator countries. In their first stage of growth, they showed a low level of income per capita and a wide rural population, so the main tasks in this first phase were the creation of human capital and the promotion of conditions to switch the labor force from the primary to the industrial sector.
From the beginning, the Asian model was based on five factors (Gregory & Stuart, 2014):
1. A fast demographic transition.
2. Macroeconomic reforms that created favorable conditions for investment. 3. Universal education and high investment in human capital.
4. An economy open to international trade. 5. Promotion of direct foreign investment.
Another consideration is the approach of Baumol, Litan, and Schramm (2007), who stated the existence of four categories of capitalism:
1. Capitalism led by the state, where the government directs the actions of the market, often through the establishment and control of state owned corporations. 2. Oligarchic capitalism, where the power and the wealth belong to a small group that is controlled by the state.
3. Corporate capitalism, where large firms carry out the most significant economic activities.
It is difficult to classify each model in one of the aforementioned categories, but we can make an approximation. The Anglo-Saxon model can be considered to be corporate capitalism with entrepreneurial vision. The European model is state oriented and promotes social innovation. Finally, the Asian model is ruled by the state; they foster an industrialization process focused on innovation and domestic savings.
All of the capitalistic outlooks and models introduce the knowledge variable and the different theoretical approaches and policies that promote development through the adoption of strategies that suit a knowledge-based economy. For example, the Organization for Economic Cooperation and Development (OECD) when developing its project TEP (Technology Economy Programme) recognized knowledge as the core of economic development and stated four main elements that a country should have in order to stand out as a knowledge-based economy (Ásgeirsdóttir, 2006):
1. Good overall economic performance.
2. Promote innovation, new technologies, the formation of human capital and entrepreneurism.
3. Considers globalization in the productive process and the application of knowledge.
4. The emergence and development of new institutions to promote a knowledge-based economy.
The objective of this work is to determine the importance of knowledge in the three models of economic development: Anglo-Saxon, Northern European and Asian. We describe the models and analyze the role that knowledge plays in their economic structure. The data is sourced from four reports that show the performance of the countries considered as knowledge-based economies. These reports are:
1. The Competitiveness Index developed by the World Economic Forum (WEF) since 2005.
2. The results of the test applied by the Programme for International Student Assessment (PISA) developed by the OECD since 2000.
3. The Academic Ranking World Universities (ARWU).
4. The Knowledge Economy Index (KEI) developed by the World Bank.
The first premise of our study is that the countries being studied consider knowledge to be the main factor for their development, although this could be used and assimilated in different ways in each of the models. A second premise is that recently industrialized countries give a greater priority to knowledge in the policies that promote economic development.
in the PISA test, and the positions that each of the nine countries has in the Knowledge Economy Index (KEI) 2000-2012. Third, a brief analysis of the results, authors considerations and the conclusions.
Theoretical framework
The term “knowledge-based economy” implies radical changes in the stages of production, distribution and consumption within the economy that follows a growth model based on the increase of intangible capital and the expansion of activities highly based on knowledge. In this economy, the investment is mainly directed at the production and the dissemination of knowledge and the promotion of institutions responsible for sustaining and improving human capital (Hadad, 2017; Leovaridis & Popescu, 2015).
Presently, there is a consensus that knowledge is a factor of great economic value and essential for development, therefore the governments try to move toward economic models based on this factor. For that, they require the implementation of policies that promote innovation, industries based on research and development, science, education and training (Rooney, Hearn & Ninan, 2005). A form of entrepreneurial capitalism requires significant incentives to promote innovation (Baumol et al., 2007).
There have been many studies that present a direct correlation between knowledge and economic growth. McMahon (2008) reviews such models and analyzes those proposed by Solow (1957), Lucas (1988), Romer (1990), Mankiw, Romer, and Weil (1992), and Kim and Lau (1996). These growth models have been the foundation of many other studies that link the variables of a knowledge-based economy with economic growth.
Industrial economies use knowledge to add value to the natural resources involved in the production processes. This factor generates value through new ideas and develops innovations as a means to achieve growth. This implies the implementation of new activities related to the production, acquisition, diffusion, and application of knowledge in the productive processes, therefore there is an emergence of companies, institutions, and societies that promote and carry out such activities (Lopez-Leyva, Castillo-Arce, Ledesma-Torres & Rios-Flores, 2014).
At the end of the 1980’s, a new model in the organization of research and development activities was developed, and new products with a higher content of knowledge emerged in the market. This new model has the following characteristics:
1. Decentralization of large corporations to smaller enterprises; small and medium enterprises have a greater participation in innovations.
2. Universities started designing diverse components for products.
4. Transformation of the industrial structure with the emergence of capital-venture companies (Augier & Teece, 2007).
This new paradigm where knowledge has a greater participation in the productive activities is known as a knowledge-based economy, although some authors call it "new economy”. In 2002, Grant described six characteristics of the "new economy" based on knowledge:
1. In terms of productive factors, knowledge is comparable to what land was in the preindustrial economy and capital in the industrial age.
2. It is an economy based on intangibles rather than on tangibles. 3. Networking.
4. An economy based on digital technologies. 5. An increase of virtual businesses.
6. The “new economy” experiences accelerated changes. The leap from innovation
to diffusion is very short.
Slaughter and Rhoades (2004) point out that the "new economy" considers knowledge as a material resource that can be acquired through legal resources and marketed as any product or service. Cohendet and Joly (2002) observe three facts regarding the production of knowledge:
1. An increase of codified knowledge in productive processes.
2. Research plays a new role in organizations, public and private companies. 3. The transformation of the incentive mechanisms for the producers of knowledge.
The works of Foray (2006) are in the same direction.
In the new economy, there is more competition between firms and countries where knowledge is a strategic resource for decision making; in this regard, Bratianu and Bolisani (2015) successfully integrate the processes of knowledge management and strategic management to create the concept of “knowledge strategy” which is referred to the creation of value through the use of knowledge as a strategic resource in decision making.
An essential aspect of this new paradigm is the participation of universities in the production and application of knowledge. This phenomenon has been widely studied and received different interpretations. For example, Etzkowitz, Industry, and Healey (1998) and Bratianu (2013) consider it as a second academic revolution centered on the “triple helix” model, where universities are linked to companies. Slaughter and Leslie (1997) establish the concept of “academic capitalism”; on the other hand, Gibbons et al. (1994) refer to “mode 2 of knowledge production.”
In the global context, multiple international agencies have been developing benchmarks, standards and indicators to measure different knowledge-related activities. We use some of these measurement instruments in this research (Gault, 2006).
Methods and data
First, we consider three countries for each of the three models mentioned above: 1. Asian model: Japan, the Republic of Korea and Singapore.
2. Anglo-Saxon model: the United States, the United Kingdom, and Canada. 3. Northern European model: Germany, France, and the Netherlands.
We use the competitiveness studies developed by the WEF when analyzing the performance of each model. The WEF says that competitiveness is built on twelve pillars, from which we only considered two for having a greater impact on knowledge-based economies. Pillar number 5 which is referred to higher education and training, and pillar number 12 that evaluates innovation. The rest of the pillars are institutions, infrastructure, macroeconomic environment, health and primary education, goods market efficiency, labor market efficiency, financial market development, technological readiness, market size, and business sophistication. Table 1 shows a ranking of the nine countries considering the concepts of global competitiveness, higher education, and innovation.
In 2016, the WEF evaluated 138 countries and classified them according to their levels of competitiveness; three main stages and two of transition:
1. Stage one: low competitiveness
2. Stage of transition: low-medium competitiveness 3. Stage two: medium competitiveness
4. Stage of transition: medium-high competitiveness 5. Stage three: High competitiveness
In this case, the nine countries are classified in stage three, which means they are highly competitive.
Table 1. Global Competitiveness, Higher Education and Innovation Rankings (2007-2016) (World Economic Forum, 2007, 2008, 2009, 2010, 2011, 2012,
2013, 2014, 2015, 2016)
Country Years and
Category 2 00 7 2 00 8 2 00 9 2 01 0 2 01 1 2 01 2 2 01 3 2 01 4 2 01 5 2 01 6 A vg .
Japan Competitiveness 8 9 8 6 9 10 9 6 6 8 8
Higher Education 22 23 23 20 19 21 21 21 21 23 21
Republic
of Korea Competitiveness 11 12 19 22 24 19 25 26 26 26 21
Higher Education 6 12 16 15 17 17 19 23 23 25 17
Innovation 8 9 11 12 14 16 17 17 19 20 14
Singapore Competitiveness 7 5 3 3 2 2 2 1 2 2 3
Higher Education 16 8 5 5 4 2 2 2 1 1 5
Innovation 11 11 8 9 8 8 9 9 9 9 9
United
States Competitiveness 1 1 2 4 5 7 5 3 3 3 3
Higher Education 5 5 7 9 13 8 7 7 6 8 7
Innovation 1 1 1 1 5 6 7 5 4 4 3
United
Kingdom Competitiveness 9 12 13 12 10 8 10 9 10 7 10
Higher Education 15 18 18 18 16 16 17 19 18 20 17
Innovation 14 15 15 14 13 10 12 12 12 13 13
Canada Competitiveness 13 10 9 10 12 14 14 15 13 15 12
Higher Education 13 9 9 8 12 15 16 18 19 19 14
Innovation 12 13 12 11 11 22 21 22 22 24 17
Germany Competitiveness 5 7 7 5 6 6 4 5 4 5 5
Higher Education 20 21 22 19 7 5 3 16 17 16 15
Innovation 7 8 7 8 7 7 4 6 6 5 6
France Competitiveness 18 16 16 15 18 21 23 23 22 21 19
Higher Education 18 16 15 17 20 27 24 28 25 21 21
Innovation 17 16 18 19 17 17 19 19 18 17 18
The Nether- Lands
Competitiveness 10 8 10 8 7 5 8 10 5 4 7
Higher Education 10 11 10 10 8 6 6 3 3 3 7
Innovation 13 12 13 13 12 9 7 8 8 7 10
to first place in 2015 and 2016. There is a high correlation (coefficient=0.96) between higher education and competitiveness. In comparison, they didn’t do as well in the innovation index; being ranked in 9th place for the period 2007-2016.
Regarding the indicator, for global competitiveness, Japan had stood out with an 8th place rank in 2016, and 5th place in innovation, although there is not a strong correlation between these two variables. With respect to higher education, they’re in 21st place.
For the 2007-2016, the Republic of Korea has been losing competitiveness in the three areas. They are placed 21st in global competitiveness and 17th for higher education. Even worse, if we take into account the last year of our study, that is 2016, the country was ranked 26th and 25th respectively. The loss of competitiveness in higher education has happened despite the fact that the country has the best indicator of education coverage in the international context.
From the Anglo-Saxon model, the most competitive country is the United States. It is globally ranked in 3rd place for the period 2007-2016, although in 2007 and 2008 it was in first place. Its best variable is innovation, which is also in 3rd place. Innovation has a higher correlation to global competitiveness than the other variables.
The United Kingdom holds 10th place in competitiveness for the period. From 2015 to 20016 it went from a 10th to a 7th place. In higher education, it’s in 17th place on average, although just for the year of 2016 it was in 20th place, which means a loss of competitiveness. Regarding innovation, it is placed in 13th, showing a steady performance in the previous years of the period.
Canada has lost competitiveness in the three indicators. For example, regarding global competitiveness, the country was ranked in 9th place in 2009, but it went down to 15th place by 2016. In higher education, it went from place 9th to 19th from 2009 to 2016. And, in the category of innovation, it went from place 12th to 24th in the same period.
From the European model, Germany is the most competitive country in 5th place. Its most significant variable is innovation in 6th place, although they are placed in 15th concerning higher education France’s numbers have shown a steady behavior and all of them are around the 20th place; the indicators have a high correlation among them. On average, the global competitiveness of the Netherlands is placed in 7th and has a positive trend. Its best performance is in higher education, ranking in 3rd place for three consecutive years (2014-2016).
Table 2. Number of World Class Universities that every country has among the best 500 universities of the Academic Ranking World Universities (ARWU)
Countries 2 0 0 7 2 0 0 8 2 0 0 9 2 0 1 0 2 0 1 1 2 0 1 2 2 0 1 3 2 0 1 4 2 0 1 5 2 0 1 6 Group 1
Japan 33 31 31 25 23 21 20 19 18 16
Rep. of Korea 8 8 9 10 11 10 11 10 12 11
Singapore 2 2 2 2 2 2 2 2 2 2
Total 43 41 42 37 36 33 33 31 32 29
Group 2
United States 166 159 152 154 151 150 149 146 146 137
United
Kingdom 42 42 40 38 37 38 37 38 37 37
Canada 22 21 22 23 22 22 23 21 20 19
Total 230 222 214 215 210 210 209 205 203 193
Group 3
Germany 41 40 40 39 39 37 38 39 39 38
France 23 23 23 22 21 20 20 21 22 22
The
Netherlands 12 12 12 12 13 13 12 13 12 12
Total 76 75 75 73 73 70 70 73 73 72
The Shanghai Jiao Tong University first published the Academic Ranking of World Universities in 2003. More than 1200 universities are ranked by ARWU every year, but only the best 500 are published. ARWU uses six objective indicators to rank world universities:
5. Number of articles indexed in Science Citation Index - Expanded and Social Sciences Citation Index.
6. The per capita academic performance of a university.
From the Asian group, Singapore only has had only 2 universities listed since 2007. The Republic of Korea shows a slight increasing number of universities listed in the ranking (8 in 2007, 11 in 2016). But, Japan has shown a decrease in the number of universities; in 2007 there were 33 universities in the list, while in 2016 the number went down to 16.
The Anglo-Saxon group has the most universities on the list (193 in 2016); although, their participation is declining. The number of American institutions considered world-class universities went from 166 to 137 between 2007 and 2016.
The European group has shown more stability (76 in 2007, 72 in 2016). The only country that showed a slight decrease was Germany.
In 2007, 69.8% of the world-class universities were from these nine countries. For 2016, this percentage went down to 58.8%, explained by the increasing participation of China that went from having 25 universities in 2007 up to 54 in 2016. These percentages show the high concentration of the production of knowledge.
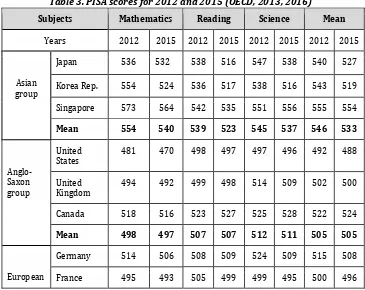
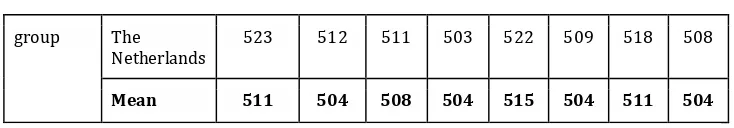
Table 3. PISA scores for 2012 and 2015 (OECD, 2013, 2016)
Subjects Mathematics Reading Science Mean
Years 2012 2015 2012 2015 2012 2015 2012 2015
Asian group
Japan 536 532 538 516 547 538 540 527
Korea Rep. 554 524 536 517 538 516 543 519
Singapore 573 564 542 535 551 556 555 554
Mean 554 540 539 523 545 537 546 533
Anglo-Saxon group
United
States 481 470 498 497 497 496 492 488
United
Kingdom 494 492 499 498 514 509 502 500
Canada 518 516 523 527 525 528 522 524
Mean 498 497 507 507 512 511 505 505
European
Germany 514 506 508 509 524 509 515 508
group The
Netherlands 523 512 511 503 522 509 518 508
Mean 511 504 508 504 515 504 511 504
PISA evaluations facilitated by the OECD started in 2000. Since then, the survey is applied every three years to assess the performance of fifteen-year-old students in three disciplinary fields: mathematics, reading comprehension, and science. In 2012, the test was focused on assessing mathematics skills and it was administered in 64 countries. In 2015, the test was focused on science and it was administered in 70 countries.Table 3 shows the scores obtained by the nine countries.
In 2012, Singapore received the highest scores in all three subjects; the country obtained 573 points in mathematics, and it was placed in 2nd out of 64 countries (only surpassed by Shanghai, China with 613 points); in reading and science they ranked 3rd place with 542 and 551 points respectively.
The United States obtained the lowest scores in all three subjects (481 points in math, 498 in reading, and 497 in science). It should be noted that the United States was the only country that performed under the OECD score average in the subject of mathematics, which is 494.
On average, the Asian group was in first place with 546 points, the European group in second with 511, and the Anglo-Saxon group in third with 505 points.
By 2015, Singapore achieved the highest scores in all three subjects, 564 points in math, 535 in reading and 556 in science. The Asian group obtained the highest scores in the three subjects, 540 points in mathematics, 523 in reading and 537 in science. On average, the Asian group was in first place with 533 points, the Anglo-Saxon in second with 505 points and the European in third with 504. The changes in the ranking were the result of Canada’s higher scores, and slightly worse performance of the countries from the European group.
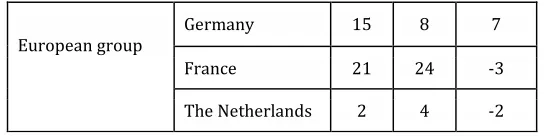
Table 4. Knowledge Economy Index (2000-2012) Countries 2000 2012 Change
Asian group Japan 17 22 -5
Republic of Korea 24 29 -5
Singapore 20 23 -3
Anglo-Saxon group United States 4 12 -8
United Kingdom 12 14 -2
European group Germany 15 8 7
France 21 24 -3
The Netherlands 2 4 -2
The KEI measures the capacity of a country to generate, adopt and disseminate technology. In 2012, the World Bank assessed 146 countries. The index is built upon 109 indicators that are classified in 4 pillars:
1. Economic and Institutional Regime 2. Education
3. Innovation
4. Information and Communication Infrastructure.
Table 4 shows a comparison of the rankings of the nine countries for 2000 and 2012. The ranking goes from 1 to 146 (from the most to the less competitive). The table shows that the Netherlands is the most competitive from the group of nine, although considering all the countries it ranked in 4th place and also has lost 2 places since 2000. The Republic of Korea has the lowest KEI of the group; globally, it is in 29th place and has gone down 5 places since 2000. The United States has the worst performance of the group; from being in 4th place in 2000, it fell to 12th place in 2012.
Analysis and discussion
We first present our conclusions about the Asian group, then the Anglo-Saxon group and finally the European group.
The Asian group
The countries of this group advocate for policies that promote the formation of human capital, where two tendencies can be observed: Japan promotes innovation and training, while Singapore aims for policies that improve higher education and research; precisely, one of the five policies that support this model is called “Education for all.”
education, since in 2007 it was placed in 16th and by 2015 it moved up to the first place, which was also held in 2016. Singapore’s global competitiveness acquired high significance, the country has moved from place 7th in 2007 to first place in 2014 and second place in 2015 and 2016. The country has been focused on improving the quality of its universities and has become number one in teaching mathematics and science; they also thrive on the use of new technologies and Internet access in the universities.
The results from the PISA 2016 report validate Singapore’s education good performance; this country ranks in first place in the three subjects: 564 in mathematics, 535 in reading comprehension and 556 in science. This group had the best scores in PISA 2015; it was 29 points ahead of the European group, and 28 points ahead from the Anglo-Saxon group. Their strength and the best scores are in the subject of mathematics. These results are consistent with the index developed by Hanushek and Woessmann (2015), that aimed to measure the skills acquired by 15-year-old students; such index was built for 77 countries from 1964 to 2003; the Asian group scored 5,326 points, followed by the European group with 5,037 points and the Anglo-Saxon group with 4,963 points. The country that scored the highest number was the Republic of Korea with 5,338 points, while the United States was at last with a score of 4,903 points.
Moreover, the Asian model world-class universities listed on ARWU are related to the industry sector, compared to other universities from the other two groups (Lopez-Leyva, 2013). Regarding the KEI, the three countries of the Asian group lost places during the period of 2000-2012. Japan and Korea lost 5 places each, while Singapore lost 3.
Analyzing the type of education institutions, we found that in Japan, the higher education institutions are mostly private, 542 out of 709 universities (76.55%). Just considering colleges and training schools, from a total of 3,443 institutions, 3,228 were private, that is almost 94% (Yonezawa, 2006). Since most of the universities ranked in the ARWU are public, a decreasing investment in these institutions has been reflected in a decreasing number of universities in the ARWU rankings (Altbach, 2016).
Regarding innovation, the Ministry of International Commerce and Industry of Japan fostered an industrialization process that has been intensive in the use of capital and technology, for that it was necessary to implement innovation processes (Vietor, 2007).
institutions that are oriented to researching which are under the authority of the Ministry of Science and Technology. Regarding innovation, Korea implemented policies that facilitate the learning of technology and thus strengthen their international competitiveness. In 1986, the country made some changes to their regulations, switching from policies that privileged strategic sectors to policies that support innovation through the promotion of R&D activities. Besides, the country has always tried to disseminate instead of just imitating the technology that has been acquired through imports (Kim, 1997).
Singapore’s education system is more oriented to research; its two public universities are listed on the Academic Ranking World Universities. The National University of Singapore is in 113th place and the Nanyang Technological University is in 161st place. This country has become, in a short period of time, an economy of innovation. It also had a growth rate that surpassed 8% annually from 1960 to 2000. This growth has been supported by a service sector that is technology oriented and the strength of their national innovation system, which protects copyrights the creation and trade of knowledge (Wong, 2007).
The Anglo-Saxon group
The countries of this group are consolidated economies that had an early industrialization process. England is considered the cradle of the industrial revolution with a history that goes back to the "glorious" revolution of 1688. In the case of the United States, the process of industrialization began after its independence in 1776.
First, the United States is known for its strength in innovation. It was globally ranked in 2nd place in innovation capacity, thanks to the availability of scientists and engineers, their investment in R&D companies and the collaboration between universities and the industry. Regarding higher education and training, it was ranked in seventh place. Their coverage in higher education is good and the management processes within the universities are excellent. Some of their strengths are the institutionalization of research and the promotion of the so called third mission (communities engagement). However, the country has lost competitiveness, from being ranked in first place in 2007; it fell to seventh place in 2012, but recovered in 2014 when it was ranked in third place.
The United Kingdom is in 10th place in global competitiveness, 17th in higher education and 13th in innovation. A good management and their capacity to do local research recognize the universities of this country. Their Research Centers are known for their quality and the close collaboration between the university and the industry.
The results of the 2012 PISA test showed that the Anglo-Saxon group obtained the lowest scores compared to the other two groups of countries; 505 points in average, 498 in mathematics, 507 in reading, and 512 in science. It should be noted that there is a significant gap of 56 points between this group and the Asian group. The United States average score is the lowest of the group with 492 points, while Canada obtained the highest score with 522. By 2015, this group surpassed the average score of the European group by one point, but only because the scores obtained by the latter decreased. Also, Canada showed an improvement in the global average score.
Regarding the KEI, the United States lost 8 places from 2000 to 2012, with the worst performance of the group; the United Kingdom lost 2 places, while Canada gained three places.
The higher education system in the United States is very diverse; there are community colleges that offer 2 year programs, which approximately 53% are public, 35% are private and 12% are non-profit. There is a system of public universities with four-year careers (25% of the total); there are private universities with important research groups; and there are also a number of private institutions that offer certifications and short careers with specializations. Universities, both public and private, are closely linked to knowledge production activities through research (Eckel & King, 2006).
The education system in Canada is provincial, since the provinces provide the funds for the higher education institutions. In 2006, there were 190 public universities and 300 community colleges. There are also private colleges (Jones, 2006).
The United Kingdom education system consists of 14 universities, plus seven higher education institutions of another type in Scotland. Wales has 13 institutions, while England in 2006 had 131 institutions, of which 77 were universities, 14 general colleges and 40 specialized colleges (Shattock, 2006).
In 2016, this group had 193 universities listed on the ARWU rankings, which represents 38.6% of the total world-class universities. Lopez-Leyva (2013) states that universities in North America are teaching oriented, and they have better institutional and infrastructure conditions.
European group
Netherlands is in place 8th in global competitiveness, 7th in higher education and 11th in innovation. Although lower presently, their innovation ranks improved to 8th place in 2014 and 2015. This country is recognized for the quality of its universities, higher education coverage, and their local capacity to do research. Regarding innovation, they stand out for the quality of their research institutes and the collaboration between universities and the productive sector.
In 2012, according to the PISA report, this group of countries was in 2nd place with a score of 511 points in average; 511 points in mathematics, 508 in reading and, 515 in science. Germany was in first place in math and science, while the Netherlands was in first place in reading. In 2015, this group fell to 3rd place with 504 points in average. The three countries obtained lower scores, although the worst performance was seen in science.
This group has 72 world-class universities, 14.4% of the total. The report shows that their authors are highly cited and their academic production has an impact in the world (Lopez-Leyva, 2013).
Regarding the KEI, Germany has shown improvement, from being in 15th place in 2000, it moved up to place 8th in 2012. Meanwhile, France lost three places and the Netherlands lost two; although, the latter is in 4th place globally, which is the best place among the nine countries. The German education system is considered the foundation for the emergence of research universities. They promoted what we know as the first academic revolution in the universities, by considering research a substantial activity in higher education institutions. The German universities have been involved in research activities since the second half of the 21st century. Their education system is based on the Humboldtian philosophy introduced in the University of Berlin in 1810. Its main success was the revolution in the chemistry field with the discovery of ammonia. Their education system is highly controlled by the state. More than half of their universities are focused on applied sciences, about 27% are universities in general fields and the rest are tech schools and others aim to form teachers (Kehm, 2006).
The higher education system in France is also essentially public, since 80% of the students are enrolled in public universities, while about 50% of the big ecoles are also public. That means that 90% of the students in the country are enrolled in a public university (Musselin, 2006).
Finally, we briefly describe the higher education system of The Netherlands, which in 2015 had 16 public universities from which, nine offered all the disciplines, three offered engineering careers, one more offers agriculture, and another one life sciences, the University of the Nation and an online university.
This research helps to understand the importance of knowledge in three different models of development followed by the most successful countries in the global economy. These countries have designed and implemented strategies that could be used in developing countries. We are not suggesting they should implement the same policies, but they could observe the behavior and performance of developed countries and define their own strategies considering their regional and local conditions.
Conclusions
The nine countries highly participate in activities related to the knowledge economy; their great performance in some of the indicators reflects and supports such statement. The state plays a central role, fostering strategies toward the strengthen of knowledge-based economies, through the promotion of quality in higher education and the implementation of policies for innovation. A good example is Japan that went from being an imitator of technology, to successfully becoming an innovative economy.
The greatest concern of the countries participating in the knowledge economy has led to a growing interest to measure the components of this factor and their impact in development. Such measurements are relatively new; some started to be developed in the 21st century. For example, the World Economic Forum (WEF) introduced the Global Competitiveness Index in 2005, the PISA test was introduced in 2000, and the KEI became popular in the same year. Other mechanisms of assessment are the university rankings, which, even though it might be an old practice, they have only started being widely used since 2000. The high interest in measuring knowledge reflects the importance of this factor and its impact on economic development.
The nine countries are in stage three of development, that means they are part of the most competitive nations according to the WEF, but they use knowledge differently and even though there is a tendency to design development models that group countries together, internally the countries show differences regarding the application of this factor. For example, considering the Asian model, Japan has put more emphasis on innovation based on learning from companies and technological institutions that train for work. They are also recognized for their effectiveness in the application of patents. On the other hand, Singapore promotes knowledge through scientific research, hence the development of research universities that has led to the creation of "biopolis." Such concern has led the countries of this group to establish agreements and promote a good relationship between the universities and the industry. Moreover, this group is in first place in the matter of skills acquired in school (Hanushek & Woessmann, 2015).
large firms; regarding education, the country has lost competitiveness, according to the PISA test and the KEI. It should be noted that all three countries have great strength in the institutionalization of research and excellent infrastructure for teaching in their universities.
From the European group, Germany has improved its competitiveness through innovation. Meanwhile, The Netherlands has considerably improved in higher education. This group of countries has had a great performance in what is called the second industrial revolution, especially in the chemical industry. Their higher education institutions are strong in research, a fact that can be verified by the global influence that their researchers have through their publications.
Deeper and more detailed research on this matter should include an analysis of the competitiveness indicators for each of the twelve pillars. For this study, the component of higher education includes eight indicators and innovation includes seven. Likewise, a wider study of the PISA test components, a revision of the indicators of the university rankings and the KEI index should be done.
References
Academic Ranking World Universities (2007). Academic Ranking of World Universities 2007. Retrieved from
http://www.shanghairanking.com/ARWU2007.html.
Academic Ranking World Universities (2008). Academic Ranking of World Universities 2008. Retrieved from
http://www.shanghairanking.com/ARWU2008.html.
Academic Ranking World Universities (2009). Academic Ranking of World Universities 2009. Retrieved from
http://www.shanghairanking.com/ARWU2009.html.
Academic Ranking World Universities (2010). Academic Ranking of World Universities 2010. Retrieved from
http://www.shanghairanking.com/ARWU2010.html.
Academic Ranking World Universities (2011). Academic Ranking of World Universities 2011. Retrieved from
http://www.shanghairanking.com/ARWU2011.html.
Academic Ranking World Universities (2012). Academic Ranking of World Universities 2012. Retrieved from
http://www.shanghairanking.com/ARWU2012.html.
Academic Ranking World Universities (2013). Academic Ranking of World Universities 2013. Retrieved from
http://www.shanghairanking.com/ARWU2013.html.
Academic Ranking World Universities (2014). Academic Ranking of World Universities 2014. Retrieved from
http://www.shanghairanking.com/ARWU2014.html.
Academic Ranking World Universities (2015). Academic Ranking of World Universities 2015. Retrieved from
Academic Ranking World Universities (2016). Academic Ranking of World Universities 2016. Retrieved from
http://www.shanghairanking.com/ARWU2016.html.
Altbach, P.G. (2016). Global perspectives on higher education. Baltimore: Johns Hopkins University Press.
Àsgeirsdòttir, B. (2006). OECD work on knowledge and the knowledge economy. In Brian, K., and Dominique, F. (Eds.), Advancing knowledge and the knowledge Economy (pp.17-23). Cambridge: The MIT press.
Augier, M., and Teece, D.J. (2007). Perspectives on research and development. Organizing and Managing innovation in a (Global) knowledge-based-economy. In Ichijo, K., and Nonaka, I. (Eds.), Knowledge creation and management. New Challenges for managers (pp.198-212). Oxford: Oxford University Press.
Baumol, W.J., Litan, R.E., and Schramm, C.J. (2007). Good capitalism, bad capitalism, and the economics of growth and prosperity. New Haven: Yale University Press.
Bratianu, C., and Bolisani, E. (2015). Knowledge strategy: An integrated approach for managing uncertainty. In Garlatti, A., and Massaro, M. (Eds.), Proceedings of theEuropean Conference on Knowledge Management (pp.169-177). Reading: Academic Conferences International Limited.
Bratianu, C. (2013). The triple helix of the organizational knowledge. Management dynamics in the knowledge economy, 1(2), 207-220.
Cohendet, P., and Joly, P.B. (2002). The production of technological knowledge: New issues in a learning economy. In Archibugi, D., and Lundvall, B.-Å. (Eds.), The globalizing learning economy (pp.63-82). Oxford: Oxford University Press. De Weert, E. (2006). The Netherlands. In James, J.F.F., and Altbach, P.G. (Eds.),
International handbook of higher education (pp.899-918). New York: Springer.
Eckel, P.D., and King, J.E. (2006). United States. InJames, J.F.F., and Altbach, P.G. (Eds.), International handbook of higher education (pp.1035-1053). New York: Springer.
Etzkowitz, H., Webster, A., and Healey, P. (1998). Capitalizing knowledge. New interactions of industry and academia. Albany: State University of New York. Foray, D. (2006). The economics of knowledge. Cambridge: The MIT Press.
Gault, F. (2006). Measuring knowledge and its economic effects: The role of official statistics. In Kahin, B., and Foray, D. (Eds.), Advancing knowledge and the knowledge economy (pp.27-42). Cambridge, MA: The MIT Press.
Gibbons, M., et al. (1994). The new production of knowledge. The dynamics of science and research in contemporary societies. London: Sage Publications.
Grant, R.M. (2002). The knowledge-based view of the firm. In Choo, C.W., and Bontis, N. (Eds.), The strategic management of intellectual capital and organizational knowledge (pp.133-148). Oxford: Oxford University Press. Gregory, P.R., and Stuart, R.C. (2014). The global economy and its economic systems.
Mason, OH: Southwestern.
Hadad, S. (2017). Knowledge economy: Characteristics and dimensions. Management dynamics in the Knowledge economy, 5(2), 203-225. Hanushek, E.A., and Woessmann, L. (2015). The knowledge capital of nations.
Jones, G.E. (2006). Canada. In James, J.F.F., and Altbach, P.G. (Eds.), International handbook of higher education (pp.627-645). New York: Springer.
Kehm, B.M. (2006). Germany. In James, J.F.F., and Altbach, P.G. (Eds.), International handbook of higher education (pp.729-745). New York: Springer.
Kim, J.-I., and Lau, L. (1996). The Source of Asian Pacific Economic Growth. Canadian Journal of Economics, 24(1), 448–454.
Kim, L. (1997). Imitation to innovation: dynamics of Korea's technological learning. Boston: Harvard Business School.
Leovaridis, C., and Popescu, G. (2015). Organizational innovation- A means to enhance quality of life for employees in knowledge economy. Management Dynamics in the Knowledge Economy, 3(1), 24-43.
Lopez-Leyva, S. (2013). Niveles de competitividad de los países y concentración de universidades de clase mundial. Regional and sectorial economic studies, 13(3), 145-160.
Lopez-Leyva, S., Castillo-Arce, M.L., Ledesma-Torres, J.D., and Ríos-Flores, J.A. (2014). Economic growth from a theoretical perspective of knowledge economy: an empirical analysis for Mexico. Management Dynamics in the Knowledge Economy, 2(2), 217-239.
Lucas, R.E. (1988). On the Mechanics of Economic Development. Journal of Monetary Economics, 22(1), 3-42.
Mankiw, N.G., Romer, D., and Weil, D.N. (1992). A Contribution to the Empirics of Economic Growth. Quarterly Journal of Economics, 107(2), 407-437. McMahon, W.W. (2008). Education and development. Measuring the social benefits.
New York: Oxford University Press.
Musselin, C. (2006). France. In James, J.F.F., and Altbach, P.G. (Eds.), International handbook of higher education (pp.711-728). New York: Springer.
OECD (2013). Resultados de PISA 2012 en Foco. Lo que los alumnos saben a los 15 años de edad y lo que pueden hacer con lo que saben. Retrieved from www.oecd.org/pisa/keyfindings/PISA2012_overview_ESP-FINAL.pdf. OECD (2016). PISA 2015. Resultados Clave. Retrieved from
https://www.oecd.org/pisa/pisa-2015-results-in-focus-ESP.pdf. Park, N. (2006). Korea. In James, J.F.F., and Altbach, P.G. (Eds.), International
handbook of higher education (pp.867-879). New York: Springer. Romer, P.M. (1990). Endogenous Technological Change. Journal of Political
Economy, 98(5), 71-102.
Rooney, D., Hearn, G., and Ninan, A. (2005). Knowledge: concepts, policy,
implementation. In Rooney, D., Hearn, G., and Ninan, A. (Eds.), Handbook on the knowledge economy (pp.178-190). Cheltenham: Edward Elgar.
Selwyn, B. (2014). The global development crisis. Cambridge: Polity Press Shattock, M. (2006). United Kingdom. In James, J.F.F., and Altbach, P.G. (Eds.),
International handbook of higher education (pp.1019-1033). New York: Springer.
Slaughter, S., and Leslie, L. (1997). Academic Capitalism. Politics, policies, and the entrepreneurial university. Baltimore: The Johns Hopkins University Press. Slaughter, S., and Rhoades, G. (2004). Academic capitalism and the new economy.
Smith, A. (1776/2008). Investigación sobre la naturaleza y causas de la riqueza de las naciones. Mexic: Fondo de Cultura Económica.
Solow, R.M. (1957). Technical Change and the Aggregate Production Function. The Review of Economics and Statistics, 39(3), 312-320.
Vietor, R.H.K (2007). How countries compete. Strategy, Structure, and Government in the global economy. Boston: Harvard Business School Press.
Wong, P.K. (2007). Approaches to university-industry links. The case on the National University of Singapore. In Yusuf, S., and Nabeshima, K. (Eds.), How universities promote economic growth (pp.199-208). Washington: World Bank.
World Economic Forum (2007). The Global Competitiveness Report 2007–2008. Geneva: World Economic Forum.
World Economic Forum (2008). The Global Competitiveness Report 2008–2009. Geneva: World Economic Forum.
World Economic Forum (2009). The Global Competitiveness Report 2009–2010. Geneva: World Economic Forum.
World Economic Forum (2010). The Global Competitiveness Report 2010–2011. Geneva: World Economic Forum.
World Economic Forum (2011). The Global Competitiveness Report 2011–2012. Geneva: World Economic Forum.
World Economic Forum (2012). The Global Competitiveness Report 2012–2013. Geneva: World Economic Forum.
World Economic Forum (2013). The Global Competitiveness Report 2013–2014. Geneva: World Economic Forum.
World Economic Forum (2014). The Global Competitiveness Report 2014–2015. Geneva: World Economic Forum.
World Economic Forum (2015). The Global Competitiveness Report 2015–2016. Geneva: World Economic Forum.
World Economic Forum (2016). The Global Competitiveness Report 2016–2017. Geneva: World Economic Forum.
Yonezawa, A. (2006). Japan. In James, J.F.F., and Altbach, P.G. (Eds.), International handbook of higher education (pp.829-837). New York: Springer.