JIEM, 2016 – 9(1): 90-109 – Online ISSN: 2013-0953 – Print ISSN: 2013-8423 http://dx.doi.org/10.3926/jiem.1558
An Integrated Factor Analysis Model for Product Eco-Design Based
on Full Life Cycle Assessment
Zhifang Zhou
1,2, Tian Xiao
1, Dayuan Li
1,2*1
Business School, Central South University, Changsha, Hunan-410083,
2Collaborative Innovation Center of
Resource-conserving & Environment- friendly Society and Ecological Civilization, Central South University, Changsha,
Hunan-410083 (China)
[email protected], [email protected], *Corresponding author:[email protected]
Received: June 2015 Accepted: January 2016
Abstract:
Purpose: Among the methods of comprehensive analysis for a product or an enterprise, there
exist defects and deficiencies in traditional standard cost analyses and life cycle assessment
methods. For example, some methods only emphasize one dimension (such as economic or
environmental factors) while neglecting other relevant dimensions. This paper builds a factor
analysis model of resource value flow, based on full life cycle assessment and eco-design theory,
in order to expose the relevant internal logic between these two factors.
Design/methodology/approach: The model considers the efficient multiplication of
resources, economic efficiency, and environmental efficiency as its core objectives. The model
studies the status of resource value flow during the entire life cycle of a product, and gives an
in-depth analysis on the mutual logical relationship of product performance, value, resource
consumption, and environmental load to reveal the symptoms and potentials in different
dimensions.
Originality/value: This provides comprehensive, accurate and timely decision-making
information for enterprise managers regarding product eco-design, as well as production and
management activities. To conclude, it verifies the availability of this evaluation and analysis
model using a Chinese SUV manufacturer as an example.
Keywords:
eco-design, full life cycle assessment, resource value flow, resource efficiency, economic
efficiency, environmental efficiency
1. Introduction
Eco-design is an approach to product design that makes special consideration of the environmental impact of the product during its entire life cycle. Eco-design of a product, including any variations in ecological design patterns, has a critical impact on the status of the product’s material and value flow during its entire production process. The cost and value of the product and its associated environmental load and consumption of resources are also affected. To this effect, it is necessary to comprehensively evaluate and analyze the status of the material and value flow of a product’s life cycle so as to provide complete and timely eco-design information.
There are variable comprehensive evaluation methods on the horizon, However, there are defects and deficiencies in the existing evaluation and analysis methods. For example, some methods only focus on one aspect of the product (economic or environmental factors,) despite varying degrees of impairment, moreover relatively fewer methods for comprehensive evaluation and analysis of the product system.
The primary objective of this paper is to build a fully comprehensive evaluation analysis model which can trace, evaluate, and analyze the status of the material and value flow of the product life cycle process, from the three harmonization perspectives (resources, environment, and economy). Based on the concept and principle of the IPAT equation, this paper builds the total factor evaluation analysis model and creates specific evaluation by seeking a strict number of logical relationships between resource efficiency, economic efficiency and environmental efficiency. This paper also completes the analysis of the different stages of resource flow in the life cycle of products by constructing an X, Y, Z multiples evaluation factor at the core of the relationship between the product performance, resource consumption and environmental load.
2. Review on Traditional Evaluation and Analysis Methods of Product
Resource and environmental factors are crucial to the product’s design. Environmental performance goals are carefully set for the product, in order to leave minimal environmental impact (COM, 2003; Ortiz, Raluy & Serra, 2007). The objective is not only to reduce the consumption of materials and energy and the emission of harmful substances, but also to make the products and parts easily retrievable, recyclable and re-usable (Bhander, Hauschild & McAloone, 2003; Sakao, 2007).
2.1. Standard Costs and Variance Analysis Mode
This model introduces a standard cost and target cost ideology, and establishes cost standards as well as proportion standards of cost allocation for different product cost types. The comparative analysis on the variance between actual cost and standard cost and the evaluation of its causes provide basic information that controls decision-making. There are two key points for the implementation of this evaluation analysis model. First, the cost standard is the staff's goal, along with the scale to measure the actual cost savings or cost overages, which create in-process control. Second, by comparing the actual consumption of cost against standard consumption, analyzes on the differences from the cost standards and identifying the attributes of responsibility provides a basis for decision-making and improved measures of control. With the cost variance as the core, the standard cost evaluation model can analyze and evaluate the locations of costs incurred and create clear attributes of responsibility. However, this analysis model is difficult to apply to the entire eco-design process due to the lack of an ecological perspective and extensive cost concept as well as analysis boundary. It is hard for an enterprise that has not applied the environmental cost accounting to set a standard cost, let alone analysis cost variances.
2.2. Resource Flows Cost Analysis Model
over the process of a product’s life cycle, apart from manufacturing sectors, it must include transportation, consumption, recycling, and other relevant factors. The analytic model cannot be applied mechanically, unless innovative improvements could be adapted according to different enterprises’ reality.
2.3. Factor X Indicator Method
The concept “eco-efficiency” was suggested by the World Business Council for Sustainable Development (WBCSD), enhanced by R. Yamamoto and became the base of Factor X indicator method, which aims at evaluating eco-design, manufacture and environmental burden of products as well as assessing technology improvement and eco-efficiency. It can quantify the relationship between product value and environmental influence and release the ideal condition that if a conventional product can be produced at 1/X times of its environmental impact cost, the eco-efficiency will be considered to improving by X times (Factor X) (Yamamoto, 1999). The connotation of eco-efficiency and Factor X in the method can be defined by the following equations (Takahashi, 2005; Aoe, 2006, 2007).
eco−efficiency= value of new product
environmental influence of new product (1)
X multiple evaluation factors of product=eco−efficiency of new product
eco−efficiency of old product (2)
The Factor X indicator qualified the advantages such as simplicity and high usability, it can be used to evaluate and analyze (both before and after optimization,) the before and after value of product eco-design and any improvement of the product's environmental impact. However, it still does not reflect the mutual logical relationships between product performance, product value and environmental impact of product, which are the three core factors in eco-design considerations. Therefore, we need to improve the X multiple evaluation factors with the absorption value of engineering principles in this paper.
2.4. Life Cycle Assessment Method
Pons, 2008; van der Velden, Kuusk & Köhler, 2015). LCA evaluation mainly functions using a matrix method, analytic hierarchy process, and multi-objective decision-making optimization method. These current models also have their own advantages and disadvantages (Jonsson & Svensson, 1997; Spengler, Geldermann, Hahre, Sieverdingbeck & Rentz, 1998). For example, data requirement is low for the matrix method, but is subjective; Analytic Hierarchy Process can solve the problem of weight, but determining the degree of membership is subjective and largely uncertain; Multi-objective decision optimization can provide evaluation results under different assumptions and provide choices to decision-makers, but the expression of specific results have a certain degree of difficulty due to many influencing factors.
Life cycle assessment has been widely used abroad, but there are some drawbacks in the methodology and practical application, such as subjective evaluation, less precise data, uncertain results and more. Therefore, few domestic case studies have been performed. There are many shortcomings in other methods, such as substance metabolism analysis, evaluation of circular economy, and others (Xiong, Xiao, Chen & Zhou, 2015). Traditional methods do not adequately meet the needs of the resource value flow assessment and analysis in products’ life cycles for eco-design. So this paper tries to built an integrated factor analysis model based on Factor X indicator model, resource value flow method and Life cycle assessment for product eco-design.
3. The Logical Association among Eco-Design, Three Dimension Benefits and Resources Flow Cost
3.1. The Mechanism of the Eco-Design with Products Resource, Economic and Environmental Benefits
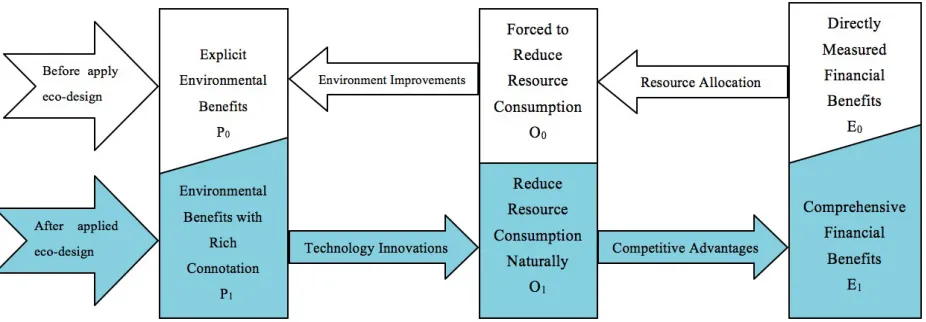
Before apply product eco-design, the benefits that heavily rely on terminal controls are mainly reflected as explicit environmental benefits which can be direct measured as the effects of enterprise’s pollution control, denoted as P0. After the implementation of eco-design, the
connotation of environmental benefits extends, mainly embodies a wide range of indicators available in corporate environmental management systems and eco-design strategy for the enterprise to improve the eco-efficiency of pollution prevention, which is denoted by P1;
constraints by material resources, the condition that enterprise is forced to reduce resource consumption is noted as O0, after technological innovation and dynamic adjustment of resource
savings arranged by eco-design naturally saving resource as O1; E0 stands for the economic
effects that only include simple financial indicators that measure corporate value and operating results before ecological design, applied products eco-design E1 goes further by adding
Thus enterprises achieve ideal condition of all three dimensions, namely resource efficiency, economic efficiency and environmental benefits. The effects of applying eco-design are shown in Figure 1.
Figure 1. Mechanistic model of eco-design and products resources, economic and environmental benefits
3.2. The Mechanism between Ecological Design and Resource Value Flow
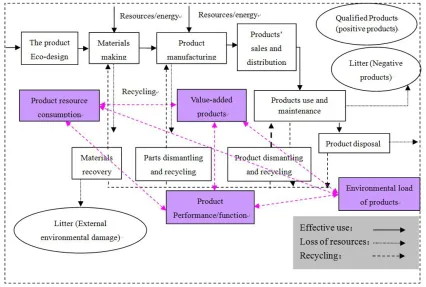
In eco-design, consumers and stakeholders increasingly require high standards of environmental performance for products, in addition to their basic functions or quality. Enterprisers must consider the use value of a product (its function,) its market value (cost,) and environmental value (external costs). Therefore, its resources flow extends forward from the design stage, but also back from the product's use, recycling and disposal stages. The resources flow route is shown in Figure 2.
As shown in Figure 2, the resource flow route of eco-designed products differs from the single linear material flow route of traditional product design. The former can form an interactive flow route for resource recycling, which covers manufacture, sales, product use, recycle and waste disposal stages. At the same time, with the constant change of resource flow route, the resource value will form a cyclical resource value flow defined by a positive interaction between eco-design and resource value flow, promoting the continuous optimization of resource value flow. The logical association between ecological design and resource value flow is shown in Figure 3.
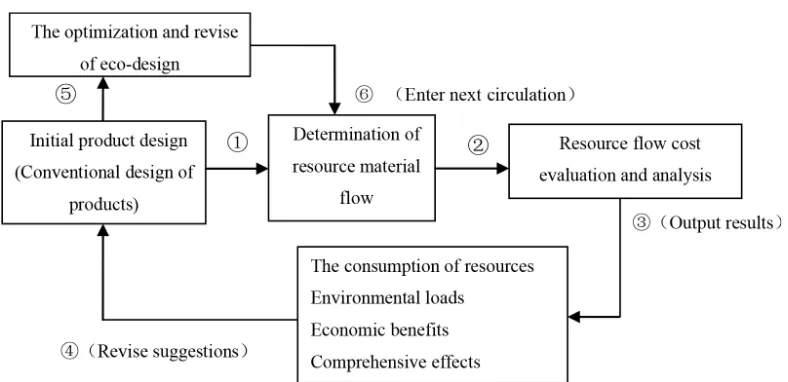
Figure 3. The logical correlation between the ecological design and resource flow cost
As depicted in Figure 3, the logical start of the interaction between ecological design and resource value stream is the initial product design, which determines initial material flow routes of the products in processes like R & D, manufacturing, sales, utilization, maintenance and recycling disposal. According to the material flow route and product life cycle assessment model, it can be revealed that the resource consumption, the loss of the transfer cost of resources and environmental impact condition during the product lifecycle process, these analysis help enterprises to optimize or revise initial ecological design decisions and to enter the next round of eco-design (stage ⑤). New eco-design will lead to changes in new material flow routes, and meanwhile its value flow. Analysis and evaluation on optimized resource value flow can reveal its improvements of resource efficiency, economic and environmental effects, and find out eco-design potential in production processes and technological process. Thus optimized control measures of resource value can be introduced into next round of eco-design.
design and resource value stream, ecological design can be improved continuously, and give impetus to optimizing the product resource material flow and value stream. Which becomes a spiraling a virtuous cycle, as well as improvements of products’ usage, market and environmental value.
4. Construction of Factors Analysis Model of Resource Value Stream in Product Life Cycle Based on Eco-Design
4.1. Evaluation and Analysis Model of Total Factor
Figure 4 shows the interactive relationship among resource/energy consumption, economic value and environmental load. It is obvious that in the life cycle process of a product, the first step is to determine the production and use patterns through product design. Accompanied by resources and energy, the magnitude of the material and value for a product will be altered in various stages. Apart from some resources lost in the production and sales stages, most of the material is transformed into a new form of resources - completed goods, ready for consumption. As time passes, some parts go through a recycling system at the end of the product's life cycle, and other parts are abandoned. There will always exist the consumption of resources and energy and emissions of waste during the entire process of production, sales, use and recycling, all of which affect the environment.
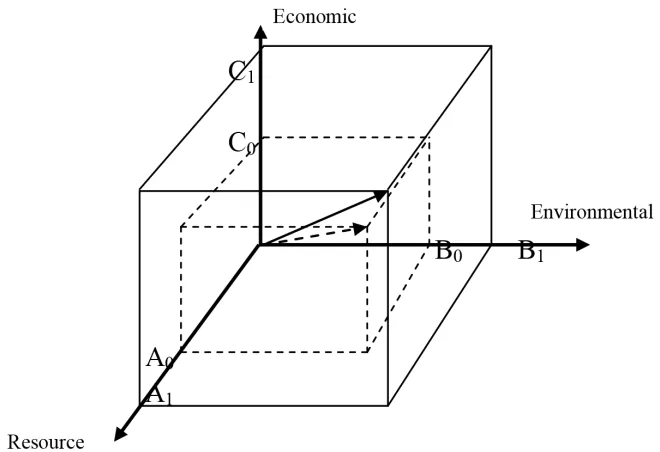
To deconstruct the logical relationship among resource/energy consumption, economic value and environmental load, it is necessary to give a reasonable evaluation and analysis on the resource value stream in a product’s life cycle process. Follow the idea of IPAT equation promoted by Chertow (2001, 2008) that environmental impact (I) can be presented as the continued product of population (P), affluence (A) and technology (T). It can be illustrated by Figure 5 that the resource value analysis of the whole life cycle of products based on the eco-design flow evaluation not only can be assessed in either product resources, economic, or environmental aspects of evaluation, but also by a factor combines comprehensive linkages of three dimensions. Equations (3) and (4).
Figure 5. The total factor evaluation principle of resource value flow of product life cycle
PEi PRi=
PVi PRix
PAVi PVi x
PEi
PAVi (3)
PRELi=PRIixPEIixPEEi (4)
In Equation (3) PEi is the environmental load of a product, which generally is the overall waste emissions of the product’s life cycle, the economic assessment value of the environmental impact of a product; PRi is the resource consumption of product i; PVi is the value of product i;
Resulting from the equations above, the environmental load ratio of unit product’s resource consumption can be resolved into a continued product of its resource efficiency, economic efficiency and environmental efficiency. This model analyzes a mutual association and quantitative relationship of resource consumption (resource efficiency), environmental impact (environmental efficiency), and economic benefits (economic efficiency), in the product’s life cycle process. This further refines the analysis object into solid waste, CO2, SO2 emissions and
so forth, replaces equation factors appropriately and dissects the logical relationship between the three factors from different angles.
4.2. Evaluation and Analysis Model for Environmental Efficiency
Researchers generally define environmental efficiency as the ratio of the value of a product or service and its environmental load. If analyzing the relative environmental efficiency of a product or whole categories of products from the product life cycle perspective, environmental efficiency of products can be used as such: Environmental efficiency = environmental load of product / added value of product as given by Equation (5), where PEEi is the environmental efficiency of products i; PEi is the environmental load of products i; PAVi is the added value of products i, and economic value added or industrial added value is generally used to represent the meanings.
PEEi= PEi
PAVi (5)
The evaluation value of environmental efficiency varies from before a product’s eco-design or eco-design optimization to after. In order to evaluate and analyze the differences between these points, this paper obtains the relative environmental efficiency of a product by comparing environmental efficiency in a reporting period containing, i.e. X multiple evaluation factors of a product is as in Equation (2).
Assuming PEE0, PE0, PAV0 are the environmental efficiency, environmental load, and added
value of product in base period, respectively; assuming PEE1, PE1, PAV1 are the environmental
efficiency, environmental load, and added value of product in reporting period, shown in Equation (6), where X means X multiple evaluation factors of a product, which are the environmental efficiency ratio before and after product eco-design; Xpav is the value coefficient of the product; and Xpe is the reduce coefficient of the environmental impact of the product.
X=PEE1/PEE0= PE1
PAV1/
PE0
PAV0=
PE1xPAV0
PE0xPAV1=
PE1
PE0x
PAV0
PAV1=
PAV0
PAV1x
PE1
PE0
=1/
(
PAV1PAV0
)
x1/(
PE0
PE1
)
=1/(
Xpav)
x(
Xpe)
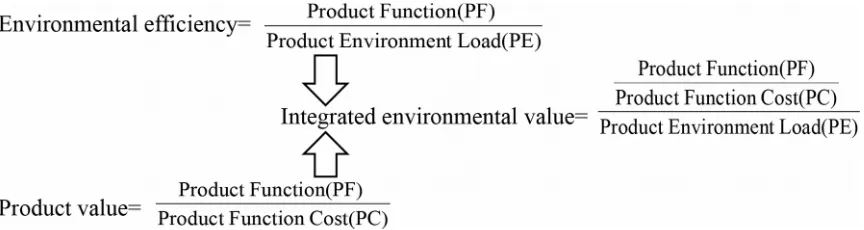
Factor evaluation can be referred to the year by year comparison change of environmental efficiency, based on the actual production model through a quantitative evaluation of the data of the environmental value of the product in the full life cycle, thus become a very competitive green management evaluation tool of enterprises, which purpose is to help customers improving sustainable product and social responsibility awareness, in addition, evaluation factors can also prove the concept of environmental efficiency with respect to the potential advantage of the competitive market analysis by product eco-design and life cycle assessment. Factor evaluation can be used to evaluate and analyze the product before or after eco-design (or optimization) value of the product as well as the improvement of product environmental impact by the above formula. However, it is still unable to reflect the logical relationship among product function, the value of the product and the product environment load, which is eco-design need to focus on three core factors to consider. Therefore, by absorbing the value engineering principles, improvements of the evaluation of Factor X Factor can be realized. The relationship among product function, the value of the product and the product environment load is defined as the integrated value of the production environment. As shown in Figure 6.
Figure 6. The concept of products environmental integrated value
To enhance the environmental values, we must enhance product performance, and reduce costs and environmental impact performance to achieve eco-design goals. By considering a product’s integrated environmental value as a combination of the accounting method for X
multiple evaluation factors, Equation (7) is obtained, where PEE'i is the improved environmental efficiency of product i; PVi is the value of product i; PFi is the product performance of product i; PEi is the environmental load of product i; and PCi is the resources flow and environmental damage cost caused by functions of product i.
PEEi'
=PVi/PEi=PFi/
(
PcixPEi)
(7)Informed by annual variations of a product’s environmental efficiency, an improved X multiple evaluation factors can be formed, where it is possible to assess any changes in the comprehensive value of products, as expressed by Equation (8), where X' is the improved X
coefficient of the function cost of a product; and Xpe is the reduction coefficient of the environmental impact of a product.
X' =PEE1
'
PEEi'=
PF1/
(
PC1xPE1)
PF0/(
PC0xPE0)
=PF1
PF0x
PC0
PC1x
PE0
PE1=XpfxXpcxXpe (8)
Equation (6) can be further calculated to correspond to the CO2 emissions factor of a product
throughout its life cycle, and must be refined and evaluated.
4.3. Evaluation and Analysis Model for Economic Efficiency
In this paper, economic efficiency is defined as the additional output ratio of the unit value of a product’s life cycle process. Economic efficiency of a product is the relative economic efficiency of a product or class of products for the product’s system or product life cycle analysis, namely, economic efficiency of product = the added value created by product/ product value as given by Equation (9), where PEIi is the economic efficiency of product i; PVi is the value of product i, which is the output value created by product i generally; and PAVi is the added value of product i, generally defined as the economic value added, or industrial added value.
PEIi=PAVi
PVi (9)
The evaluation value of a product’s economic efficiency varies from before the product eco-design or eco-design optimization to after. In order to facilitate evaluation and analysis of the differences before and after product eco-design, this paper compares the economic efficiency in the base period with that of the reporting period, and obtains the relative economic efficiency of a product, shown here as Y multiple evaluation factors (Equation 2a).
Product Y multiple evaluation factors=economic−efficiency of new product
economic−efficiency of old product (2a)
Assuming PEI0, PV0, PAV0 for economic efficiency, product value and the added value of product
in the base period, respectively, and PEI1, PV1, PAV1 for economic efficiency, product value and
the added value of product in the reporting period can be according to Equation (10), where Y
is Y multiples evaluation factors, namely the economic efficiency ratio before and after the product eco-design; Ypv is the value coefficient of the product; and Ypav is the coefficient of the added value of the product.
Y=PEI1/PEI0=PAV1
PV1 /
PAV0
PV0 =
PAV1xPV0
PAV0xPV1=
PAV1
PAV0x
PV0
PV1=
PAV1
PAV0x 1/
(
PV1
4.4. Evaluation and Analysis Model for Resource Efficiency
Resource efficiency is generally measured alongside resource productivity, that is, the analysis and evaluation of the efficiency of natural resources consumed by production activities. Resource productivity = economic and social development (magnitude of value) / consumption of natural resources (physical quantity), as given by Equation (11), where RPIi means the resource productivity of region or nation i; SVi is the economic and social development of region or nation i, generally indicated by GDP; and RRi is the consumption of natural resources by region or nation i.
RPIi=SVi
(
GDF)
RRi (11)
According to a product system or product’s life cycle, we can use resource productivity to analyze the relative efficiency of a product, class of products, or resources. Resource productivity (resource efficiency) of product = the value created by product / resource consumption of product, as in Equation (12), where PRIi is the resource productivity of product
i; PVi is the output value creation of product i, generally defined as the industrial output value or product value; and PRi is the resource consumption of product i.
PRIi=PVi
PRi (12)
The evaluation value of product resource efficiency is different from before product eco-design to after. To evaluate the differences before to after product eco-design, this paper compares the resource efficiency of products in a base period with that of a reporting period, as far as gains in relative resource efficiency. This is the Z multiples evaluation factor (Equation 2b).
Product Z multiple evaluation factors=resource−efficiency of new product
resource−efficiency of old product (2b)
Assuming PRI0, PV0, PR0 is resource productivity, output value creation and resource
consumption of product in base period, respectively; and assuming PRI1, PV1, PR1 is resource
productivity, output value creation and resource consumption of product in reporting period, as given by Equation (13), where Z means Z multiples evaluation factors of a product, namely the resource efficiency ratio before and after product eco-design; Zpv is the value coefficient of the product; and Zpr is the resource consumption reduction coefficient of the product.
Z=PRI1/PRI0=PV1
PR1/ PV0 PR0=
PV1xPR0 PV0xPR1=
PV1 PV0x
PR0
5. Empirical Study
Founded in 2003, the core business of T Co., Ltd., a Chinese SUV manufacturer, includes manufacturing automobile and engines, automobile molds, sheet metal parts, automobile transmissions and other key automobile parts.
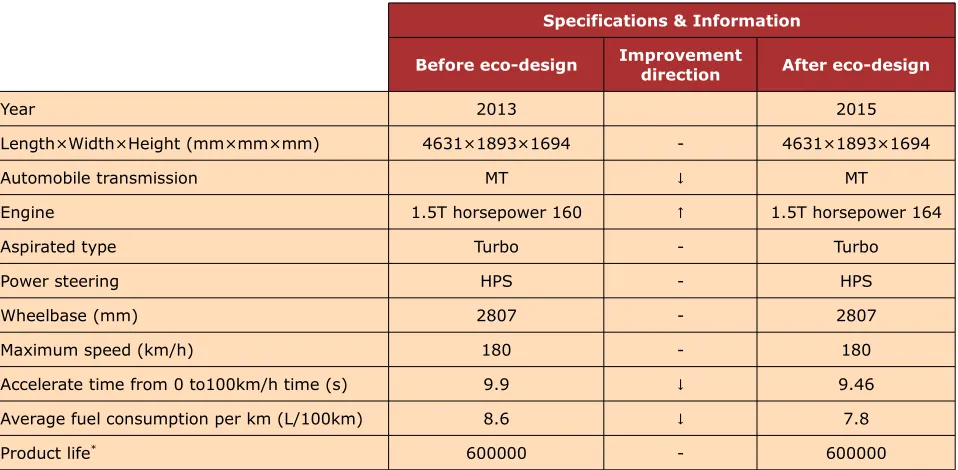
This paper chose an SUV model that experienced eco-design during the year of 2014 and used the data before/after the eco-design in 2013/2015 to verify the availability of the evaluation and analysis model presented above. Product specifications and information are as following.
Specifications & Information
Before eco-design Improvementdirection After eco-design
Year 2013 2015
Length×Width×Height (mm×mm×mm) 4631×1893×1694 - 4631×1893×1694
Automobile transmission MT ↓ MT
Engine 1.5T horsepower 160 ↑ 1.5T horsepower 164
Aspirated type Turbo - Turbo
Power steering HPS - HPS
Wheelbase (mm) 2807 - 2807
Maximum speed (km/h) 180 - 180
Accelerate time from 0 to100km/h time (s) 9.9 ↓ 9.46
Average fuel consumption per km (L/100km) 8.6 ↓ 7.8
Product life* 600000 - 600000
*According to the Mandatory retirement standards for motor vehicles published by Chinese Commerce Department in
2013, the mandatory retirement standard of private vehicles is maximum mileage 600,000 km. Available at: http://www.mofcom.gov.cn/article/b/d/201301/20130100003957.shtml
Table 1. Product specifications and information in 2013 and 2015
5.1. Basic Calculation of X and Y Factor Model
To simplify the basic calculation, suppose the product function values before/after eco-design are the same and equal to 1.
In this paper, the greenhouse gas emissions of the model during its product life cycle has been calculated and converted into equivalent CO2 emissions by SimaPro 7.0 software. Using
600,000km as a period, the CO2 emission of the type 2013 can be calculate as 11.3844×10⁷kg,
and 1.00398×10⁷kg for type 2015.Resource consumptions of each type during product life
Type 2013 Type 2015
Resource
input Re-useableresource re-useable resourcePossibly Resourceinput Re-useableresource re-useable resourcePossibly
30036.340 5743.600 26378.510 29073.330 6798.490 25755.950
Table 2. Resource consumptions of each type (CNY)
Related calculations of type 2013 are as following:
Environmental efficiency=Product life x Product function
Product environment load =0.0053
Resource consumption during product life cicle
=Resource input+Discarded resources
=Resource input x2−R e−useable resource−Possibly r e−useable resource
=CNY 27950.570
Resource efficiency=Product life x Product function Total resource consumption
= Product life x Product function
Total resource value during full product life cycle=21.47
Calculations of type 2015 are as following:
Environmental efficiency=Product life x Product function
Product environment load =0.0060
Resource consumption during product life cycle=CNY 25592.220
Resource efficiency=23.440
Thus the CO2 emission X factor of the model is 1.132 and Z factor is 1.092.
5.2. Improved Calculation and Analysis of X and Y Factor Model
As traditional factor evaluation circulation models fail to consider the relationship between product function and its costs, in this paper, an improved model are discussed based on the results of the aforementioned evaluation factors.
principle of QFD method, the customer needs and product function relationship matrix sequentially utilize 9 points, 3 points or 1 point to assess the relationship between each other. After adding up all results, the weighted ratios of the respectively product function can be determined, which denotes function characteristics and key customer needs.
Standardize the changes during eco-design and times the weighted ratios of the respectively product function, the product function value ratio between each type can be seen as Table 3.
Product function characteristics Standardization table
The weighted ratios of key customer needs Type 2013 Type 2015 Type 2013 Type 2015
Length×width×height (mm×mm×mm) 1.000 1.000 0.010 0.010
Automobile transmission 1.000 1.000 0.200 0.200
Engine 0.976 1.000 0.215 0.220
Aspirated type 1.000 1.000 0.190 0.190
Power steering 1.000 1.000 0.140 0.140
Wheelbase (mm) 1.000 1.000 0.010 0.010
Maximum speed (km/h) 1.000 1.000 0.020 0.020
Accelerate time from 0 to100km/h time (s) 0.956 1.000 0.019 0.020
Average fuel consumption per km (l/100km) 0.907 1.000 0.136 0.150
Product life* 1.000 1.000 0.040 0.040
Total 0.980 1.000
*According to the Mandatory retirement standards for motor vehicles published by Chinese Commerce Department, the
mandatory retirement standard of private vehicles is maximum mileage 600,000 km.
Table 3. the product function value ratio between type 2013 and type 2015
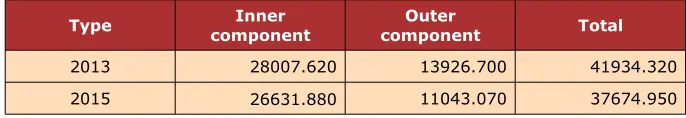
Product function costs are provided by the company as following.
Type componentInner componentOuter Total
2013 28007.620 13926.700 41934.320
2015 26631.880 11043.070 37674.950
Table 4. Costing table for type 2013 and type 2015
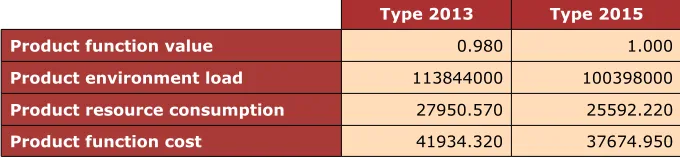
CO2 emission and resource consumptions of each type are remain the same as above
Type 2013 Type 2015
Product function value 0.980 1.000
Product environment load 113844000 100398000
Product resource consumption 27950.570 25592.220
Product function cost 41934.320 37674.950
Table 5. X factor and Z factor calculation preparation
Thus the improved CO2 emission X factor of the model is 1.288 and Z factor is 1.241. Been
compared to the result of basic analysis, the improved environmental efficiency and resource efficiency (1.132 → 1.288, 1.092 → 1.241) shows that the improved factor evaluation model can assess the environment, resource and economic efficiency factor value during the product life cycle as well as evaluate the logical relationship among each other more comprehensively, effectively and rationally.
6. Conclusions
By dissecting the internal logical relationship between a product’s eco-design and the evaluation of its resource value flow, and integrating the analysis theory of resource value flow evaluation into the entire life cycle process of the product, this paper builds an integrated factor analysis model for product life cycle management based on eco-design which combines product resource efficiency, economic efficiency and environmental efficiency. The model can not only promote the importance of resource value circulation in the overall life cycle process and analyze the mutual logical relationship of product function, value, resource consumption and environmental load, but also comprehensively evaluate and analyze material and value flow at every stage of the product life cycle process, revealing the symptoms and the potential location of different aspects, thus providing comprehensive, accurate and timely decision-making information about production and management activities enterprise managers. The empirical study shows the integrated factor analysis model can improve the evaluation by considering the logic relationship among product function, product function cost and product environment load during its life cycle.
Acknowledgments
I would like to thank Prof. Ling Zheng, Prof. Xu Xiao and all the seminar participants at Central South University for their valuable comments and discussions. I also appreciate the two anonymous responders who provided much sound advice on this paper. I’d like to extend my thanks to my wife for her work grammar-checking and editing this paper. All remaining errors are my own.
This research work was supported by the National Natural Science Funds of China (No.71303263), the Humanities and Social Sciences Program Fund of Ministry of Education (No.11YJC790312), the Doctoral Fund of Ministry of Education (No.20130162120045), the Major Program of the National Social Science Fund of China (No.11&ZD166), the Key Project of Philosophy and Social Sciences Research of Ministry of Education (No.13JZD0016), The Energy-saving and Emission Reduction Demonstration Project of Changsha City (No. CSCG-HNSZ-DY20131002, Procurement of [2013D]0012 -1 Changsha Finance), The Social Sciences Program Fund of Hunan Province (13YBA353), The Soft Science Program of Hunan Province(2014ZK3124).
References
Aoe, T. (2006). Eco-Efficiency (Factor X) for Electrical and Electronic Products and a Case Study on Home Appliances in a Household. Materials Transactions, 47, 913-922. http://dx.doi.org/10.2320/matertrans.47.913
Aoe, T. (2007). Eco-efficiency and ecodesign in electrical and electronic products. Journal of Cleaner Production, 15, 1406-1414. http://dx.doi.org/10.1016/j.jclepro.2006.06.004
Bhander, G., Hauschild, M., & McAloone, T. (2003). Implementing life cycle assessment in product development. Environmental Progress and Sustainable Energy, 22, 255-267. http://dx.doi.org/10.1002/ep.670220414
Chertow, M.R. (2001).The IPAt equation and its variants; changing views of technology and environmental impact. Journal of Industrial Ecology, 4, 13-29.
http://dx.doi.org/10.1162/10881980052541927
COM (2003). Communication from the Commission to the Council and the European Parliament-Integrated Product Policy-Building on Environmental Life-Cycle Thinking /*COM/2003/0302 final*/. Available at: http://eur-lex.europa.eu/legal-content/EN/TXT/HTML/? uri=CELEX:52003DC0302&from=EN
Graedel, T.E., Allenby, B.R., & Comrie, P.R. (1995). Matrix approaches to abridged life cycle assessment. Environmental Science & Technology, 29, 134-142.
Jeganova, J. (2004). Product Life Cycle design: integrating environmental aspects into product design and development process at Alfa Laval. MSc Thesis. Lund University Sweden.
Jonsson, A., & Svensson, T., (1997). Life cycle assessment of flooring materials: case study.
Building and Environment, 32, 245-255. http://dx.doi.org/10.1016/S0360-1323(96)00052-2
Muñoz, I., Rodríguez, A., Rosal, R., & Fernández-Alba, A.R., (2009). Life Cycle Assessment of urban wastewater reuse with ozonation as tertiary treatment: A focus on toxicity-related impacts. Science of Total Environment, 407, 1245-1256.
http://dx.doi.org/10.1016/j.scitotenv.2008.09.029
Ortiz, M., Raluy, R.G., & Serra, L. (2007). Life cycle assessment of water treatment technologies: Waste water and water- reuse in small town. Desalination, 204, 121-131. http://dx.doi.org/10.1016/j.desal.2006.04.026
Renou, S., Thomas, J.S., Aoustin, E., & Pons, M.N. (2008). Influence of impact assessment methods in waste water treatment LCA. Journal of Cleaner Production, 16, 1098-1105. http://dx.doi.org/10.1016/j.jclepro.2007.06.003
Sakao, T. (2007). A QFD-centred design methodology for environmentally conscious product design. International Journal of Production Research, 45, 4143-4162. http://dx.doi.org/10.1080/00207540701450179
Spengler, T., Geldermann, J., Hahre, S.H., Sieverdingbeck, A., & Rentz, O., (1998). Development of a multiple criteria based decision support system for environmental assessment of recycling measures in the iron and steel making industry. Journal of Cleaner Production, 6, 37-52. http://dx.doi.org/10.1016/S0959-6526(97)00048-6
Takahashi, T.(2005). Evaluation methods and Applications of Factor X Indicator for Realization of a Sustainable Society. Fourth International Symp. on EcoDesign 2005: Environmentally Conscious Design and Inverse Manufacturing. Tokyo, 770-774. http://dx.doi.org/10.1109/ecodim.2005.1619347
Xiong, F., Xiao, X., Chen, X., & Zhou, Z. (2015). The Path Optimization of Chinese Aluminum Corporation for Circular Economy Strategy Based on Resource Value Flow Model: A Case Study of CHINALCO. Environmental Engineering and Management Journal, 14(8), 1923-1932. Yamamoto, R. (1999). Eco-Design Best Practice 100. Diamond, Inc. 55 (in Japanese).
Yamamoto, R., & Wang, T., (2003). The strategic environmental management for ecological design - example 100. Chemical Industry Press, 165-169 (in Chinese).
Zhou, Z. (2014). On Evaluation Model of Green Technology Innovation Capability of Pulp and Paper Enterprise Based on Support Vector Machines. Advanced Materials Research, 886 285-288. http://dx.doi.org/10.4028/www.scientific.net/amr.886.285
Zhou, Z., Chen, X., & Xiao, X. (2013a). On evaluation model of circular economy for iron and steel enterprise based on support vector machines with heuristic algorithm for tuning hyperparameters. Applied Mathematics & Information Sciences, 7, 2215-2223. http://dx.doi.org/10.12785/amis/070611
Zhou, Z., Chen, X., Xiao, X., & Xiong, F. (2013b). A comprehensive evaluation indicators system of sustainable consumption and production in the iron and steel industry: a field study in baosteel. Metalurgia International, 18, 119-129.
Journal of Industrial Engineering and Management, 2016 (www.jiem.org)
Article's contents are provided on an Attribution-Non Commercial 3.0 Creative commons license. Readers are allowed to copy, distribute and communicate article's contents, provided the author's and Journal of Industrial Engineering and Management's names are included.