13
Beyond the First Year Experience in
Science: Identifying the Need for a
Supportive Learning and Teaching
Environment for Second Year Science
Students
Wendy A. Loughlina, Sarah-Jane Gregorya, Glenn Harrisonb and Jason M. Lodgec
Corresponding author: [email protected] a
School of Biomolecular and Physical Sciences, Griffith University, Nathan, Brisbane, QLD 4111, Australia b
Teaching and Learning Development, James Cook University, Townsville QLD 4811, Australia c
Griffith Institute for Higher Education, Griffith University, Mt Gravatt QLD 4122, Australia
Keywords: second year slump, bioscience education, student lifecycle, student transition International Journal of Innovation in Science and Mathematics Education, 21(4), 13-26, 2013
Abstract
The Second Year (sophomore) Slump is a well-defined phenomenon affecting American undergraduate students in the middle years of their degree. In the Australian context, minimal attention has been given to identifying or addressing potential concerns with the transition and satisfaction of students beyond their first year of study in science degrees. A case study of second year students (n = 165) studying a bioscience course is presented. Potential student demographic factors, including low social economic status, non-English speaking background, first in family to attend University (>60%), and Grade Point Average (GPA) progression, were examined. An academic slump based on GPA trend of a decrease of GPA greater than 0.35 was observed for 33% of the student cohort, irrespective of their program of study or background. We surveyed the second year students to identify their concerns in this year of study and their preferences for various support activities. The survey indicated that academic workload/expectations and work experience were of most concern to students. The survey results were considered in the context of an institutional focus on strategies to enhance student engagement and retention throughout the student lifecycle. We propose that a strategic design approach, with alignment between curricular and co-curricular activities, is more likely to have success in enabling science academic staff to engage and support second year students.
Introduction
14
commitment to a specialised area of study is made, including a choice of discipline area (major) in the sciences, and thus has a significant impact on future career directions of students. Targeted initiatives to turn the slump experience around and improve retention rates at second year have been implemented in universities within the United States (Tobolowsky, 2008; Burke, 2007). These initiatives focus on providing social and professional networking opportunities, leadership and seminar series for student development (Hanover, 2009; Gahagan & Hunter, 2006).
In the tertiary education sector, both in Australian and international contexts, the last twenty years has seen significant change from an elite system to a mass system, generating considerably wider participation in higher education. The Review of Australian Higher Education Report (Bradley, Noonan, Nugent, & Scales, 2009) highlighted the need for wider participation and increased participation of groups, such as low socio-economic status students. Student diversity has increased as a consequence of the increase in numbers of students studying for a tertiary qualification. Student engagement issues have been highlighted as a consequence of the increase in diversity of the student population and increased wider participation over the past decade (Coates, 2008; Lawrence, 2005). In conjunction with an Australian Government policy that included a commitment to first year students as a core area of strategic planning (DEEWR, 2009), universities have focused recently on institutional strategies to enhance student engagement and retention, primarily at the first year level (Kift, Nelson, & Clarke, 2010). There are few studies on student engagement at the second year level, but correlations between the Second Year (sophomore) slump in the American university system and the corresponding stage in the Australian university system are starting to emerge (McBurnie, Campbell & West 2012; Harrison & Gregory, 2012; Gregory & McDonnell, 2012; Quinlivan, 2010; Harrison, 2007).
There is a declining trend in qualified graduates and professionals in science and technology within Australia (Australian Council of Deans of Science, 2003; Dobson, 2003; Australian Council of Deans of Science, 2001; McInnis, Hartley & Anderson, 2000) and a lack of student interest in science (Harris, Jensz & Baldwin, 2005). Given these trends, it is critical to retain science students that are attracted to science study and graduate scientists. Australian higher education government priorities indicate a need to sustain and enhance scientific programs and produce science graduates (Office of the Chief Scientist, 2012). Current initiatives within Australia aim to stimulate renewed interest in the study of science through curriculum-based activities within the science discipline area (Jones & Yates, 2011; Johnstone, 2007). In addition, alignment between curriculum and co-curricular activities has been shown to be pivotal to the holistic experience of students throughout their higher education studies (Tinto, 1998).
Purpose of the study
15
presented in relation to these pre-second year student demographics. This study also aims to identify effective strategies to enhance student engagement and persistence in second year.
Methodology
Course context
The student sample was drawn from within a single second year course (unit of study/subject) in the bioscience area that was listed in second year of the degree program structures of science, bioscience, medical science and forensic science degrees offered at Griffith University (Nathan campus). The second year bioscience course (Metabolism) is theory based and comprised of lectures to explain and discuss concepts based on knowledge of scientific content in the bioscience area together with workshops to provide active engagement and participation in the learning processes required to gain a thorough understanding of the course material and content. The structure of the course has been shown to support student learning (Gregory & Cock, 2012). The course received strong results on the compulsory university student evaluation of course survey at the end of the semester of offer (semester 1, 2012) with an overall satisfaction rating, consistent with previous years, of 4.3 out of 5 (49% response rate of students enrolled). Within their second year, students in this course could be enrolled in different degree programs (see below) with different entry requirements.
Participants
Within the second year bioscience course, 175 students were enrolled. For all the students, data was de-identified prior to analysis. The data was clustered by student background type; Low Socio-Economic Status (SES), Non-English Speaking Background (NESB), and GPA ≥4 prior to enrolment in the course and GPA < 4 prior to enrolment in the course, where a GPA of 4 represents obtaining an average of a passing grade in each semester of study. Further data was obtained from degree entry data; First in Family, Primary Carer and Primary Income Earner. Students enrolled in the course comprised two sub-cohorts: those students who were progressing directly into a second year course after completing one full year of study (second year students); and students who were progressing into the second year course/subject after completing more than one year of university or credit bearing study (second year plus students). Students were typically taking the required course load (40CP, 4 courses over 1 semester) for the semester of study in their degree program, which included the 10CP second year bioscience course. At census date (end of week 4 of a 13 week semester), 10 students (representing 6% of the cohort) had withdrawn or dropped their enrolment, and thus their data were not included in the detailed analysis of the study.
Survey design and survey data collection
16
identify the level of student concern about their second year. The responses were ranked on a ten-point Likert rating scale from Very Much (10) through to Not at All (1).
Q1. How much do you worry about what 2nd year will be like?
1 2 3 4 5 6 7 8 9 10
Q2. I am concerned about the following aspects of 2nd year university:
(SD = strongly disagree, D=disagree, N=neutral, A=agree, SA=strongly agree)
SD D N A SA
Academic workload 1 2 3 4 5
Academic expectations 1 2 3 4 5
Timetabling 1 2 3 4 5
Personal development (leadership skills, confidence etc.) 1 2 3 4 5
University social life 1 2 3 4 5
Balancing my job with my university studies 1 2 3 4 5
How the content of 2nd year will help my career 1 2 3 4 5
How to gain work experience before I graduate 1 2 3 4 5
Other 1 2 3 4 5
Q3. Would you participate in any of the following activities if they were offered during your 2nd Year?
Content refresher course revising key 1st year concepts pertaining to 2nd year courses ( NOTE: If you have chosen this activity, then in which Week of Semester 1 of 2nd Year would you like to have the refresher course run? (Please Answer Here:
...Week...)
Effective study strategies course ( NOTE: If you have chosen this activity, then in which Week of Semester 1 of 2nd Year would you like to have the effective study strategies course run? (Please Answer Here: ...Week...)
Exam strategies revision
Social activities throughout year (please provide examples of activity type and timing below)
Examples:... Career information opportunities
Opportunities to hear about the research that your lecturers undertake (chat session, podcast, other)
Opportunities to hear from science professionals (chat session, podcast, other) Opportunities to hear from Alumni about their coping strategies, employability Learning how to better balance university with work and life
Work experience opportunities related to your discipline
Development/presentation workshop on professional resume writing Allocation to informal study groups
Peer mentors specifically for 2nd year students
Common time in 1st semester for students in the same program
Q4. Do you have any other suggestions of activities that you feel would enhance your ability to succeed in 2nd year?
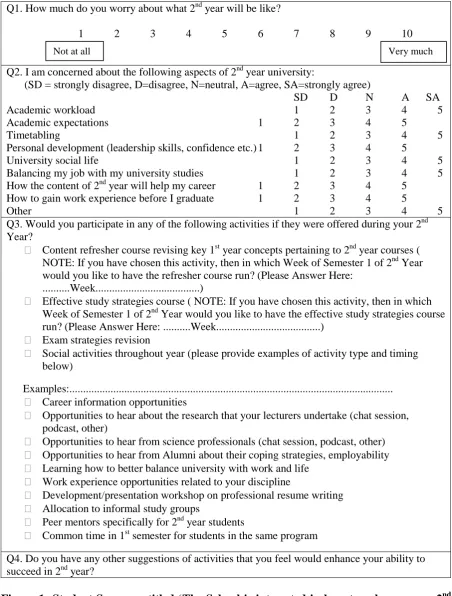
Figure 1:Student Survey entitled ‘The School is interested in how to enhance your 2nd year university experience’
17
Question 2 shows the questions (ranked from strongly agree (5) to strongly disagree (1)) that students were asked when evaluating their perceptions of second year of university. Question 3 sought student feedback on initiatives that they considered would support them in their second year studies. Students were also given the opportunity to respond to an open ended question about success in 2nd year. The survey results were tabulated into Microsoft Excel™
for processing and are presented in the Results section.
De-identified student data collection and analysis
For each de-identified student, their background (demographics) data were identified as (i) program enrolled in, (ii) low SES status, and (iii) NESB. The de-identified academic records were used to calculate the GPA prior to enrolment in the second year course. GPA has been shown to correlate with susceptibility to slump in second year cohorts (Quinlivan, 2010). The GPA values were then ranked as (i) GPA ≥4 prior to enrolment in the course and (ii) GPA < 4 prior to enrolment in the course. In addition, the GPA for the semester of this study (semester 1, 2012) was calculated. The de-identified academic records were also examined for the courses and course load studied prior to enrolment in the second year course and for semester 1, 2012 to establish whether the student was a full time second year student (completed 80CP/8 first year courses) or had withdrawn or dropped enrolment in their first year. All student data was recorded in a de-identified manner and then grouped according to the number of students by degree and by category (e.g. low SES, NESB) for the purposes of this study.
For each degree cohort represented in the course, the anonymous Starting@Griffith Survey (Griffith University) data for 2011 (the year that the study participants commenced their studies) was used to identify student backgrounds as (i) First in Family, (ii) Primary Carer and (iii) Primary Income Earner. The degree programs were categorised as follows on the basis of entry requirements and discipline area where very high entry requirements is equivalent to an Overall Position (OP) of 1 or Australian Tertiary Admissions Rank (ATAR) of 99 and lower entry requirements equivalent to an OP of 16 or ATAR of 67: Program type A (Biomedical Science, high entry requirements, 62 students); Program type B (Science, lower entry requirements, 45 students); Program type C (Forensic Science, moderate entry requirements, 34 students) and Program type D (Medical Science, very high entry requirements, 34 students). All the above student data was tabulated into Microsoft Excel™ for processing and analysis.
18
Results
Evaluation of student background on academic progression in semester 1 of Year 2
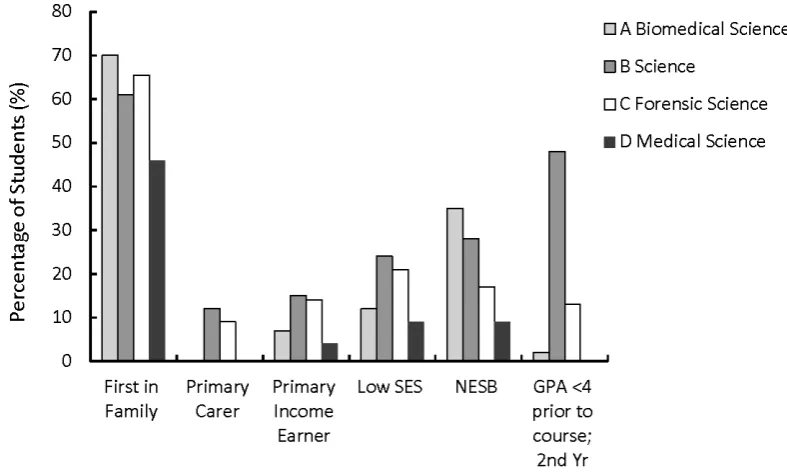
Figure 2 shows the breakdown of the background of second year student (124 students) in each category (Low SES, NESB, First in Family, Primary Carer, Primary Income Earner, GPA < 4 prior to enrolment in the course)aggregated by Program type (type A-D) and expressed as a percentage of the total second year student cohort. The results indicate that a high percentage (> 60%) of students are First in Family students and are in degree programs with high to lower entry standards (A-C).
Figure 2: Background demographics of second year students (n = 165) enrolled in Bioscience course (prior to enrolment in second year Bioscience course/unit expressed as percentage of the students with that background (First in Family to enter University, Primary Carer, Primary Income Earner, Low Socio-Economic Status (SES), Non-English Speaking Background (NESB) and Grade Point Average (GPA) prior to second year) and by enrolment in degree program (A, Biomedical Science; B, Science; C, Forensic Science; D, Medical Science)
Higher percentages of students that were primary carers, primary income earners, and from low SES backgrounds were enrolled in the programs with moderate and lower entry standards (Type B and C; Science, Forensic Science). Notably, the ‘type B Science’ programs had students with the poorest academic capital entering into second year, with 48% of students having a GPA <4 prior to starting their second year course. Students that were in the NESB category were enrolled in higher percentages in the type A Bioscience (35%) and type B Science (28%) programs. By contrast, students in the type D Medical Science program (which has a very high entry standard) had the lowest First in Family percentage of 45%. This is still high compared to the 31% average for domestic students at Australian universities (James, Krause & Jennings, 2010). Students in the type D Medical Science program also had the lowest representation of Primary carer (0%), Primary Income earner (4%), Low SES and NESB (9%) as compared to students in the other programs (type A-C), and the strongest academic capital entering into second year (100% with GPA ≥4).
19
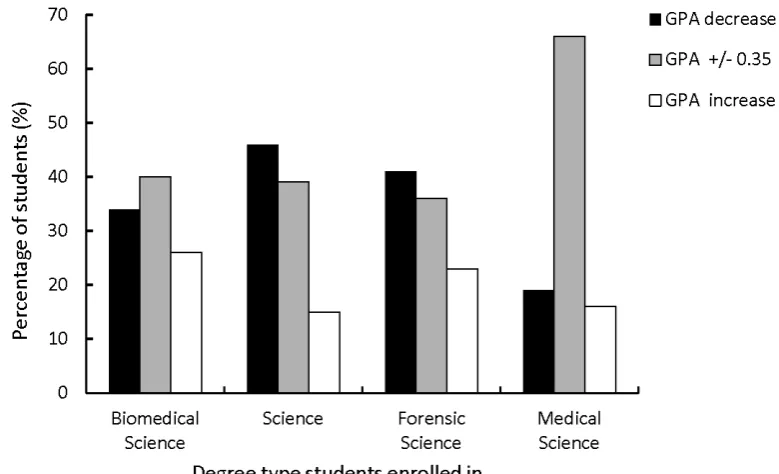
semester of study for second year students, having already studied one year at University. The clustered data were organised into a GPA deviation of +/- 0.35 or a GPA deviation within 0.35 and separated into academic capital entering into second year (GPA < 4 or GPA ≥4). The students (16 students; 13% of cohort) with poor academic capital (GPA < 4 prior) generally maintained their grades, albeit often poor ones. A decrease of GPA > 0.35 was observed for the programs with moderate and lower entry standards (Type B and C; Science, Forensic Science). Only one program (Type C, Science) showed an increase of GPA >0.35: no students with a GPA < 4 prior were from the type D Medical Science Program.
Figure 3: Percentage of students with a GPA increase > 0.35, GPA +/- 0.35 or GPA decrease > 0.35 by program type for second year students (n = 108 students) with a prior GPA >4
The students with good academic capital (GPA >4 prior) represented 87% of the second year cohort. These students improved their performance (between 15-26%), maintained their performance (36-66%) and decreased (GPA decrease of > 0.35) their performance, irrespective of their entry requirements or student backgrounds (e.g. 19% in Medical Science, Figure 3). Overall, in the second year only cohort (124 students), 41 students representing 33% of the cohort had a decrease of > 0.35 in their GPA.
The GPA analysis was extended to students who were beyond their first semester of second year studies (40 ‘second year plus’ students), generally due to due to poor academic performance. Of the second year plus students, 40% had an increase of GPA > 0.35, 28% had a GPA within ± 0.35 and 33% had a decrease of GPA > 0.35 (identical to the second year only cohort).
Student perceptions of second year
20
Figure 4:Survey responses (n = 80) expressed as a percentage indicating level of worry of survey respondents regarding second year of study
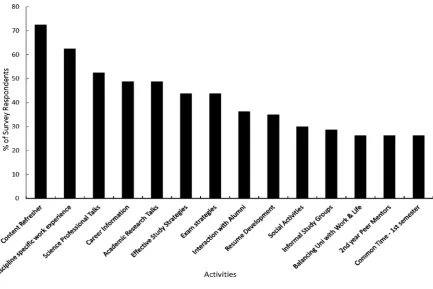
Student responses to questions that asked what aspects of second year they were most concerned with indicated that their greatest concerns related to academic workload (82%), academic expectations (71%), how to gain work experience (55%), whether second year content will help with their career (53%), and balancing a job with study (45%) (Figure 5). These responses were linked back to the students program of study if provided on the survey. Comparison of the clustered data responses about balancing a job with study with the degree program type (A-D) that students were enrolled in indicated the following general observation. Students experiencing a high level of concern about balancing a job with study (4-5 on the scale, 40-56% of the student program cohort from the survey responses) were typically from Type A, B and C programs (with lower to moderate entry standards) and were reflective of the higher percentages of Primary Income earner and low SES background categories of these programs. Students enrolled in the Type D Medical Science program showed low concern about balancing a job with study (1-2 on the scale, 72% of the student program cohort).
21
Figure 5:Survey responses (n = 80) regarding concerns of second year students in their second year of study
22
The final open ended question of the survey asked for suggestions of activities that students would enhance their ability to succeed in second year. There was a very poor response to this question (n=6) and thus no analysis was carried out. In addition to the student responses above, ad hock feedback was sought from staff at a school meeting and through general discussions. The primary concern of staff was the impact on academic workload in the context of balancing a teaching and research academic profile.
Discussion
A case study of a cohort of second year bioscience students was examined, where potential student demographic factors involved in sophomore slump; such as low SES, NESB, First in Family to attend University, Grade Point Average progression, were identified. Some of the challenges First in Family students may face beyond first year and into the second year of their studies include, doubting their ability to study at a more advanced tertiary level, finding a balance between family commitments, work commitments and study and having family members not approving/supporting University studies (Pike & Kuh, 2005).
A student survey (80 responses from 175 students) established the level of concern of 46% of the student cohort early in their second year of study. The second year bioscience course at Griffith University presents an interesting case study of student diversity under the Bradley agenda (Bradley, Noonan, Nugent, & Scales, 2009) of wider participation and increased participation of groups such as low socio-economic status students. The survey was run very early in semester, when students had attended some lectures but not workshops or laboratories in other courses. This may account for the high percentage of students in the middle category of ‘some concern’, and who may have a developing understanding of the expectations and requirements for second year at the time of the survey. In the survey, students were given the option to identify which program they were enrolled in. Of responses, only 52 students declared their program (29% of the total cohort). Due to the lower program identification rate, only a general observation was made. Students experiencing a strong level of concern (8-10 on the scale) were typically from Type A, C and D, the programs with moderate to very high entry standards, however some level of concern was observed across all program types.
The data clearly show that at this stage of their degree studies, many second year students are concerned with academic engagement, career exploration and, to a lesser extent, with balancing extracurricular pressures (such as work) with study. The students reported that they would respond to initiatives aimed at improving academic engagement, student-staff-industry interactions, and career exploration, and to a lesser extent, social activities. These observations echo key aspects of the sophomore slump phenomenon reported at American colleges, where second year students often struggle with self-confidence, autonomy and academic commitment (Schreiner, 2010; Graunke & Woosley, 2005).
Collaboration between curriculum and co-curricular activities: A proposal
23
curriculum and co-curricular activities occurs at the second year (and above) level, is more likely to have success in enabling academic staff to engage and support science students with the best possible learning experiences and outcomes during the student’s scientific education. The need for synergies between curriculum and co-curricular activities also has been shown to be pivotal to the holistic student experience of higher education overseas and indeed student persistence (Tinto, 1998). To this end, this study has been following guidance to address this issue, provided by Wenger et al. (2002), on the principles and development of communities of practice (COP) coupled with the academic theory of Becher and Trowler (2001) that concerns in the academic community are reflecting on academics research interests as well as their teaching patterns.
So what is the way forward? At the curriculum level, academic staff could design (re-design) curriculum and learning environments across the student lifecycle and use the Threshold Learning Outcomes (TLO’s) (Jones & Yates, 2011) that are being introduced into Australian universities as opportunities to engage second year students. A holistic degree program view could be considered in which the second year experience is developed as an ‘enabling year’ that compliments and extends the transitional initiatives of the first year experience, and looks forward to the career and work focus of students as well as support through academic activities such as content refreshers during second year. Content refreshers could take the guise of allocated ‘help sessions’ during semester, which replace selected tutorials or workshops, or self-paced support resources such as online writing tutorials. Initial co-curricular activities that encompass social, networking and career activities may include, for example, dodgeball games in the gym, networking lunches with staff and second year students, a careers website with separate sections addressing different year group levels and a career night that starts collectively (Years 1-3) and then splits out into different year levels with appropriate direct information.Successful integration of co-curricular activities requires support from key stakeholders in the institution (such as careers and employments services) and willingness to adapt and create new partnerships with existing stakeholders in an institution. As a step forward, a community of practice -a group of interested academics who share a concern for second year students (Zimitat, 2007) – called the Second
Year COP, has been recently established for Science at Griffith University to focus on
investigating both how core issues of student experience specifically affect second year students and how to better address these within curriculum offerings. The COP approach allows gaps in support for second year students to be identified and new initiatives to be developed. It provides a forum for discussion on issues that are broader than just curriculum which affect student outcomes, a forum for enhancing staff awareness of issues for second year students, and a forum for the development of a strategic design approach to alignment of curriculum and co-curricular activities.
Conclusions
24
core issues of student experience and how to better address these issues within curriculum and co-curriculum offerings to engage and support science students. A focus on second year curriculum and teaching is important in the context of engaging students in science as a career, and timely as Australian Universities consolidate and scrutinise their threshold learning outcomes and assessment in science degree offerings under a new regulatory framework.
Acknowledgements
The authors would like to thank the support of the Griffith Institute of Higher Education for their invaluable assistance with the development of this project, Ann McDonnell for her feedback on survey design, and the mentorship of Susan Jones (University of Tasmania). This work was supported by a Griffith University Learning and Teaching Grant.
References
Australian Council of Deans of Science. (2003). Is the study of science in decline? ACDS Occasional Paper No 3.Retrieved on February 18, 2013, from http://www.acds.edu.au/occasionalpapers.html
Australian Council of Deans of Science. (2001). Why do a science degree? ACDS Occasional Paper No 2. Retrieved on February 18, 2013, from http://www.acds.edu.au/occasionalpapers.html
Anderson, E.C., & Schreiner, L.A. (2000). Advising for sophomore success. In L.A. Schreiner & J. Pattengale (Eds.). Visible solutions for invisible students: Helping sophomores succeed. (Monograph No. 31 pp. 55-65), Columbia, SC: University of South Carolina, National Resource Center for the First-Year Experience and Students in transition.
Becher, T., & Trowler, P. R. (2001). Academic Tribes and Territories, Buckingham: The Society for Research into Higher Education and Open University Press.
Bradley, D., Noonan, P., Nugent, H., & Scales, B. (2009). Review of Australian higher education: Final report.
Canberra: Department of Education, Employment and Workplace Relations. Retrieved on February 18, 2013, from
http://www.innovation.gov.au/HigherEducation/ResourcesAndPublications/ReviewOfAustralianHigher Education/Pages/ReviewOfAustralianHigherEducationReport.aspx
Burke, C., (2007). Combating the sophomore slump and decling retention rates: An experiential academic program for second year international students. Capstone Collection. Paper 790.
Coates, H. (2008). Attracting, engaging and retaining: New conversations about learning. Australasian Student Engagement Report. Camberwell: Australian Council for Educational Research. Retrieved on February 18, 2013, from http://research.acer.edu.au/ausse/16/
Department of Education, Employment and Workplace Relations (2009). An indicator framework for higher education performance funding. Retrieved on February 18, 2013, fromhttp://www.innovation.gov.au/Higher Education/Documents/HIEDPerformanceFunding.pdf
Dobson, I. (2003) Science at the crossroads? A study of trends in university science from Dawkins to now: 1989-2002, ACDS Occasional Paper. Retrieved on February 18, 2013, from
http://www.acds.edu.au/occasionalpapers.html
Freedman, M. B. (1956). The passage through college. Journal of Social Issues, 12(4), 12-28.
Gahagan, J., & Hunter, M.S. (2006). The second-year experience: Turning attention to the academy's middle children, About Campus, 11(3), 17-22.
Hunter, M.S., Tobolowsky, B.F., Gardner, J.N., Evenbeck, S.E., Pattengale, J.A., Schaller, M.A., and Schreinder, L.A. (Eds.). (2010). Helping sophomores succeed: Understanding and improving the second-year experience. San Francisco, CA: Jossey-Bass.
Graunke, S.S. & Woosley, S.A. (2005). An exploration of the factors that affect the academic success of college sophomores. College Student Journal, 39(2), 367-376.
Gregory M.S. & Cock, I. (2012). Don’t dumb it down – mix it up! Engaging and enhancing metabolism student learning capacity without dumbing down content or assessment standards. In M.Sharma and A.Yeung (Eds.), Proceedings of the Australian Conference on Science and Mathematics Education 2012, (p.19), Sydney, NSW: UniServe Science.
25
18, 2013, from http://www.sc.edu/fye/events/presentation/sit/2012/2012Handouts.html
Gump, S. (2007). Classroom research in a general education course: Exploring implications through an investigation of the Sophomore Slump, The Journal of General Education, 56(2), 105-125.
Harris, K.-L., Jensz, F. & Baldwin, G. (2005). Who’s Teaching Science? Meeting the demand for qualified science teachers in Australian Secondary Schools, ACDS Occasional Paper.Retrieved on February 18, 2013, from http://www.acds.edu.au/occasionalpapers.html
Harrison, G. (2007). Aussie Attrition - the down under experience of sophomore slump in the health sciences.
The 14th National Conference on Students in Transition, Cincinnati, Ohio; National Resource Center for First Year Experience and Students in Transition, University of South Carolina. Retrieved on February 18, 2013, from http://www.sc.edu/fye/events/presentation/sit/2007/files/14-CR.pdf
Harrison, G., & Gregory, M. S. (2012). Comparing second year student experiences across the Pacific.
Proceedings of the Australian Conference on Science and Mathematics Education: Teaching and Learning Standards: What does a standard mean to you? (p.20), Sydney, NSW: University of Sydney.
Hanover Research Report (2009). Sophomore Year Experience Programs in American Higher Education.
Retrieved on February 16, 2013, from: http://www.hanoverresearch.com/.
Hunter, M., Tobolowsky, B., Gardner, J., Evenbeck, S., Pattengale, J., Schaller, M., & Schreiner, L. (2010).
Helping sophomores succeed: understanding and improving the second-year experience. San Francisco: John Wiley and Sons.
James, R., Krause, K.-L. & Jennings, C. (2010). The First Year Experience in Australian Universities: Findings from 1994 to 2009. Centre for the Study of Higher Education, The University of Melbourne Retrieved on February 18, 2013, from http://www.cshe.unimelb.edu.au/research/experience/docs/
Johnstone, R. (2007). What's happening in science? The Carrick Institute for Learning and Teaching in Higher Education Ltd.Retrieved on February 18, 2013, from
http://www.olt.gov.au/resources?text=What%27s+happening+in+Sceince
Jones, S., & Yates, B. (2011) Science learning and teaching academic standards statement. Australian Learning and Teaching Council Limited, Retrieved on February 18, 2013, from
http://www.olt.gov.au/resources?text=Science+Learning+and+Teaching+Academic+Standards+Statement Kift, S., Nelson, K., & Clarke, J. (2010). Transition pedagogy: a third generation approach to FYE: a case study
of policy and practice for the higher education sector. The International Journal of the First Year in Higher Education, 1 (1), 1-20.
Lawrence, J. (2005) Addressing diversity in higher education: two models for facilitating student engagement and mastery. In: Proceedings of the 28th HERDSA Annual Conference: Higher Education in a Changing World, Sydney, NSW: Higher Education Research and Development Society of Australasia, Inc. Retrieved on February 18, 2013, from
http://www.herdsa.org.au/wp-content/uploads/conference/2005/papers/lawrence.pdf.
Lemons, L.J., & Richmond, D.R. (1987). A developmental perspective of sophomore slump. NASPA Journal, 24(3), 15–19.
McBurnie, J.E., Campbell, M. & West, J.M. (2012). Avoiding the second year blues: transition framework assisting student progression at Deakin University. International Journal of Innovation in Science and Mathematics Education, 20(2), 14-24.
McInnis, C., Hartley, R. & Anderson, M. (2000). What did you do with your science degree? ACDS Occasional Paper. Retrieved on February 18, 2013, from http://www.acds.edu.au/occasionalpapers.html.
Office of the Chief Scientist (2012). Mathematics, engineering and science in the national interest. Canberra: Commonwealth of Australia. Retrieved on February 18, 2013, from http://www.chiefscientist.gov.au/wp-content/uploads/Office-of-the-Chief-Scientist-MES-Report-8-May-2012.pdf.
Pike, G.R. & Kuh, G.D. (2005). First- and second-generation college students: a comparison of their engagement and intellectual development. The Journal of Higher Education, 76(3), 276-300.
Quinlivan, T. (2010). Investigating the transition process across the undergraduate degree: implementing a peer mentoring program to address the second year slump, PhD Thesis, School of Health Sciences, RMIT University, Australia.
Schreiner, L., & Pattengale, J. (Eds.). (2000). Visible solutions for invisible students: helping sophomores succeed. Monograph Series No. 31. National Resource Centre for the First Year Experience and Students in Transition, University of South Carolina.
Schreiner, L.A. (2010) Factors that contribute to Sophomore Success and Satisfaction. In Hunter, M.S., Tobolowsky, B.F., Gardner, J.N., Evenbeck, S.E., Pattengale, J.A., Scaller, M.A., & Schreiner, L.A. (Eds.), Helping sophomores succeed:Understanding and improving the second-year experience (pp.43-65). San Francisco: Jossey-Bass.
26
Tobolowsky, B. (2008). Sophomores in transition: The forgotten year. New Directions for Higher Education, 144, 59-67.
Wenger, E., McDermott, R., & Snyder, W. (2002) Cultivating Communities of Practice: A Guide to Managing Knowledge. Boston, MA. Harvard Business School Press.
Wilder, J. (1993). The sophomore slump: A complex development period that contributes to attrition. College Student Affairs Journal, 12(2), 18-27.