in the population sciences published by the Max Planck Institute for Demographic Research Konrad-Zuse Str. 1, D-18057 Rostock · GERMANY www.demographic-research.org
DEMOGRAPHIC RESEARCH
VOLUME 27, ARTICLE 14, PAGES 377-418
PUBLISHED 11 SEPTEMBER 2012
http://www.demographic-research.org/Volumes/Vol27/14/ DOI: 10.4054/DemRes.2012.27.14
Research Article
Spatially varying predictors of teenage birth
rates among counties in the United States
Carla Shoff
Tse-Chuan Yang
This publication is part of the Special Collection on “Spatial Demography”, organized by Guest Editor Stephen A. Matthews.
© 2012 Carla Shoff & Tse-Chuan Yang.
1 Introduction 378
2 Research framework 379
2.1 Presence of family planning clinics and TBR 379 2.2 Race, ethnicity, and teenage childbearing 380 2.3 The association between religiosity and teenage births 381 2.4 Socioeconomic status and teenage childbearing 382
2.5 Hypotheses 383
3 Data and methodology 384
3.1 Unit of analysis 384
3.2 Dependent variable—TBR 385
3.3 Independent variables—family planning clinics, racial/ethnic composition, religiosity, and socioeconomic disadvantage
385
3.4 Methodologies and analytic strategy 386
4 Analytic results 388
4.1 Descriptive results 388
4.2 Global regression results 390
4.3 Local regression results 392
4.3.1 Metropolitan county model results 394 4.3.2 Nonmetropolitan county model results 399 4.4 Spatial regime analysis results 404
5 Conclusions 406
5.1 Discussion of findings 406
5.2 Policy and practice implications 408
5.3 Contributions 409
5.4 Limitations of the current study and directions for future research 410
Spatially varying predictors of teenage birth rates among counties
in the United States
Carla Shoff1
Tse-Chuan Yang2
Abstract
BACKGROUND
Limited information is available about teenage pregnancy and childbearing in rural areas, even though approximately 20 percent of the nation’s youth live in rural areas. Identifying whether there are differences in the teenage birth rate (TBR) across metropolitan and nonmetropolitan areas is important because these differences may reflect modifiable ecological-level influences such as education, employment, laws, healthcare infrastructure, and policies that could potentially reduce the TBR.
OBJECTIVES
The goals of this study are to investigate whether there are spatially varying relationships between the TBR and the independent variables, and if so, whether these associations differ between metropolitan and nonmetropolitan counties.
METHODS
We explore the heterogeneity within metropolitan/nonmetropolitan county groups separately using geographically weighted regression (GWR), and investigate the difference between metropolitan/nonmetropolitan counties using spatial regime models with spatial errors. These analyses were applied to county-level data from the National Center for Health Statistics and the US Census Bureau.
RESULTS
GWR results suggested that non-stationarity exists in the associations between TBR and determinants within metropolitan/nonmetropolitan groups. The spatial regime analysis
1 Social Science Research Institute and The Population Research Institute, Pennsylvania State University 601 Oswald Tower University Park, PA 16802, USA. E-mail: [email protected]. Tel: +1-814-659-0990. 2
indicated that the effect of socioeconomic disadvantage on TBR significantly varied by the metropolitan status of counties.
CONCLUSIONS
While the spatially varying relationships between the TBR and independent variables were found within each metropolitan status of counties, only the magnitude of the impact of the socioeconomic disadvantage index is significantly stronger among metropolitan counties than nonmetropolitan counties. Our findings suggested that place-specific policies for the disadvantaged groups in a county could be implemented to reduce TBR in the US.
1. Introduction
Limited information is available about teenage pregnancy and childbearing in rural areas (Loda et al. 1997), even though approximately 20 percent of the nation’s youth live in rural areas (Economic Research Service 2005). Most of the previous research on teenage pregnancy has concentrated on teenage pregnancy prevention, with very few studies that have compared the teenage birth rate (TBR) across states (Crosby and Holtgrave 2006) and no nationally representative studies that provide pregnancy or birth rates for teenagers living in nonmetropolitan3 areas (Skatrud, Bennett and Loda 1998). Identifying whether there are differences in the TBR across metropolitan and nonmetropolitan areas is important because these differences may reflect ecological-level influences such as education, employment, laws, healthcare infrastructure, and policies that could be changed in an effort to reduce the TBR (Crosby and Holtgrave 2006).
Skatrud et al. (1998) wrote the most recent and comprehensive overview of the literature on teenage pregnancy in nonmetropolitan areas. Of the 500 articles reviewed, the authors identified only six articles focused on teenage pregnancy in nonmetropolitan areas. In addition, these six published articles focused specifically on one or a few states and used samples which were not racially or ethnically diverse. One of the articles only focused on sexual activity among rural teenagers rather than teenage pregnancy or birth rates.
By compiling this comprehensive literature review, Skatrud et al. (1998) identified that there is a genuine need for a thorough examination of comparative data for
3
representative samples of rural and urban teenagers. Among their recommendations was the need for a study on teenage pregnancy and childbearing that includes both rural and urban areas of the country. Our study is motivated by Skatrud et al.’s work.
Using county-level data from the National Center for Health Statistics and the U.S. Census Bureau, the specific goals of this paper are to (1) investigate whether there are varying relationships between the TBR and the independent variables across space (i.e., non-stationarity) and (2) if so, whether these associations differ by metropolitan/ nonmetropolitan status of counties.
2. Research framework
2.1 Presence of family planning clinics and TBR
Family planning services4 are a critical component to make the changes needed to reduce the TBR (Santelli et al. 2007); however, teenagers from nonmetropolitan areas face more restrictions when trying to obtain contraceptives compared to urban teenagers (Skatrud et al. 1998). Most importantly, there is a lack of multiple forms of health services (e.g., family planning clinics, family physicians, obstetricians, and gynecologists) available in nonmetropolitan areas (Loda et al. 1997). In addition, when compared to metropolitan teenagers, rural teenagers have more confidentiality concerns, have minimal public transportation options, and have to travel long distances to family planning clinics (Skatrud et al. 1998).
Even if contraceptive services and supplies are available in an area, this does not mean that all minors are able to receive the contraceptives or reproductive health care they need. Rising medical costs, such as those associated with new contraceptive methods and treatment options, have forced family planning clinics to restructure their administration, resulting in clinic consolidation (Frost, Frohwirth, and Purcell 2004). This restructuring has made it more difficult for teenagers to obtain contraceptives who live far from open clinics or in places where clinics have closed. A clinic opening farther away not only causes transportation and contraceptive availability problems but also causes problems for women and teenagers to receive stable and continuous reproductive healthcare.
Clinic consolidation can be especially problematic for teenagers who live in nonmetropolitan areas where, increasingly, hospitals no longer provide family planning services and there is no public transportation available to more distant clinics (Bennett
4
2002). Teenagers may be forced to seek more expensive contraceptive services through nearby private physicians, settle for using less effective contraceptive methods, or use no contraceptive method or receive no reproductive healthcare at all (Frost et al. 2004).
2.2 Race, ethnicity, and teenage childbearing
Most of the research on teenage pregnancy has focused on behavioral and socioeconomic variables that are associated with teenage pregnancy, and relatively little research has focused on the differences in pregnancy and birth rates across racial and ethnic groups (Berry et al. 2000). Even among the studies that have compared TBR among race/ethnicity groups, few studies include Asian teenagers and even fewer consider American Indians. This is usually due to the small sample size of these minority populations (Berry et al. 2000).
Teenage pregnancy and birth rates are higher among racial and ethnic minority groups (Manlove et al. 2000b; Maynard and Rangarajan 1994; Santelli et al. 2000; Zavodny 2001). American Indian teenagers experience higher rates of teenage pregnancy than their white counterparts (Corcoran, Franklin and Bennett 2000; Garwick et al. 2008). In the US, the American Indian TBR is 69 per 1,000 teenagers compared to the national TBR of 49 per 1,000 teenagers (Garwick et al. 2008). African American and Hispanic teenagers have higher rates of teenage births than white teenagers (Blake and Bentov 2001; Corcoran et al. 2000). In their study on birth rates among teenagers in California, Kirby et al. (2001) found that the proportion of the population who were Black and the proportion of the population who were Hispanic to be significantly and positively related to the TBR.
2.3 The association between religiosity and teenage births
There is a need for more extensive empirical research on the possible association between religiosity and adolescent pregnancy (Miller and Gur 2002) since little is known about the influence of religious affiliation or adherence on teenage pregnancy and childbearing (Brewster et al. 1998). We do know that teenage women with a religious affiliation are less likely to become sexually active prior to marriage than their nonreligious counterparts (Brewster et al. 1998). In addition, teenage females involved with fundamentalist religions experience their first sexual intercourse at a later age; however, they are substantially less likely to use contraceptives during their first sexual intercourse (Brewster et al. 1998).
Miller and Gur (2002) examined the relationship between religiosity and adolescent pregnancy through unprotected sexual intercourse and found that religiosity was associated with fewer sexual partners in the last year. The authors also identified that planned and responsible use of birth control methods was significantly related with frequent attendance at religious events. Surprisingly, the authors found that no aspect of religiosity in adolescence was associated with a decrease in the likelihood of sexual activity or sexual abstinence (Miller and Gur 2002). In another study on religiosity and teenage childbearing, Zavodny (2001) found that a woman’s religious denomination does not affect the likelihood of a nonmarital teenage pregnancy. By contrast, O’Connor (1999) found that membership in a school religious organization was associated with lowered odds of having a child as a teenager; however, significant findings were only identified for white teenagers.
The mixed evidence from the studies above makes it difficult to understand whether there is variation in the levels of sexual activity, contraceptive use, pregnancy, and childbearing among teenagers from different religious affiliations. Differences in levels of pregnancy and childbearing among teenagers from multiple religions may be related to varying beliefs regarding premarital sexual activity or contraceptive use. Differences in TBR by religious affiliation could also be attributed to specific beliefs about abortion.
adherence and beliefs across metropolitan and nonmetropolitan America, we believe the relationship between religiosity and TBR will vary across space.
2.4 Socioeconomic status and teenage childbearing
Socioeconomic status, which is highly correlated with poverty, employment, and education, has been found to be a significant factor contributing to teenage childbearing (Berry et al. 2000; Corcoran et al. 2000; Manlove, Mariner, and Papillo 2000a; Santelli et al. 2000). The risk of teenage pregnancy and births is higher in more disadvantaged communities (Driscoll et al. 2005; Skatrud et al. 1998). High socioeconomic status in a community usually leads to more services and economic resources available for teenagers and other members of the community (Driscoll et al. 2005). When teenagers are exposed to these economic resources, they are more likely to delay childbearing. Teenagers who live in disadvantaged areas have fewer opportunities, which may provide less of an incentive for avoiding a birth as a teenager (Driscoll et al. 2005).
Poverty has been found to be one of the strongest indicators of unintended teenage childbearing (Blake and Bentov 2001; East and Jacobson 2000; Manlove et al. 2000a; Santelli et al. 2000). Kirby et al. (2001), using data for all ZIP code areas in the state of California, found that the proportion of households living below the poverty line is positively correlated with the TBR. The birth rate among poor teenagers ages 15 to 19 is almost ten times the rate among higher-income teenagers (Santelli et al. 2000).
High levels of unemployment are related to higher levels of teenage pregnancy (Corcoran et al. 2000; Young et al. 2004). Kirby et al. (2001) found that among the non-Hispanic white population, both male and female unemployment rates were positively related to the TBR. Among the Black population, neither male employment nor male unemployment rates were significantly related to the TBR; however, the Black female unemployment rate was even more related to the Black TBR than the white female unemployment rate was to the white TBR (Kirby et al. 2001). For the Hispanic population in the study, neither male nor female unemployment rates were significantly related to the TBR (Kirby et al. 2001).
Living in an area with low levels of formal education is a significant risk factor for teenage pregnancy. Blake and Bentov (2001) found that the higher the percentage of adults with less than 12 years of education, the higher the unmarried TBR. Additionally, Kirby et al. (2001) found that the higher the adult population with a college degree, the lower the TBR.
and Bentov 2001; Corcoran et al. 2000; Driscoll et al. 2005; SmithBattle 2007). This previous research shows how poverty, unemployment, and limited education in an area are associated with teenage pregnancy and childbearing. As nonmetropolitan areas have been featured by poorer socioeconomic indicators (e.g., income) compared to metropolitan areas (Miller 2009), we question whether the associations between TBR and these indicators differ by metropolitan status.
2.5 Hypotheses
Our review and discussion of the existing literature provides some evidence to suggest that TBR and its determinants may be distributed unevenly across space. Another source of potential spatial heterogeneity is the dynamics between population and location (Fotheringham 1997). That is, the differences in knowledge, attitudes, and culture across locations may alter how people utilize local medical resources, react to hardship, and manage pregnancy. Given the potential presence of spatial heterogeneity, it would be naïve to assume that the spatial process between TBR and its determinants are stationary (or universal) and can be captured by a conventional “global” model. In our study, we use GWR to explore the heterogeneity within metropolitan/nonmetropolitan counties separately. We also investigate the difference
between metropolitan/nonmetropolitan counties using spatial regime analysis (see methodology section).
Using this spatial modeling framework, we test seven hypotheses. We hypothesize that (H1) the spatial variation in the availability of family planning clinics (Skatrud et al. 1998) will be associated with TBR in different ways between metropolitan and nonmetropolitan counties; and, within each metropolitan status group, the magnitude of the relationship between TBR and family planning clinics varies significantly across space.
Regarding race/ethnicity, for the nonmetropolitan counties featured by a non-Hispanic white population in the Great Plains and Midwest region (Miller 2009), we anticipate that (H2) the associations of percentages of minority groups with TBR are dependent on geographical location and (H3) are stronger in nonmetropolitan counties than metropolitan counties. For the nonmetropolitan counties that are not dominated by either Black or white population, we hypothesized to demonstrate stronger associations between TBR and other race/ethnicity groups (e.g., Asian and Hispanic).
2008) the association between religiosity and TBR will be weaker. Since nonmetropolitan Americans are more likely to be frequent church-goers compared to those living in metropolitan areas (Dillon and Savage 2006), we predict that (H5) the association between religiosity and TBR to be stronger in nonmetropolitan compared to metropolitan areas.
Similarly, as the socioeconomic composition is important in understanding TBR and varies greatly across metropolitan and nonmetropolitan counties, our last two hypotheses are that (H6) the relationship between the socioeconomic disadvantage index and TBR is not stationary across counties and that (H7) the association between socioeconomic disadvantage and TBR is stronger in nonmetropolitan than metropolitan counties. The counties in the south, the areas consistently experiencing high poverty, are expected to show stronger effects of socioeconomic disadvantage on TBR than those counties in other regions.
3. Data and methodology
3.1 Unit of analysis
This is a county-level analysis of all counties in the continental US (with Virginia’s independent cities treated as counties in these analyses). The county was chosen as the unit of analysis for this study for several reasons. First, the county is the smallest analytic unit with useful policy implications (Allen 2001), and policy decisions rarely extend to units below the county-level. Second, data from the US decennial census and other governmental agencies such as the National Center for Health Statistics (NCHS) are more readily available at the county-level. Third, using counties as the unit of analysis allows for the inclusion of all geographic areas in the continental US, including the most remote nonmetropolitan counties and the largest metropolitan areas. Even though counties are not considered actual communities, they are valid spatial and decisional units of analysis for the purposes of determining the factors corresponding to the variability in conditions across the continental US (McLaughlin et al. 2007).
counties is consistent with the official metropolitan status defined by the Office of Management and Budget and includes the new metropolitan status definitions from 2003 (Economic Research Service 2003).
3.2 Dependent variable—TBR
Our data come from multiple data sources. The NCHS provided the non-public use 1999, 2000, and 2001 micro-data detailed natality files (National Center for Health Statistics 1999-2001). This individual-level data set is based on information abstracted from birth certificates filled in the vital statistics offices in every state. Because the data from NCHS are at the individual-level, the birth data used for this analysis were aggregated to the county-level using the mother’s county of residence at the time of birth. This is a 100 percent sample that consists of all births that occurred during the 1999, 2000, and 2001 calendar years to women of all ages. We use these data to calculate the dependent variable, TBR. In order to minimize the fluctuation in the birth rates, the three-year (1999-2001) average TBR were calculated for all counties in the continental US. In order to create this measure, the births to mothers who were ages 15–19 at the time the birth took place were extracted from the original data file. The birth counts from each of the three data files were averaged and this number was divided by the total population of females age 15-19 according to the 2000 census and multiplied by 1,000 (US Census Bureau 2000).
3.3 Independent variables—family planning clinics, racial/ethnic composition, religiosity, and socioeconomic disadvantage
The Directory of Family Planning Grantees, Delegates, and Clinics were used to identify each state’s Title X funded clinics’ contact information (Office of Population Affairs 2005). To identify the rate of clinics per 1,000 females ages 15–19, the street addresses for each of the publicly funded family planning clinics was entered into a database. These addresses were then geocoded in ArcGIS 9.3. The clinic shape file was joined to a 2000 Census county boundary shape file to identify the number of clinics in each county. The number of clinics in each county was then divided by the females age 15–19, and multiplied by 1,000.
We calculated the percentage of the population identifying themselves as Black-alone,
Native American-alone, and Asian-alone. Our measure of Percent Hispanic was the Hispanic population divided by the total population, and then multiplied by 100; this measure combined Hispanics reporting any single race or two or more races.
The percentage of the population in poverty (the percentage of persons for whom poverty status is determined with income below the poverty level), the percentage unemployed (the percentage of the civilian population ages 16 years and over and in the labor force), and the percentage less than high school (the percentage of the total population 25 years old and older with less than a high school or equivalent degree) measures were highly correlated: poverty and unemployment (0.68); poverty and less than high school (0.71); and unemployment and less than high school (0.43) and all three bivariate correlations were significant at the p<0.001 level. In order to avoid potential multicollinearity with these three variables, principal components analysis was used to create one composite measure, the socioeconomic disadvantage index.
Data from The Association of Religion Data Archives (ARDA 2000) were used to create a composite measure of religiosity. The 2000 ARDA county files were used to extract data on the rate of adherence per 1,000 population for Mainline Protestant, Catholic, and Evangelical adherence. These rates of adherents were calculated by ARDA using the 2000 US Census SF1 files. The rates of adherence for these three religious groups were included in a principal components analysis to create one composite measure of religiosity using the regression method.
3.4 Methodologies and analytic strategy
Following Curtis et al. (2012), we pursue a socially-defined regime approach. It has been suggested that the concept of “spatial regime” should not be confined to geography or space and can be any meaningful group, such as poverty rates above the national average or metropolitan status (Anselin 1990a; Curtis et al. 2012). Specific to this study, we will test whether the difference between metropolitan and nonmetropolitan counties (the regimes) is significant for each independent variable with a spatial Chow test for structural instability across regimes (Anselin 1990b). The spatial Chow statistic is distributed as a Chi-square distribution and is used to test for stability of the regression coefficients, jointly and separately, across the metropolitan and nonmetropolitan regimes.
conventional OLS regression models and allows researchers to compare GWR and OLS models based on the goodness-of-fit statistics, such as the Akaike Information Criterion (AIC). Unlike the conventional modeling approaches (e.g., OLS), GWR does not assume the relationships between independent and dependent variables are constant across space. Instead, GWR explores whether the relationships between a set of predictors and an outcome vary by geographical location (Fotheringham, Brunsdon and Charlton 2003). A spatially varying association suggests that a one unit change in X
provokes different levels of change in Y in different parts of the study area (i.e., non-stationarity). As our dependent variable is continuous, the Monte Carlo test for spatial non-stationarity will be used in our analysis (Brunsdon, Fotheringham and Charlton 1996). While GWR has some limitations, such as multicollinearity (Wheeler and Tiefelsdorf 2005) and approaches to calculating goodness-of-fit statistics (Salas et al. 2010), it has been suggested to be a powerful tool for investigating spatial non-stationarity (Wheeler and Paez 2010).
In our exploratory GWR application, we utilize a split-GWR framework, using data on just the nonmetropolitan counties in our nonmetropolitan model and metropolitan counties in the metropolitan model. This approach is rarely adopted, and no other such application of GWR has been done to the best of our knowledge. However, this approach will not pose a problem for our analyses and in fact serves our substantive research interests. GWR was originally developed for spatial point data, and one of the method’s strengths is that it allows for the interpolation of values of spatial points that are not included in the data set (Fotheringham et al. 2002). For example, Brunsdon et al. (1999) modeled selected house sales in Kent, UK, and demonstrated the GWR results for the “whole Kent area,” including those places without observations. While GWR was designed for use with spatial point data, it can be stretched to areal data by using the geographic centroids of the areas in the analysis (as was done in this study). An illustration of this approach is included in the GWR workbook by Fotheringham and colleagues (2002). For this study, we only focus on the spatial relationships within metropolitan and nonmetropolitan counties, respectively.
GWR results for those areas without data, we are very cautious about this interpolation and decided not to show the results outside the research areas (i.e., we masked the nonmetropolitan counties in the maps reporting the metropolitan county results, and vice versa). If the GWR approach finds evidence of spatial non-stationarity, spatial regime analysis can help further understand whether the non-stationary associations between TBR and its determinants are specific to nonmetropolitan and metropolitan counties. Spatial regime analysis examines whether the regimes defined by researchers contribute to the unstable relationships between the independent and dependent variables (Anselin 1988). While spatial regime analysis addresses the non-stationarity, it may not fully handle spatial dependence embedded in the data. To minimize the impact of spatial dependence on our estimates, we incorporate a spatial error term into the spatial regime analysis to account for this potential source of bias (Anselin 1990a).
4. Analytic results
4.1 Descriptive results
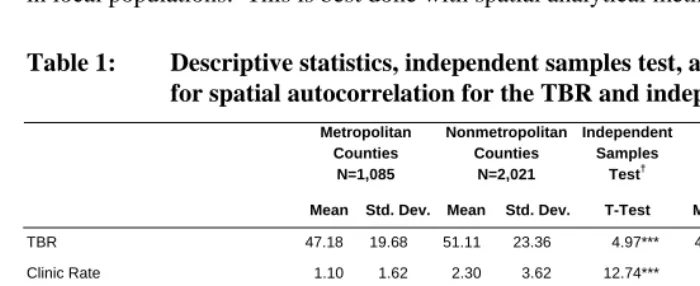
The mean and standard deviation for each of the variables included in the analysis are presented in Table 1 for metropolitan and nonmetropolitan counties separately, and for all counties in the continental US.On average, at the county level, the US has a TBR of approximately 50 births per 1,000 females 15-19 years of age. Nonmetropolitan counties have a slightly higher TBR of 51 compared to the TBR in metropolitan counties of 47. Also displayed in Table 1 is the Moran’s I statistic, a measure of spatial autocorrelation, for each of the variables. There is significant positive spatial autocorrelation for each of the variables, including the TBR, which has a Moran’s I statistic of 0.53 (p<0.001). These values are indicative of the need for this ecological analysis to be one that incorporates a spatial perspective. As shown in Figure 15, there is variability in our dependent variable, the TBR, across counties in the continental US. The counties with the lowest TBR (0 birth) are thirteen nonmetropolitan counties located in Colorado, Montana, Nebraska, New Mexico, North Dakota, Texas, and Virginia. The county with the highest TBR (130 births per 1,000 females age 15-19) is the nonmetropolitan county, Todd, South Dakota. As shown in the map, the counties in the southern half of the US tend to have higher TBR, especially along the Black Belt and the US-Mexico border, with additional pockets of high TBR in the Great Plains and Mountain West.
5
We only provide a descriptive map of the dependent variable in the manuscript to maintain space
The independent sample T-test was used to determine whether these characteristics are significantly different between metropolitan and nonmetropolitan counties. As reported in Table 1, all of the characteristics are significantly different between metropolitan and nonmetropolitan counties with the exception of the percentage Hispanic. Given the variability of TBR and its predictors across the US between metropolitan and nonmetropolitan status and the significant spatial autocorrelations in our data, it is important to determine which factors contribute to this variation in TBR in local populations. This is best done with spatial analytical methods.
Table 1: Descriptive statistics, independent samples test, and Moran’s I test for spatial autocorrelation for the TBR and independent variables
Metropolitan Counties Nonmetropolitan Counties N=1,085 N=2,021 Independent Samples Test† All Counties N=3,106
Mean Std. Dev. Mean Std. Dev. T-Test Mean Std. Dev. Moran’s I
TBR 47.18 19.68 51.11 23.36 4.97*** 49.74 22.21 0.53***
Clinic Rate 1.10 1.62 2.30 3.62 12.74*** 1.88 3.13 0.25***
Percentage Black 10.57 13.64 7.89 14.92 -4.91*** 8.83 14.54 0.79***
Percentage Native American 0.74 1.99 2.04 7.57 7.22*** 1.58 6.25 0.35***
Percentage Asian 1.49 2.41 0.39 0.45 -14.92*** 0.77 1.56 0.57***
Percentage Hispanic 6.51 10.89 6.04 12.63 -1.01*** 6.21 12.05 0.83***
Religiosity Index 0.09 0.89 -0.05 1.05 -4.01*** 0.00 1.00 0.80***
Socioeconomic Disadvantage Index -0.35 0.83 0.19 1.03 15.89*** 0.00 1.00 0.61***
Note: *p<0.05; **p<0.01; ***p<0.001; † We first tested whether the variances are equal between metropolitan and nonmetropolitan groups and then conducted a T-test accordingly.
Figure 1: Map of 3-year average (1999-2001) births per 1,000 females ages 15-19 by county
These descriptive statistics between metropolitan and nonmetropolitan counties in Table 1, to some extent, hint that the associations between these independent variables and the TBR may differ by metropolitan status. However, it should be noted that these are auxiliary results and more solid evidence is required to test our hypotheses.
4.2 Global regression results
model. Multicollinearity is said to exist if the VIF is 10 or higher (Williams 2011). The highest VIF in this analysis was for the socioeconomic disadvantage index. The VIF was 1.95 in the metropolitan county model and 2.15 in the nonmetropolitan county model (results not shown).
Table 2: OLS regression estimates of TBR for metropolitan and nonmetropolitan counties
Metropolitan Model
(N=1,085)
Nonmetropolitan Model (N=2,021)
Estimate S.E. Estimate S.E.
Intercept 46.11*** 0.88 42.59*** 0.57
Clinic Rate -0.57*** 0.25 -0.42*** 0.09
Percentage Black 0.34*** 0.03 0.41*** 0.03
Percentage Native American 0.28*** 0.19 0.58*** 0.05
Percentage Asian -1.49*** 0.17 -0.50*** 0.75
Percentage Hispanic 0.57*** 0.04 0.65*** 0.03
Religiosity Index -7.91*** 0.48 -9.24*** 0.36
Socioeconomic Disadvantage
Index 7.97*** 0.64 4.77*** 0.47
Adjusted R-squared†
0.60 0.60
Akaike Information Criterion 8559.59 16628.93
Note: *p<0.05; **p<0.01; ***p<0.001; †The R-squared is identical across models due to rounding.
As expected, the socioeconomic disadvantage and religiosity indices are significantly related to the TBR. Specifically, with every 0.09 (mean) increase in county religiosity the TBR decreases by 7.91 births in metropolitan counties. As for nonmetropolitan counties, a 0.05 (mean) increase in county religiosity is associated with a decrease in the TBR by 9.24. Socioeconomic disadvantage also had a substantial effect on the TBR. For every one standard deviation increase in the socioeconomic disadvantage index there is an increase in the TBR of 7.97 births in metropolitan counties and 4.77 births in nonmetropolitan counties.
Both the metropolitan and nonmetropolitan OLS regression models explain 60 percent of the total variance in the TBR. That is, the same set of independent variables capture the variation in the TBR for metropolitan and nonmetropolitan counties equally well. However, the R-squared does not tell us whether a variable (e.g., family planning clinics) exerts its influence on TBR in the same way in the metropolitan and nonmetropolitan county models. Although the OLS regression model provides some evidence for the above stated hypotheses, it does not control for the potential biases from both spatial homogeneity and heterogeneity, and it remains unclear whether the associations found above vary spatially. We use GWR to address this issue.
4.3 Local regression results
that the GWR local model is statistically preferable to the OLS global model (Fotheringham, Brunsdon, and Charlton 2002).
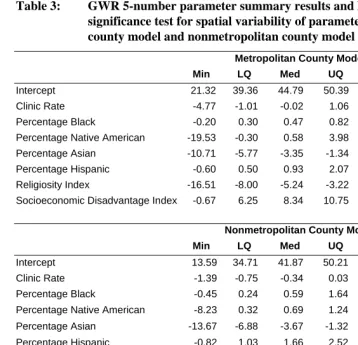
Table 3: GWR 5-number parameter summary results and Monte Carlo significance test for spatial variability of parameters for metropolitan county model and nonmetropolitan county model
Metropolitan County Model (N=1,085)
Min LQ Med UQ Max Monte Carlo
Intercept 21.32 39.36 44.79 50.39 62.31 ***
Clinic Rate -4.77 -1.01 -0.02 1.06 2.70
Percentage Black -0.20 0.30 0.47 0.82 3.80 ***
Percentage Native American -19.53 -0.30 0.58 3.98 24.68 ***
Percentage Asian -10.71 -5.77 -3.35 -1.34 1.72 ***
Percentage Hispanic -0.60 0.50 0.93 2.07 6.33 ***
Religiosity Index -16.51 -8.00 -5.24 -3.22 6.99 ***
Socioeconomic Disadvantage Index -0.67 6.25 8.34 10.75 20.89
Nonmetropolitan County Model (N=2,021)
Min LQ Med UQ Max Monte Carlo
Intercept 13.59 34.71 41.87 50.21 61.94 ***
Clinic Rate -1.39 -0.75 -0.34 0.03 1.10
Percentage Black -0.45 0.24 0.59 1.64 7.94 ***
Percentage Native American -8.23 0.32 0.69 1.24 5.51 ***
Percentage Asian -13.67 -6.88 -3.67 -1.32 7.70
Percentage Hispanic -0.82 1.03 1.66 2.52 4.85 ***
Religiosity Index -16.43 -6.51 -4.71 -2.98 1.94 ***
Socioeconomic Disadvantage Index -9.73 1.28 3.47 5.76 12.68 ***
Metropolitan County Model
Nonmetropolitan County Model
Bandwidth 129 241
Adjusted R-squared† 0.72 0.72
Akaike Information Criterion 8327.02 16088.26
4.3.1 Metropolitan county model results
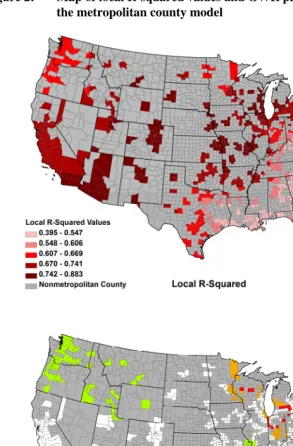
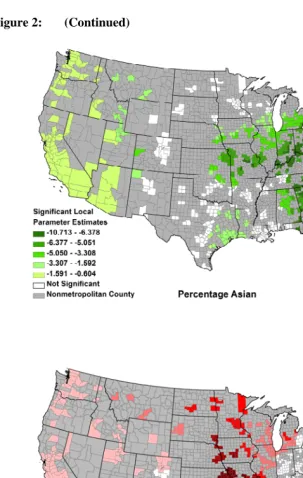
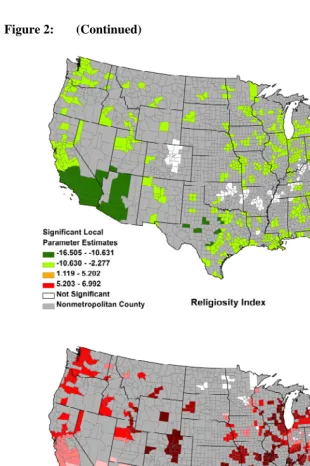
Maps of the local R-squared values and the significant parameter estimates are displayed in Figure 2 for the metropolitan county GWR model and Figure 3 for the nonmetropolitan county GWR model. As shown in the local R-squared map in Figure 2, the total variance explained by the local model for metropolitan counties ranges from 39.5 percent to 88.3 percent. In the metropolitan county model, the model fits the data well in many areas of the US, including the Northeast, Midwest, parts of the Great Lakes, and along the west coast. This model did not fit the data as well in the Appalachia region and the South. One of the benefits of the GWR approach is that it allows for the identification of areas that may benefit from a model that includes additional covariates that may help explain regional variation in TBR.
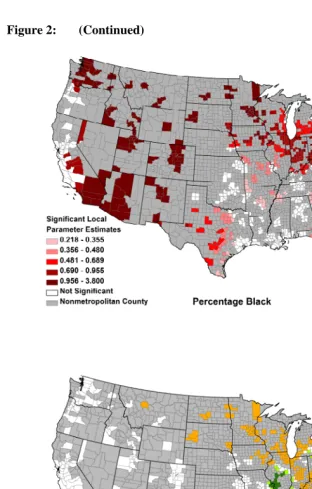
Figure 2: Map of local R-squared values and GWR parameter estimates for the metropolitan county model
Figure 2: (Continued)
Figure 2: (Continued)
Figure 2 also displays the effect of the religiosity index on the TBR. The OLS metropolitan county model results revealed that with an increase in the religiosity index of 0.09, the TBR decreases by approximately 8 births per 1,000 females. The GWR results also show a negative relationship between the religiosity index and the TBR in the majority of the significant counties. The reduction in the TBR across counties ranges from approximately 2 to 16.5 births per 1,000 females. The largest decreases in the TBR can be found along the west coast and in Georgia and South Carolina. While the majority of the significant metropolitan counties experience a decrease in the TBR with higher religiosity, there are some metropolitan counties in the US that experience increases in the TBR. Specifically, metropolitan counties in the Northeast experience increases in the TBR ranging from approximately 1 to 7 births per 1,000 teenagers, controlling for the other variables in the model. As identified in the OLS metropolitan county model, as socioeconomic disadvantage increases in a county, the TBR also increases. This strong relationship was found in many metropolitan counties across the US, with the exception of parts of the Mid-Atlantic, North Central region, and Florida.
4.3.2 Nonmetropolitan county model results
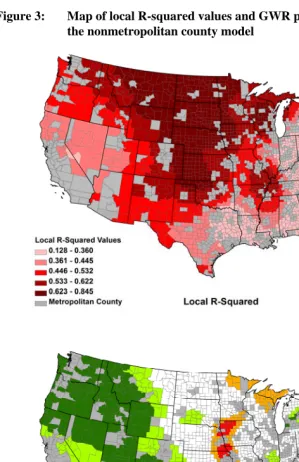
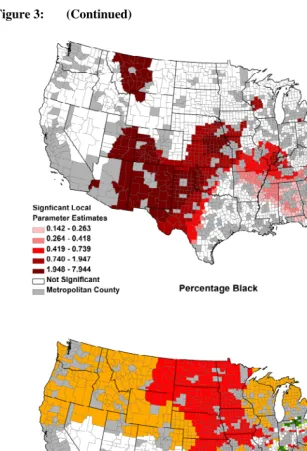
Maps of the local R-squared values and the significant parameter estimates for the nonmetropolitan county model are displayed in Figure 3. As shown in the local R-squared map, the total variance explained by the local model for nonmetropolitan counties ranges from 12.8 percent to 84.5 percent. In the nonmetropolitan county model, the model fits the data well in many areas of the US, especially in the Southeast and Midwest. This model did not fit the data as well in the Appalachia and Black Belt regions.
Figure 3: (Continued)
The OLS nonmetropolitan county results revealed that with every 0.05 (the same magnitude of the mean) increase in the religiosity index, the TBR decreases by approximately 9 births per 1,000 females. The GWR results also show a negative relationship between the religiosity index and the TBR. The reduction in the TBR across nonmetropolitan counties ranges from an approximately 2.5 to 16 births per 1,000 females. Significant non-stationarity was also identified for the relationship between socioeconomic disadvantage and the TBR. Consistent with the OLS nonmetropolitan county results, as socioeconomic disadvantage increases in a county, the TBR also increases. The GWR nonmetropolitan county results also revealed a strong positive relationship between socioeconomic disadvantage and the TBR in the majority of the significant counties. These are areas where efforts to improve the county’s socioeconomic status could also reduce the TBR. However, a strong negative association between socioeconomic disadvantage and the TBR was also identified from the GWR nonmetropolitan county results for counties located in the Midwest.
4.4 Spatial regime analysis results
While GWR confirms the spatially varying relationships between TBR and the independent variables in the metropolitan and nonmetropolitan county models, the question of whether the impact of each predictor differs across metropolitan status is not answered. The spatial regime model was used to address this issue.6 The spatial regime analysis used a first-order queen contiguity spatial weights matrix (Anselin, Syabri, and Kho 2005), and the regression parameters were estimated in R (Bates et al. 2010). We follow the approach used by Curtis et al. (2012), which addresses the larger spatial context with a spatial error approach and the theoretically relevant spatially bounded social attributes with a spatial regime approach7. The spatial regime modeling allows us to model TBR across metropolitan and nonmetropolitan counties simultaneously, which allows us to test whether the influences of independent variables on TBR differ across metropolitan and nonmetropolitan counties. The spatial Chow test was employed to test the hypothesis that the impacts are equal between metropolitan and nonmetropolitan counties. The spatial error term addresses the spatial autocorrelation in the residuals.
6 While GWR accounts for spatially autocorrelated errors, spatial regime analysis does not. Therefore, we tested for spatial autocorrelation in the residuals with a Moran’s I test. We found evidence of significant spatial autocorrelation (Moran’s I: 0.11; p<0.001); therefore, we included a spatial error term in the spatial regime analysis to treat the spatial autocorrelation found in the data (Anselin 1988).
7
We summarized the results in Table 4. The spatial regime analysis indicates that the effect of each of the independent variables on the TBR does not differ significantly between the metropolitan and nonmetropolitan counties, with the exception of the socioeconomic disadvantage index. The analysis of variance (ANOVA) approach was used to examine if the variation in coefficients between metropolitan and nonmetropolitan counties is significantly different. Using a Chi-square test, the non-spatial regime model (restricted model) was compared with the model with a varying coefficient for a given covariate (unrestricted model), and the Chi-square statistic is calculated to test the null hypothesis that the restricted model does not improve the model fit. According to the Chi-square statistic, the magnitude of the impact of the socioeconomic disadvantage index is significantly stronger among the metropolitan counties than in the nonmetropolitan counties.
Table 4: Unstandardized regression coefficients from a spatially corrected spatial regime analysis testing for structural variation in the predictors of TBR for metropolitan and nonmetropolitan counties
Metropolitan Counties Nonmetropolitan Counties Structural
N=1,085 N=2,021 Stability
Estimate S.E. Estimate S.E. Test
Intercept 44.58*** 0.99 43.97*** 0.59
Clinic Rate -0.18 0.28 -0.25** 0.09 0.21
Percentage Black 0.32*** 0.04 0.38*** 0.03 0.18
Percentage Native American
0.28 0.21 0.59*** 0.05 1.36
Percentage Asian -1.55*** 0.19 -2.24*** 0.69 0.04
Percentage Hispanic 0.57*** 0.05 0.63*** 0.03 0.26
Religiosity Index -7.82*** 0.52 -8.52*** 0.33 0.01
Socioeconomic Disadvantage Index
7.84*** 0.69 4.36*** 0.43 18.60***
Spatial error parameter (λ)
0.31***
Spatial Chow test 24.90**
Likelihood ratio test for spatial error
-12538.74***
AIC 25113
Note: *p<0.05; **p<0.01; ***p<0.001
5. Conclusions
5.1 Discussion of findings
The empirical results of this study allowed us to identify varying relationships between the TBR and the independent variables across space within both metropolitan and nonmetropolitan counties and to discover that the relationship between the socioeconomic disadvantage index and the TBR differs by the metropolitan status of counties. Here we revisit our hypotheses and discuss whether they are confirmed by our analysis.
nonmetropolitan counties and that the relationships within each metropolitan status group is spatially varying (H1). The OLS results showed a negative association between the clinic rate and TBR, and our GWR results suggested this variable was stationary within both metropolitan and nonmetropolitan models. The nonmetropolitan county spatial regime model showed a significant negative effect of family planning clinics on TBR, while the effect for metropolitan counties was not significant. However, the structural stability tests in the spatial regime modeling did not provide evidence for the significant difference between metropolitan groups.
Second, we hypothesized that the associations of percentages of minority groups with TBR are dependent on geographical locations (H2) and are stronger in nonmetropolitan counties than in metropolitan counties (H3). As anticipated, the GWR results revealed evidence for the non-stationarity embedded in the race/ethnicity-TBR relationship and those counties that are not dominated by non-Hispanic Black or white tend to have stronger relationships between other minority groups (e.g., Native American in Florida, Illinois, and the Great Plains) and TBR. As for the between-groups variation, the spatial regime model did not reveal the effect of percentages of minority groups on TBR to be stronger in nonmetropolitan counties than in metropolitan counties (despite the fact that the magnitudes of the associations were stronger in nonmetropolitan counties).
Third, we hypothesized that higher religiosity in a county is associated with a lower TBR (H4) and that the relationship between religiosity and the TBR to be stronger in nonmetropolitan than metropolitan areas. The spatial regime model results revealed a negative relationship between religiosity and TBR; however, the structural stability tests in the spatial regime modeling did not provide evidence for a significant difference between metropolitan and nonmetropolitan counties, even though the magnitude of the association was stronger in the nonmetropolitan county model.
Fourth, our last two hypotheses suggested that the relationship between the socioeconomic disadvantage index and TBR is not universal across counties (H6) and that this relationship is stronger in nonmetropolitan than metropolitan counties (H7). We found evidence to support the former and our figures suggested that the impacts of socioeconomic disadvantage on TBR tend to be stronger in the south. In addition, the spatial regime analysis suggested that the relationship between the socioeconomic disadvantage index and TBR should be stronger in metropolitan counties than in nonmetropolitan counties.
and the TBR. In Table 4, in contrast to other covariates, the socioeconomic disadvantage index showed the largest difference (3.48) in its estimated association with TBR between metropolitan and nonmetropolitan counties. This difference by metropolitan status led to the overall significance for the test for structural instability in Table 4 (spatial Chow test=24.9). In addition, it has been found that social conditions, such as poverty and employment rate, differ greatly by metropolitan status in the US and this spatial variation has persisted for the past few decades (Lichter and Brown 2011). Our finding of the significantly different impact of socioeconomic disadvantage index on TBR not only echoes the literature, but also underscores the importance of continuous efforts to narrow the socioeconomic status difference between metropolitan and nonmetropolitan counties. It should be noted that even within metropolitan and nonmetropolitan counties (separately), the heterogeneity would be great. Some nonmetropolitan counties are primarily based in primary industries, but others have been transformed to centers of tourism or other types of industry. Within metropolitan counties, some areas are focused on finance and business while others are technology-driven.
5.2 Policy and practice implications
The US has the highest teenage pregnancy rate among all developed countries (Pennsylvania Coalition To Prevent Teen Pregnancy 2004). The US teenage pregnancy rate is twice as high as England and Wales and eight times as high as in Japan and the Netherlands (The Alan Guttmacher Institute 2006) despite the fact that US levels of teenage sexual activity are comparable to other developed countries (Skatrud et al. 1998). The US TBR fell by more than one-third between 1991 and 2005 and increased by 5 percent over the next two consecutive years, but since then it has resumed the long-term downward trend (Ventura and Hamilton 2011).
keep teenagers in school and promote higher educational attainment should be incorporated into teenage pregnancy prevention programs. The majority of the programs that are currently in use are modeled after pregnancy prevention efforts in urban areas (Skatrud et al. 1998). However, teenagers need pregnancy prevention programs to focus on issues that are specific to the areas and situations in which they live (Skatrud et al. 1998).
Pregnancy prevention programs that are made available to nonmetropolitan teenagers need to address issues that are particular to nonmetropolitan areas such as social and cultural isolation, high rates of unemployment and poverty, poor housing, family disruption, confidentiality concerns, and lack of economic opportunities (Loda et al. 1997; Skatrud et al. 1998). In addition, nonmetropolitan communities typically do not have the wide range of resources and funding sources that are often found in urban areas (Loda et al. 1997; Skatrud et al. 1998). Therefore, special attention will need to be paid to finding creative ways to raise money for these efforts as well as to find more efficient ways to work with existing resources in nonmetropolitan counties.
This study found that higher rates of religiosity are associated with lower TBR. Working with churches or other religious institutions may be a way to reach out to teens in an effort to reduce teenage pregnancy. In addition, this study found that counties with higher concentrations of Black, Native American, and Hispanic populations have a higher TBR. Because of the differences in TBR across race/ethnicity, class, and location, teenagers are at varying risks of experiencing a teenage birth (Berry et al. 2000). Teenagers need contraceptive services and pregnancy prevention interventions to be specific according to their particular needs (Santelli et al. 2006). The programs implemented must also take into account racial, ethnic, and cultural differences, as well as geographical differences (Berry et al. 2000).
5.3 Contributions
(Table 1). Our split GWR results suggested that spatial dependency exists within each group. To further explore the variation between metropolitan and nonmetropolitan counties, we used a spatial regime approach with a spatial error term (Table 4). Accounting for spatial dependency in the errors will lead to better statistical efficiency than an OLS and aspatial perspective (Lesage and Pace, 2009). Our results provide evidence for the variation between metropolitan and nonmetropolitan groups (Curtis et al. 2012). Third, our study provides an example of how both local and global perspectives could inform each other. As Fotheringham (2009) suggests, spatial heterogeneity and dependency are not mutually exclusive, but few papers attempt to discuss them together in one study. Fourth, substantively, our work provides evidence that socioeconomic disadvantage may explain the difference in TBR between metropolitan and nonmetropolitan counties and that it may not be appropriate to assume the associations between TBR and its determinants are universal, which challenges a spatial naïve or aspatial perspective (Goodchild and Janelle, 2010).
5.4 Limitations of the current study and directions for future research
This study has some limitations. First, as an ecologic and cross-sectional analysis, the findings cannot be used to make causal inferences about individual behaviors. Adding a temporal component into future studies may further clarify the ecological associations we observed in 2000. Second, while the data used in this study are maintained by Federal agencies and are of high quality, sampling errors in the data collection design may be a concern. Third, due to data limitations, this study does not consider how condom usage is associated with the TBR. Condoms are one of the most common methods of birth control used by teenagers in the US. However, condoms do not have to be obtained from family planning clinics and can be obtained without a prescription. Fourth, because of the racial/ethnic disparities in the TBR, it may have been more beneficial to examine the TBR for specific racial/ethnic groups. The data could be used to perform this type of analysis. However, it was not done in this study due to the terms of the restricted data access agreement with the NCHS. A study using TBR by race/ethnicity using a nationally representative sample that included both nonmetropolitan and metropolitan teenagers would allow for an examination of how local (county) characteristics differ in their relationship with TBR for different racial and ethnic groups and would fill our gaps in the nonmetropolitan teenage pregnancy literature.
the extent to which nonmetropolitan teenagers need improved access and availability of contraceptive methods and services, as well as ways to create flexibility in the programming that allows for easy adaptation to local community needs. Mobile family planning clinics or doctors who practice in different communities various days of the week may be a way to address this concern. Finally, the results of this study showed a non-stationary relationship between the religiosity index and the TBR. To help better understand how religiosity affects the TBR, more research is also needed that looks at differences in TBR across religious groups and how these relationships vary across metropolitan and nonmetropolitan areas.
6. Acknowledgements
References
Allen, D.W. (2001). Social class, race, and toxic releases in American counties, 1995.
The Social Science Journal 38(1):13-25. doi:10.1016/S0362-3319(00)00109-9.
Anselin, L. (1988). Spatial Econometrics: Methods and Models. Cordrecht: Kluwer Academic Publishers.
Anselin, L. (1990a). Spatial dependence and spatial structural instability in applied regression analysis. Journal of Regional Science 30(2):185-207. doi:10.1111/j. 1467-9787.1990.tb00092.x.
Anselin, L. (1990b). What is special about spatial data? Alternative perspectives on spatial data analysis. In: Griffith D.A. (eds.). Spatial Statistics, Past, Present, and Future. Ann Arbor: MI: Institute of Mathematical Geography: 63-77.
Anselin, L., Syabri, I., and Kho, Y. (2005). OpenGeoDa. In: OpenGeoDa: An Introduction to Spatial Analysis. Tempe, AZ: GeoDa Center for Geospatial Analysis and Computation.
ARDA. (2000). Religious Congregations and Membership Study, 2000. Association of Religion Data Archives.
Bates, D., Chambers, J., Dalgaard, P., Falcon, S., Gentleman, R., Hornik, K., Iacus, S., Ihaka, R., Leisch, F., Ligges, U., Lumley, T., Maechler, M., Murdoch, D., Murrell, P., Plummer, M., Ripley, B., Sarkar, D., Lang, D.T., Tierney, L., and Urbanek, S. (2010). R: A language and environment for statistical computing. In: R Foundation for Statistical Computing Vienna Austria.
Bennett, T. (2002). Reproductive health care in the rural United States. JAMA-Journal of the American Medical Association 287(1):112. doi:10.1001/jama.287.1.112.
Berry, E.H., Shillington, A.M., Peak, T., and Hohman, M.M. (2000). Multi-ethnic comparison of risk and predictive factors for adolescent pregnancy. Child and Adolescent Social Work Journal 17(2): 79-96. doi:10.1023/A:1007554122283.
Blake, B.J. and Bentov, L. (2001). Geographical mapping of unmarried teen births and selected sociodemographic variables. Public Health Nursing 18(1): 33-39.
doi:10.1046/j.1525-1446.2001.00033.x.
Brewster, K.L., Cooksey, E.C., Guilkey, D.K., and Rindfuss, R.R. (1998). The changing impact of religion on the sexual and contraceptive behavior of adolescent women in the United States. Journal of Marriage and the Family
Brunsdon, C., Fotheringham, A.S., and Charlton, M.E. (1996). Geographically weighted regression: A method for exploring spatial non-stationarity.
Geographical Analysis 28(4): 281-298. doi:10.1111/j.1538-4632.1996.tb0093 6.x.
Brunsdon, C., Fotheringham, A.S., and Charlton, M. (1999). Some notes on parametric significance tests for geographically weighted regression. Journal of Regional Science 39(3): 497-524. doi:10.1111/0022-4146.00146.
Corcoran, J., Franklin, C., and Bennett, P. (2000). Ecological factors associated with adolescent pregnancy and parenting. Social Work Research 24(1): 29-39.
doi:10.1093/swr/24.1.29.
Crosby, R.A. and Holtgrave, D.R. (2006). The protective value of social capital against teen pregnancy: A state-level analysis. Journal of Adolescent Health 38(5): 556-559. doi:10.1016/j.jadohealth.2005.05.031.
Curtis, K.J., Voss, P.R., and Long, D.D. (2012). Spatial variation in poverty-generating processes: Child poverty in the United States. Social Science Research 41(1): 146-159. doi:10.1016/j.ssresearch.2011.07.007.
Darroch, J.E. and Singh, S. (1999). Why is teenage pregnancy declining? The roles of abstinence, sexual activity and contraceptive use. New York: The Alan Guttmacher Institute: 1-24.
Dillon, M. and Savage, S. (2006). Values and Religion in Rural America: Attitudes Toward Abortion and Same-Sex Relations. In: The Carsey Institute Reports on Rural America. Durham, NH: Carsey Institute, University of New Hampshire: 1-10.
Driscoll, A.K., Sugland, B.W., Manlove, J., and Papillo, A.R. (2005). Community opportunity, perceptions of opportunity, and the odds of an adolescent birth.
Youth & Society 37(1): 33-61. doi:10.1177/0044118X04267493.
East, P.L. and Jacobson, L.J. (2000). Adolescent childbearing, poverty, and siblings: Taking new direction from the new literature. Family Relations 49(3): 287-292.
doi:10.1111/j.1741-3729.2000.00287.x.
Economic Research Service. (2003). Urban Influence Codes. United States Department of Agriculture.
Fotheringham, A.S. (1997). Trends in quantitative methods I: stressing the local.
Progress in Human Geography 21(1): 88-96. doi:10.1191/0309132976766932 07.
Fotheringham, A.S. (2009). The problem of spatial autocorrelation and local spatial statistics. Geographical Analysis 41(4): 398-403. doi:10.1111/j.1538-4632.2009. 00767.x.
Fotheringham, A.S., Brunsdon, C., and Charlton, M.E. (2002). Geographically Weighted Regression: The Analysis of Spatially Varying Relationships. Chichester: Wiley.
Fotheringham, A.S., Brunsdon, C., and Charlton, M.E. (2003). GWR 3.0: Software for Geographically Weighted Regression. GWR 3 Manual.
Frost, J.J., Frohwirth, L., and Purcell, A. (2004). The availability and use of publicly funded family planning clinics: U.S. trends, 1994-2001. Perspectives on Sexual and Reproductive Health 36(5): 206-215. doi:10.1363/3620604.
Garwick, A.W., Rhodes, K., Peterson-Hickey, M., and Hellerstedt, W. (2008). Native teen voices: Adolescent pregnancy prevention recommendations. Journal of Adolescent Health 42(1): 81-88. doi:10.1016/j.jadohealth.2007.08.004.
Goodchild, M.F. and Janelle, D.G. (2010). Toward critical spatial thinking in the social sciences and humanities. GeoJournal 75(1): 3-13. doi:10.1007/s10708-010-9340-3.
Kirby, D., Coyle, K., and Gould, J.B. (2001). Manifestations of poverty and birthrates among young teenagers in California ZIP code areas. Family Planning Perspectives 33(2): 63-69. doi:10.2307/2673751.
LeSage, J.P. and Pace, R.K. (2009). Introduction to spatial econometrics. Chapman & Hall/CRC. doi:10.1201/9781420064254.
Lichter, D.T. and Brown, D.L. (2011). Rural America in an urban society: Changing spatial and social boundaries. Annual Review of Sociology 37(1): 565-592.
doi:10.1146/annurev-soc-081309-150208.
Loda, F.A., Speizer, I.S., Martin, K.L., Skatrud, J.D., and Bennett T.A. (1997). Programs and services to prevent pregnancy, childbearing, and poor birth outcomes among adolescents in rural areas of the southeastern United States.
Manlove, J., Mariner, C., and Papillo, A.R. (2000a). Subsequent fertility among teen mothers: Longitudinal analyses of recent national data. Journal of Marriage and the Family 62(1): 430-448. doi:10.1111/j.1741-3737.2000.00430.x.
Manlove, J., Terry, E., Gitelson, L., Papillo, A.R., and Russell, S. (2000b). Explaining demographic trends in teenage fertility, 1980-1995. Family Planning Perspectives 32(4): 166-175. doi:10.2307/2648233.
Maynard, R. and Rangarajan, A. (1994). Contraceptive use and repeat pregnancies among welfare-dependent teenage mothers. Family Planning Perspectives 26(5): 198-205. doi:10.2307/2135939.
McLaughlin, D.K., Stokes, C.S., Smith, P.J., and Nonoyama, A. (2007). Differential mortality across the U.S.: The influence of place-based inequality. In: Lobao, L.M., Hooks, G., and Tickamyer, A.R. (eds.). The Sociology of Spatial Inequality. Albany, NY: SUNY Press: 141-162.
Miller, K. (2009). Demographic and Economic Profile: Nonmetropolitan America. Columbia, MO: The Rural Policy Research Institute.
Miller, L. and Gur, M. (2002). Religiousness and sexual responsibility in adolescent girls. Journal of Adolescent Health 31(5): 401-406. doi:10.1016/S1054-139X(02)00403-2.
National Center for Health Statistics (1999-2001). National Vital Statistics System Detail Natality Files. edited by U.S. Department of Health and Human Services. Washington, D.C.: The Office On Women's Health Quick Health Data Online.
O'Connor, M.L. (1999). Academically oriented teenage women have reduced pregnancy risk. Family Planning Perspectives 31(2): 105-106. doi:10.2307/299 1653.
Office of Population Affairs (2005). 2005-2006 Directory: Family Planning Grantees, Delegates, and Clinics. In: Office of Population Affairs Clearinghouse. Bethesda, MD: U.S. Department of Health and Human Services.
Pennsylvania Coalition To Prevent Teen Pregnancy (2004). The State of Teen Pregnancy in Pennsylvania. Pennsylvania Coalition To Prevent Teen Pregnancy. Camp Hill.
Salas, C., Ene, L., Gregoire, T.G., Naesset, E., and Gobakken T. (2010). Modelling tree diameter from airborne laser scanning derived variables: a comparison of spatial statistical models. Remote Sensing of Environment 114(6): 1277-1285.
doi:10.1016/j.rse.2010.01.020.
Santelli, J., Lindberg, L.D., Finer, L.B., and Singh, S. (2007). Explaining recent declines in adolescent pregnancy in the United States: The contribution of abstinence and improved contraceptive use. American Journal of Public Health
97(1): 150-156. doi:10.2105/AJPH.2006.089169.
Santelli, J., Morrow, B., Anderson, J.E., and Lindberg, L.D. (2006). Contraceptive use and pregnancy risk among U.S. high school students, 1991-2003. Perspectives on Sexual and Reproductive Health 38(2): 106-111. doi:10.1363/3810606.
Santelli, J.S., Lowry, R., Brener, N.D., and Robin, L. (2000). The association of sexual behaviors with socioeconomic status, family structure, and race/ethnicity among U.S. adolescents. American Journal of Public Health 90(10): 1582-1588.
doi:10.2105/AJPH.90.10.1582.
Skatrud, J.D., Bennett, T.A., and Loda, F.A. (1998). An overview of adolescent pregnancy in rural areas. The Journal of Rural Health 14(1): 17-27. doi:10.1111/ j.1748-0361.1998.tb00858.x.
SmithBattle, L. (2007). I wanna have a good future:teen mothers' rise in educational aspirations, competing demands, and limited school support. Youth & Society
38(3): 348-371. doi:10.1177/0044118X06287962.
The Alan Guttmacher Institute (2006). Facts on American Teens' Sexual and Reproductive Health. The Alan Guttmacher Institute.
US Census Bureau (2000). Census 2000 Summary File 1 & 3, Detailed Tables.
Ventura, S.J. and Hamilton, B.E. (2011). U.S. Teenage Birth Rate Resumes Decline. In: NCHS Data Brief. Hyattsville, MD: Centers for Disease Control and Prevention. National Center for Health Statistics Statistics.
Warf, B. and Winsberg, M. (2008). The geography of religious diversity in the United States. The Professional Geographer 60(3): 413-424. doi:10.1080/00330120802 046786.
Wheeler, D.C. and Paez, A. (2010). Geographically weighted regression. In: Fischer, M.M. and Getis,A.(eds.) Handbook of applied spatial analysis: software tools, methods and applications. Springer Verlag: 461-486. doi:10.1007/978-3-642-03647-7_22.
Williams, R. (2011). Multicollinearity. University of Notre Dame. http://www.nd. edu/~rwilliam/xsoc63993/l11.pdf.
Young, T., Turner, J., Denny, G., and Young, M. (2004). Examining external and internal poverty as antecedents of teen pregnancy. American Journal of Health Behavior 28(4): 361-373. doi:10.5993/AJHB.28.4.8.