313 1. Introduction
Nowadays, the use of solar panels is increasing by consumers of electrical energy and in order to make better use of them, it is necessary to increase their efficiency. Most of the power distribution systems in the current world have reached their maximum capacity rating due to excessive energy consumption [1-4]. Raising energy consumption causes major problems such as poor voltage regulation and voltage drop, which are major issues in these networks. On the other hand, the issue of imbalance due to single-phase loads in the network is inevitable. Therefore, reactive injections can be used to compensate for the output of PV-connected inverters in the duration of the night and the cloudiness of the day-time [5, 6]. Cloud motion estimation and solar irradiance prediction are proposed in [7]. Forecasting of PV generation depends on solar irradiances and weather conditions would play a vital role in the interconnection of the PV generators to power grid. In particular, these PVs will be distributed
throughout the grid [8]. In some of the current distribution systems, the supply of electrical power in addition to the main network is also provided by distributed generation systems such as PV systems. Since the PV system has the ability to produce reactive power proportional to the power factor in certain circumstances, by setting the zero power factor on the inverter connected to the PV, it can produce a relatively pure reactive power. Therefore, these PV-based inverters that generate reactive power can be PV-based D-Statcoms. The D-Statcoms are custom power devices to inject reactive power to the load buses. In this case, there are able to regulate the voltage of the bus and improve the voltage profile along the network feeder [9]. The use of reactive power injection of the multiple D-Statcoms to improve the voltage profile along a single-phase radial distribution feeder is demonstrated in [10, 11]. The optimal model of the phase angle and allocation technique of multiple D-Statcoms in distribution system for
Click here, type the title of your paper, Capitalize first letter of each words
First Author
a, Second Author
b,*aFirst affiliation, Address, City and Postcode, Country b
Second affiliation, Address, City and Postcode, Country
Journal of Solar Energy Research Vol 3 No 4 (2018) 313-323
Journal of Solar Energy Research (JSER)
Journal homepage: jser.ir
A B S T R A C T
Click here and insert your abstract text. Click here and insert your abstract text. Click here and insert your abstract text. Click here and insert your abstract text. Click here and insert your abstract text. Click here and insert your abstract text. Click here and insert your abstract text. Click here and insert your abstract text. Click here and insert your abstract text. Click here and insert your abstract text. Click here and insert your abstract text. Click here and insert your abstract text. Click here and insert your abstract text. Click here and insert your abstract text. Click here and insert your abstract text. Click here and insert your abstract text. Click here and insert your abstract text. Click here and insert your abstract text. Click here and insert your abstract text. Click here and insert your abstract text. Click here and insert your abstract text Click here and insert your abstract text Click here and insert your abstract text Click here and insert your abstract text Click here and insert your abstract text Click here and insert your abstract text ARTICLE INFO
Received:
Received in revised form: Accepted:
Available online:
Keywords: Type 3-6 keywords here,
separated by semicolons ;
PV-Based Multiple D-Statcoms Control in Unbalanced Distribution
Network
S. M. Hosseini Jebelli
a, M. Banejad
a,*, A. Dastfan
a, A. Alfi
aaDepartment of Electrical and Robotic Engineering, Shahrood University of Technology, Shahrood, Iran,*Email: m.banejad
@shahroodut.ac.ir
Journal of Solar Energy Research (JSER)
Journal homepage: www.jser.ut.ac.ir
A B S T R A C T
The penetration level of the photovoltaic (PV) systems is growing in the distribution networks throughout the world. On the other hand, the voltage drop across the feeder and the voltage imbalance are important issues in radial distribution networks. One of the most effective methods to deal with these problems is reactive power injection by PV-based multiple distributed static compensators (D-Statcom). Hence, a method based on the integral to droop line algorithm, which can regulate the reactive current injection for the voltage control by optimizing the droop coefficient and integral gain, has been proposed in this paper. Therefore, genetic algorithm (GA) is used to minimize the voltage deviation (VD) and voltage unbalanced factor (VUF). The proposed method has been simulated and evaluated on the typical low voltage (LV) 3-phase distribution network. The results indicate that the voltage profile along the feeder has been improved from a poor range to the acceptable range of 0.95 to 1.05, and therefore VUF’s reach to under 0.15. Hence, optimal use of PV-Dstatcom’s capacity and validity of the mentioned method are obtained.
© 2018 Published by University of Tehran Press. All rights reserved.
ARTICLE INFO
Received: 16 Oct 2018 Received in revised form: 14 Dec 2018
Accepted: 15 Dec 2018 Available online: 15 Dec 2018
Keywords:
Integral to Droop Line Controller;
314 the optimal reactive power compensation has been addressed in [12]. A novel smart inverter PV-Statcom in which a PV inverter can be controlled and utilized to provide voltage control during critical mode of the system [13]. In paper [14], the impact of residential distributed energy resources such as PV on the power quality (e.g. unbalance factor) is investigated in four feeder types of the electrical LV distribution network in Flanders, Belgium. The paper [15] is proposed a planning strategy of D-Statcom in unbalanced radial distribution systems for optimal D-Statcom placement and rating. The paper [16] has been investigated the effect of the D-Statcom allocation on the system power loss in an unbalanced radial distribution system. In [17] the D-Statcoms are optimally placed in unbalanced radial distribution system (UBRDS) using sensitivity approaches with an objective of improving the reactive loading capability of the network with maintaining voltage profile in an acceptable limit. A stationary-frame control method for voltage unbalance compensation in an islanded microgrid is proposed in [18]. This method is based on the proper droop control of DGs interface converters. The D-Statcoms can be controlled to operate on steady-state droop lines [19, 20] to satisfy appropriate sharing of reactive power among them.
Since the actual grid network is unbalanced, the study of the impact of multiple PV-based D-Statcoms on the VUF is important. In this paper, the PV-based D-Statcoms are installed on all buses of the unbalanced network, and the integral controller on the drop characteristic is used to calculate the reactive current of the D-Statcoms. The important parameters in the controller are the droop coefficient and integral gain. Perera et al [11] proposed the mathematical model of the controller and assumed the droop coefficients and integral gains as constant values. Although, the voltage profile in the single-phase feeder was improved, this model was not investigated in three-phase UBRDS via VUF consideration.
In this paper, the use of multiple D-Statcoms to support voltage along three-phase LV (i.e. 220 V) UBRDS is analyzed. The optimum values of the droop coefficients corresponding to the line characteristics and the integral gains corresponding to the reactive capacity of each D-Statcoms are obtained by the genetic optimization algorithm. The objective function is minimized in the GA, which includes the VUF and the bus voltage deviation. A typical network with multiple D-Statcoms and the integral to droop line (IDL) controller has been
simulated in MATLAB software and the results have been discussed and evaluated.
The rest of this paper is organized as follows. In the second section of the paper, the typical network structure, modeling the D-Statcoms and IDL controller design are described. In the third section, the optimization problem and GA are detailed. In the fourth section, the optimal solutions of the droop coefficient and the integral gain in the GA optimization have been determined, and in Section 5, in order to evaluate the performance of the optimal yielded solutions, the proposed method is simulated in the Matlab software environment and the results of this study are presented and discussed.
2. Network and controller structure
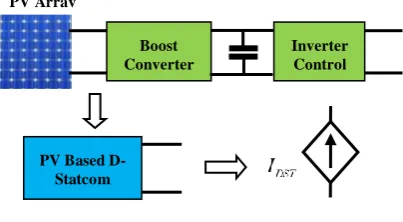
2.1. PV-based D-Statcom model in the network The reactive power in the D-Statcom, which is proportional to the reactive current, can be modeled with a controlled current source [9]. Fig. 1 shows the equivalent model of a PV-based inverter. According to this figure, the inverter connected to the PV is considered as a PV-based D-Statcom. The reactive current of the DStatcom depends on the value of droop coefficient, integral gain as well as the magnitude and angle of the bus voltage. Therefore, the reactive current generated by PV-DStatcom can be modeled with a dependent current source.
Figure 1. Equivalent model of the PV-based D-Statcom
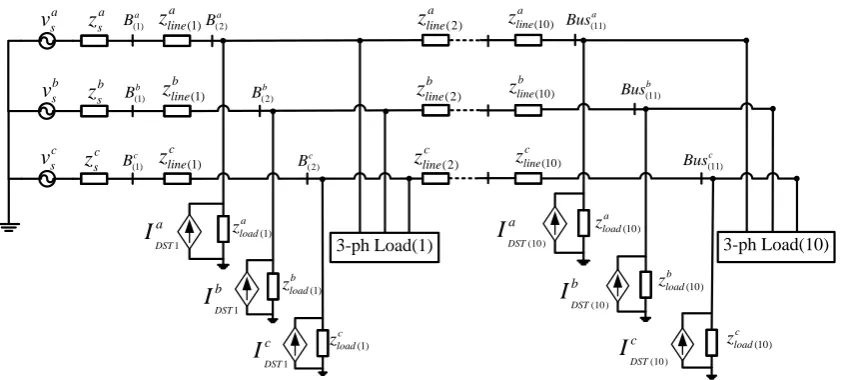
Fig. 2 shows a three-phase LV UBRDS with PV-based single-phase multiple D-Statcoms. The D-Statcoms are modeled as dependent current sources. The number of buses is 11 in each phase and the first bus is the source bus, so the number of load buses as well as the number of D-Statcoms is 10 in each phase. In the Fig. 2, Vsa, Vsb and Vscare
the three-phase source voltages, respectively, and so the Zsa, Zsb and Zsc are the source impedances,
respectively.
The Impedances Zline are the line impedances
and the Impedances Zload are the single-phase loads.
All of the loads shown in this network are assumed to be lumped loads and constant impedance models. The dependent current sources IDST are the
reactive currents of the D-Statcoms.
PV Based D-Statcom
Boost Converter
315
3-ph Load(1) 3-ph Load(10)
1 DST a
I
1 DST cI
1 DST bI
a s z b s z c s z (1) aB zlinea (1) (2) a
B zlinea (2) (10)
a line z (11) a Bus a s v b s v c s v (1) b line z (1) c line z (1) b B (1) c B (2) b B (2) c B (1) a load z (1) b load z (1) c load z (2) b line z (2) c line z (10) b line z (10) c line z (11) b Bus (11) c Bus (10 ) DST a
I
(10 ) DST bI
(10 ) DST cI
(10) a load z (10) b load z (10) c load zFigure 2. Network model with PV-based multiple D-Statcoms
2.2. IDL controller design for D-Statcom in UBRDS
The reactive power Q generated by the D-Statcom is obtained by multiplying proportional gain and the voltage error according to the control law as follows
( )
p ref
QK V V (1)
where Kp is the proportional gain coefficient, Vref is
the reference voltage and V is the measured bus voltage. A larger Kp gain results in higher
utilization of the D-Statcom for a range of loading. If only a proportional controller is used to generate reactive power in the D-Statcom, increasing the Kp results in the voltage fluctuation
of the output to reach the reference voltage, which causes the system to be unstable [11]. Changing the variable Kp to m leads to that the voltage control
rule will not be sensitive to increased gain (Kp), and
therefore voltages will not fluctuate.
The steady-state droop characteristic for each D-Statcom can be obtained as
ref
V
V
m Q
(2)where m is droop coefficient and Q is reactive power generated by the D-Statcom.
This droop line equation shows the voltage drop of each bus as the voltage drop coefficient of the reference voltage. While d subscript is the number of the bus connected to D-Statcom, the steady-state droop line voltage of dth D-Statcom is described by
,
dr d ref d d
V V m Q (3)
A time domain simulation is performed on MATLAB with a 0.02 s time step. As measured phasor quantities can be updated once per
fundamental cycle, it is appropriate to analyze the system in discrete time domain [11] . Thus, the following analysis is performed in discrete time domain.
Droop line voltage, Vdr,d(k) corresponding to that
reactive power injection in kth step can be found as
, ( ) ( )
dr d ref d d
V k V m Q k (4)
The reactive power generation Q in (4) makes it difficult to linearise the system [11]. Therefore Qd is replaced with capacitive current injection Id, to create the modified steady-state droop line in kth step is given by
, ( ) ( )
dr d ref d d
V k V m I k
(5)
For the UBRDS under study, the equation (5) can be expressed as three-phases for the bus
voltages in
separated phases in kth step as follows
, , , ( ) ( ) ( ) ( ) ( ) ( ) d ref dr d
dr d ref d d
dr d ref
d
a a
a
b b abc b
c c c
I k
V
V k
V k V m I k
V k V I k
(6)
where a, b ,c and abc superscripts refer to the three-phase, so the droop coefficient matrix is defined as
0
0
0
0
0
0
d d d a abc b d cm
m
m
m
(7)where mad , mbd and mcd are the droop coefficient
316 respectively. In this case study the Dimension of these droop coefficient matrices is 10×10. While |Vad(k)|, |Vbd(k)| and |Vcd(k)| are considered as the
magnitude of the dth bus measured voltages in kth step for phases A, B and C, respectively, the voltage error of the dth bus in kth step is obtained from the steady-state droop characteristic for each phase as follows
, , , , , , ( ) ( ) ( ) ( ) ( ) ( ) ( ) ( ) ( ) d dr d dr d
dr d dr d d
dr d dr d
d a
a a
b b b
c c c
V k
V k V k
V k V k V k
V k V k V k
(8)
The aim of using integral controller to minimize this error to zero and bring the instantaneous droop line to the steady-state droop line. The required capacitive current injection Id in the (k + 1)th step
is generated by
,
,
,
, 1
( 1) ( )
( 1) ( )
( )
( 1)
d
dr d
d dr d
dr d d
a a
k
b abc b
i d h
c c
I k V h
I k K V h
V h I k
(9)where Kabci,d is the three-phase integral gain matrix
in kth step of the IDL controller and is defined as
, , , , 0 0 0 0 0 0 i d i d i d a abc b i d c K K K K (10)
where Kai,d, Kbi,d and Kci,d are the integral gains of dth D-Statcom for phases A, B and C, respectively. In this case study the Dimension of these integral gain matrices is 10×10. The capacitive current injection must lag the respective bus voltage by π/2. Therefore, the angle θi of the injected current for kth iteration is updated as
, ,
, ,
, ,
( 1) ( )
( 1) ( )
( 1) ( )
i d v d
i d lag v d
i d v d
a a
b abc b
c c k k k k k k (11)
where θlag=[π/2 ; π/2 ; π/2 ]T is the constant column
vector, θa
v,d , θbv,d and θcv,d are the angles of the dth
bus measured voltages in step k for phases A, B and C, respectively. After the formation of the network bus current (IBus) to be consisted of source and
compensating current and calculating the admittance matrices (YBus), the bus voltages (Vn) in
the (k + 1)th step for each phase are finally updated as
1 3 3
3 1 3 1
( 1) ( 1)
( 1) ( 1)
( 1) ( 1)
bus bus bus a a n b b
n Bus n n
c c
n n
n
I k
V k
V k Y I k
V k I k
(12)
The admittance matrix (YBus) of the network is
defined as follows
3 30 0 0 0 0 0 bus bus bus a n n b
Bus n n
c
n n n n Y Y Y Y (13)
where “n” is the number of the buses in each phase and “d” is the number of D-Statcom. The values of “n”and “d” in this paper are respectively 11 and 10.
3. Optimization problem
The GA method has been used to determine the optimal values of the droop coefficient and the integral gain. In order to generate desired reactive currents by the D-Statcoms, the optimal droop coefficient and integral gain must be obtained. These coefficients are obtained after calculating the bus voltages from (12) by evaluating a given objective function. The GA Optimization method has been used to obtain the optimal coefficients and gains.
3.1. GA optimization
The Genetic Algorithm was presented by John Holland [21], which is bio-inspired artificial intelligence class, stochastic and population-based algorithm. The algorithm typically applied to hard problems with a large search space and/or discrete optimization. GA is a common algorithm with appropriate (low speed) convergence and high precision which used that various applications in many research studies. As the algorithm is used in offline mode, the high precision is more important than high speed convergance. Therefore, GA is a useful approach for this application [21,22]. The pseudo-code for GA procedure is represented as follows
Pseudo-code for GA steps BEGIN
* INITIALISE population with random candidate solutions;
* EVALUATE each candidate;
* REPEAT Until (Termination Condition is satisfied) DO
** 1 SELECT parents
** 2 RECOMBINE pairs of parents; ** 3 MUTATE the resulting offspring; ** 4 EVALUATE new candidates;
317 In EVALUATE step of the above-mentioned pseudo-code, it is necessary to introduce an objective function. The details of this objective function are presented in the next section.
3.2. Objective function
3.2.1. Voltage unbalanced factor
After calculating the bus voltages phasors from (12), the positive “V+” and negative “V-” voltage sequences can be achieved by the Fortescue transformation [23]. According to the definition, the voltage unbalanced factor for nth bus is obtained as follows
n n
n
V VUF
V
(14)
3.2.2. Voltage deviation
The voltage deviation for nth bus is equal to the absolute value of the difference |Vn| from Vref as is
given by
n n ref
VD V V (15)
where |Vn| is the voltage magnitude of nth bus and Vref is the reference voltage.
3.2.3. Normalization of the indices
In order to normalize VUF at all buses, the ratio of the VUF summation with compensating to the VUF summation without compensating is considered as follows
1
1 bus
i
bus N
With DStatcom
i N
No DStatcom i i
VUF VUF
VUF
(16)where i is the number of the bus and Nbus is the
total number of three-phase buses. Similarly, the voltage deviation is obtained by
1
1 bus
i
bus
i N
With DStatcom
i N
NO DStatcom
i VD VD
VD
(17)According to (16) and (17), the normalized values of VUF and VD indices are non-negative integers and also do not have any dimension. Therefore, the objective function equal to the weighted summation of the normalized VUF and normalized VD indices is proposed as (18). Thus the objective function and constraints used in the optimization program are defined as the following relationships
1 2
, minimize :
n i
m K F w VUF w VD
(18)
min max
,min , ,max
, 1, , subject to :
, 1, ,
abc
d dst
abc
i i d i dst
m m m d N
K K K d N
(19)
where w1 and w2 are weight coefficients such that
w1+w2=1, w1=0.5, w2=0.5, mabcd is the 3-phase
droop coefficient vector for dth bus, mmin is the
minimum value of droop coefficient, mmax is the
maximum value of droop coefficient, Ki,min is the
minimum value of integral gain, Ki,max is the
maximum value of integral gain and Ndst is the
number of D-Statcom devices.
Here, the purpose of the genetic optimization algorithm is to minimize the objective function (18), so that the coefficients are set at specified intervals. Using the GA algorithm, the optimal values of mn and Ki are obtained based on
minimizing the voltage deviation and the VUF index in the whole system.
Accordingly, two groups of the control variables used in GA are defined for the 30 D-Statcoms. Appropriately 30 variables for the droop coefficient and 30 variables for the integral gain are determined, according to the diagram shown in Fig. 3.
m1 m2 … m30 Ki1 Ki2 … Ki30
Figure 3. Schematic diagram of control variables In the sub-section 3.1., EVALUATE step of the pseudo-code relationships (6), (8), (9), (11), (12) and (18) consecutively are used for evaluation. 4. Optimal solutions
4.1. Test results of GA algorithm for IDL controller The considered model is tested for ten D-Statcoms in the network according to the system is shown in Fig. 2. A time domain simulation is realized on MATLAB software with a 0.02 s time step. The parameters applied for the simulation study are listed in Table 1.
318
Table1. Parameters* applied in simulation study with integral to droop line controller Variable Value Unit
SBase 10 KVA
VBase 220 V
ZBase 4.84 Ω
Source Voltage (VS) 1.05 pu
Reference Voltage (Vref) 1.04 pu
Source Impedance(ZS) (1.74+7.58j)×10-3 pu
Line Impedance (×10-4) pu
From To Phase-A (×10-4) Phase-B (×10-4) Phase- C
(×10-4)
Bus 1 Bus 2 243+495j 242+494j 242+494j
Bus 2 Bus 3 242+494j 243+495j 242+494j
Bus 3 Bus 4 244+496j 252+494j 243+495j
Bus 4 Bus 5 252+494j 254+496j 254+496j
Bus 5 Bus 6 252+494j 254+496j 253+495j
Bus 6 Bus 7 243+495j 242+494j 242+494j
Bus 7 Bus 8 242+494j 243+495j 242+494j
Bus 8 Bus 9 244+496j 252+494j 243+495j
Bus 9 Bus 10 252+494j 254+496j 254+496j
Bus
10 Bus 11 252+494j 254+496j 253+495j
Load Impedance pu
Bus No. Phase A Phase B Phase C
Bus 2 2.90+1.90j 2.08+1.44j 1.88+1.28j
Bus 3 2.43+1.71j 1.76+1.42j 1.51+1.26j
Bus 4 1.66+1.35j 1.76+1.42j 1.68+1.59j
Bus 5 1.98+1.87j 1.68+1.59j 1.26+1.01j
Bus 6 1.53+1.19j 1.51+1.43j 1.50+1.41j
Bus 7 2.61+1.71j 2.08+1.44j 1.88+1.28j
Bus 8 2.19+1.54j 1.76+1.42j 1.51+1.26j
Bus 9 2.07+1.69j 1.41+1.14j 1.51+1.26j
Bus 10 1.98+1.87j 1.68+1.59j 1.10+1.96j
Bus 11 1.53+1.19j 1.68+1.59j 1.50+1.41j
*
Further information on this system is available to the authors
The desirable convergence in the fitness function after 200 iterations has been observed, so that the fitness value has been reached from 1.54 to 1.32. The optimal solutions of the droop coefficient and the integral gain are obtained according to the Table 1 of the Appendix A.
Fig. 5 shows the average of the optimal coefficients (mn) and integral gains (Ki) of three
D-Statcoms in each bus of the 3-phase buses. It is observed that the average values of mn are about
0.05 and the average values of Ki are between 0.3
and 0.8. The average values of the mn and Ki
implicitly show the required D-Statcoms capacity in each bus. Also, it is noticeable that the average of the droop coefficients for the end bus are higher than the other buses, hence the end bus of the feeder has a lower coefficient of droop. The average values of the integral gains indicate that
the middle buses need more integral gain than the buses at the beginning and end of the feeder .
5. System performance evaluation
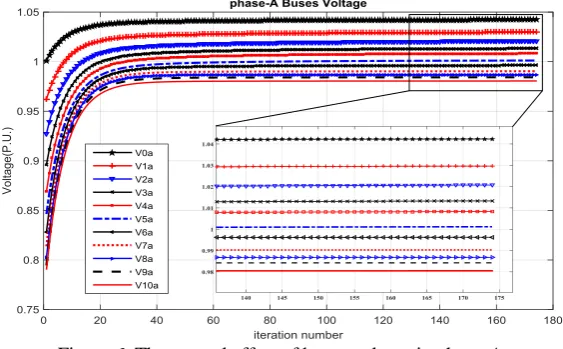
Applying the optimal values of Appendix Table 1 to the corresponding D-Statcoms in the above mentioned network, the reactive current of D-Statcom is generated and injected into the corresponding bus . The control efforts are shown in Fig. 6, Fig. 7 and Fig. 8 for reaching the bus voltage to the reference voltage. The Figures show the rising voltage of the buses in all three phases. In each of the figures, V0 represents the source bus,
and the others are related to the bus voltage 1 to 10 in the network. In the case of no compensator, the voltages V1 to V10 be less than the permissible limit
319
Figure 4. The convergence of the best fitness
Figure 5. Average of the optimal coefficients and gains of D-Statcoms vs. 3-phase bus number
Figure 6. The control effort of buses voltage in phase-A
algorithm, the bus voltages are at the permissible limit.
As it can be observed in Fig. 6, in the control effort of the phase-A voltages based on the performance of the IDL controller, the voltage
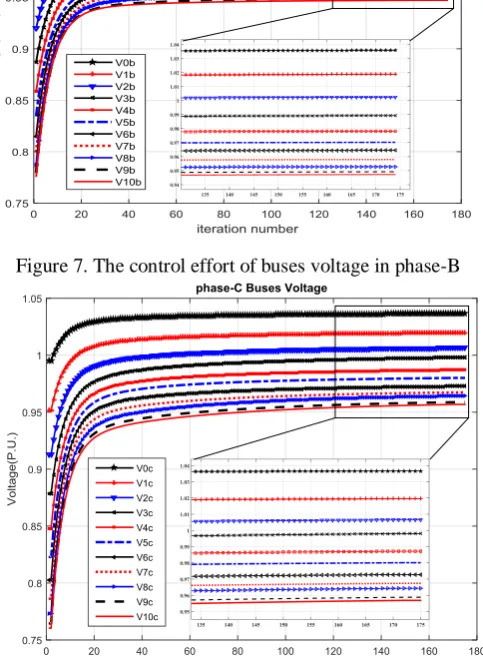
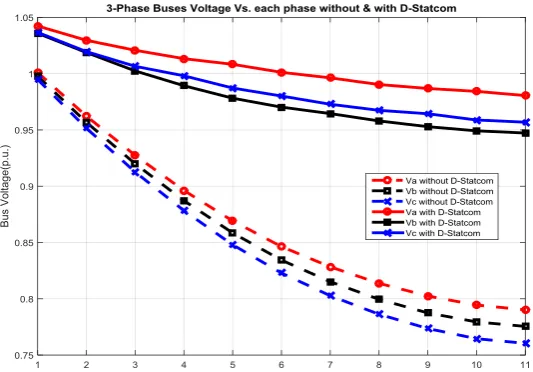
320 1.035 pu and at the ending bus rises from 0.78 to 0.95 pu. In the control effort of phase-C voltages shown in Fig. 8, the voltage magnitude at the beginning bus of the feeder rises from 0.99 to 1.036 pu and at the ending bus rises from 0.76 to 0.96 pu. It is noticeable that all voltages shown in the Fig. 6, Fig. 7 and Fig. 8 are within the permissible range (0.95 to 1.05 pu). In order to compare the bus voltages in two cases without compensator and with compensator, the bus voltage profile is shown in Fig. 9. In this figure, the voltages of all buses in the compensating mode are in the permissible limit compared to the non-compensating mode. It is also noticeable that the voltage profile has been improved in compensating mode compared to the non-compensating mode. In the Fig. 10, it is observed that the indices of the VUF in the
compensating mode have completely decreased compared to the non compensating mode.
The reactive currents generated by multiple D-Statcoms are shown in Fig. 11. Each bus has three currents associated with each single-phase D-Statcom.
In the Fig. 11, it is seen that the demand for reactive current in the ending bus of feeder is higher than the beginning bus, because this is due to the voltage drop of the end of the feeder. Hence, the end nodes of feeder need more reactive currents. In addition to improving the voltage profile, these reactive currents lead to a reduction in the voltage imbalance of the three-phase point of view.
Figure 7. The control effort of buses voltage in phase-B
321
Figure 9. Voltage magnitude of buses for each phase (Dashed lines: without Statcom, Solid lines: with D-Statcom)
Figure 10. Voltage unbalanced Factor vs. bus number
322 6. Conclusions
In this paper, PV-DStatcom is used to compensate for the reactive power of loads of the unbalanced distribution network. Considering reactive current injection by multiple PV-DStatcoms which are situated in network buses results in the voltage control of these nodes. In order to control the multiple D-Statcoms, the integral algorithm has been used on the droop line characteristics. In this algorithm, the value of reactive current can be calculated by adjusting the droop coefficient and integral gain. Using the GA optimization, the optimal coefficient and gain is obtained. The objective function in the algorithm is defined as voltage deviation and VUF in buses. Calculating optimal coefficient and gain values and applying them to the multiple D-Statcoms, lead to provide efficient reactive currents for injecting to the load buses. In this paper, it is assumed that each of the loads is modeled by constant impedance as well as the location of the PVs is considered as uniform on the network. Also, for the sake of simplicity the control rule in the D-Statcom, the reactive current is used instead of the reactive power. The simulation results clearly show that the buses voltages along the feeder have been improved from a range of 0.75 to 1 to an acceptable range of 0.95 to 1.05. Moreover, VUF has dropped from a range of 0.2 to 0.9 to less than 0.2. Therefore, the voltage profile along the feeder in each phase has been improved and the imbalance factor has decreased in the buses compared to the non-DStatcom mode. Optimal values of the droop coefficients and integral gainsincrease the ability of multiple D-Statcoms to maintain the voltage and overcome the VUF of the corresponding bus. Accordingly, these advantages clearly highlight the optimal use of PV-Dstatcom's capacity on the LV distribution network.As a future work, other load models such as ZIP can be used instead of the location of the PVs can be considered as random instead of the uniform on the network.
References
[1] G. Makrides, B. Zinsser, M. Norton, G. E. Georghiou, M. Schubert, and J. H. Werner, "Potential of photovoltaic systems in countries with high solar irradiation," Renewable and Sustainable energy reviews, vol. 14, pp. 754-762, 2010. [2] A. Hoke, R. B. J. Hambrick, and B. Kroposki, "Maximum photovoltaic penetration levels on typical distribution feeders," National Renewable Energy Laboratory: Golden, CO, USA, 2012. [3] S. M. Besarati, R. V. Padilla, D. Y. Goswami, and E. Stefanakos, "The potential of harnessing solar radiation in Iran: Generating solar maps and
viability study of PV power plants," Renewable energy, vol. 53, pp. 193-199, 2013.
[4] B. S. Kumar and K. Sudhakar, "Performance evaluation of 10 MW grid connected solar photovoltaic power plant in India," Energy Reports, vol. 1, pp. 184-192, 2015.
[5] H. Li, C. Wen, K.-H. Chao, and L.-L. Li, "Research on Inverter Integrated Reactive Power Control Strategy in the Grid-Connected PV Systems," Energies, vol. 10, p. 912, 2017.
[6] Y. Libin, L. Xin, Z. Ming, T. Yun, Y. Xin, Z. Yutian, et al., "A New Theory of Reactive Power Control of Grid Connected PV Inverter," International Conference on Intelligent Transportation, Big Data and Smart City (ICITBS), pp. 35-38, 2015.
[7] Z. Peng, S. Yoo, D. Yu, and D. Huang, "Solar irradiance forecast system based on geostationary satellite," IEEE International Conference on Smart Grid Communications (SmartGridComm), pp. 708-713, 2013.
[8] H. K. Yadav, Y. Pal, and M. Tripathi, "Photovoltaic power forecasting methods in smart power grid," Annual IEEE, India Conference (INDICON), pp. 1-6, 2015.
[9] A. Ghosh and G. Ledwich, Power quality enhancement using custom power devices, Springer Science & Business Media, pp. 407-417, 2012. [10] L. B. Perera, G. Ledwich, and A. Ghosh, "Distributed DSTATCOMs for distribution line enhancement," 21st Australasian Universities, Power Engineering Conference (AUPEC), pp. 1-6, 2011.
[11] L. B. Perera, G. Ledwich, and A. Ghosh, "Multiple distribution static synchronous compensators for distribution feeder voltage support," IET generation, transmission & distribution, vol. 6, pp. 285-293, 2012.
[12] J. Sanam, A. Panda, and S. Ganguly, "Optimal phase angle injection for reactive power compensation of distribution systems with the allocation of multiple distribution STATCOM," Arabian Journal for Science and Engineering, vol. 42, pp. 2663-2671, 2017.
[13] R. K. Varma and E. M. Siavashi, "PV-STATCOM-A New Smart Inverter for Voltage Control in Distribution Systems," IEEE Transactions on Sustainable Energy, vol. 9, pp. 1681 - 1691, 2018.
323 International Journal of Numerical Modelling: Electronic Networks, Devices and Fields, p. e2351, 2018.
[16] P. Samal, S. Mohanty, and S. Ganguly, "Effect of DSTATCOM allocation on the performance of an unbalanced radial distribution systems," IEEE International Conference on Engineering and Technology (ICETECH), pp. 927-931, 2016. [17] A. R. Gupta and A. Kumar, "Impact of D-STATCOM placement on improving the reactive loading capability of unbalanced radial distribution system," Procedia technology, vol. 25, pp. 759-766, 2016.
[18] M. Savaghebi, A. Jalilian, J. C. Vasquez, and J. M. Guerrero, "Autonomous voltage unbalance compensation in an islanded droop-controlled microgrid," IEEE Transactions on Industrial Electronics, vol. 60, pp. 1390-1402, 2013.
[19] J. C. Vasquez, R. A. Mastromauro, J. M. Guerrero, and M. Liserre, "Voltage support
provided by a droop-controlled multifunctional inverter," IEEE Transactions on Industrial Electronics, vol. 56, pp. 4510-4519, 2009.
[20] J.-J. Seo, H.-J. Lee, W.-W. Jung, and D.-J. Won, "Voltage control method using modified voltage droop control in LV distribution system," Transmission & Distribution Conference & Exposition: Asia and Pacific, pp. 1-4, 2009. [21] J. Holland, Adaptation in Natural and Artificial Systems: An Introductory Analysis with Applications to Biology, Control and Artificial Intelligence, ed: MIT Press, Cambridge, MA, 1992. [22] M. Tabassum and K. Mathew, "A genetic algorithm analysis towards optimization solutions," International Journal of Digital Information and Wireless Communications, vol. 4, pp. 124-143, 2014.
[23] H. Saadat, Power system analysis, Vol. 2., WCB/McGraw-Hill, Singapore, pp, 397-406, 1999.
Appendix A.
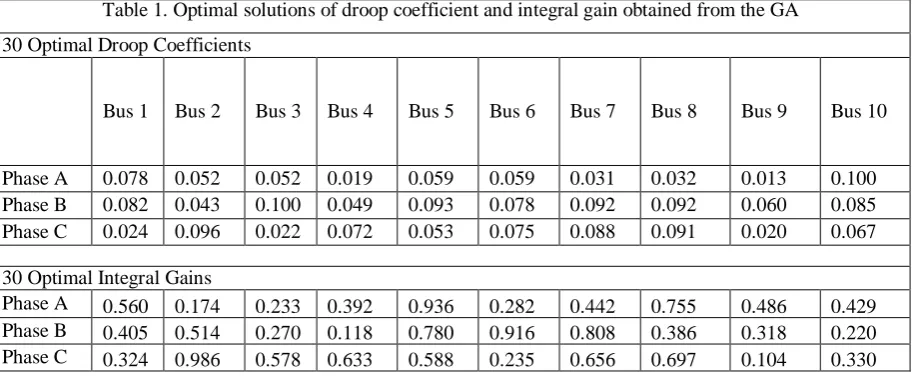
Table 1. Optimal solutions of droop coefficient and integral gain obtained from the GA 30 Optimal Droop Coefficients
Bus 1 Bus 2 Bus 3 Bus 4 Bus 5 Bus 6 Bus 7 Bus 8 Bus 9 Bus 10
Phase A 0.078 0.052 0.052 0.019 0.059 0.059 0.031 0.032 0.013 0.100
Phase B 0.082 0.043 0.100 0.049 0.093 0.078 0.092 0.092 0.060 0.085
Phase C 0.024 0.096 0.022 0.072 0.053 0.075 0.088 0.091 0.020 0.067
30 Optimal Integral Gains
Phase A 0.560 0.174 0.233 0.392 0.936 0.282 0.442 0.755 0.486 0.429
Phase B 0.405 0.514 0.270 0.118 0.780 0.916 0.808 0.386 0.318 0.220