of peer-reviewed research and commentary in the population sciences published by the Max Planck Institute for Demographic Research Konrad-Zuse Str. 1, D-18057 Rostock · GERMANY www.demographic-research.org
DEMOGRAPHIC RESEARCH
VOLUME 12, ARTICLE 13, PAGES 323-380
PUBLISHED 28 JUNE 2005
www.demographic-research.org/Volumes/Vol12/13
DOI: 10.4054/DemRes.2005.12.13
Research Article
Geographical diversity of cause-of-death
patterns and trends in Russia
Jacques Vallin
Evgeni Andreev
France Meslé
Vladimir Shkolnikov
1 Introduction 324
2 Data and methods 335
2.1 Grouping causes of death 335
2.2 Hierarchical cluster analysis 336
2.2.1 Period-specific geographical patterns 338
2.2.2 Time-scale overall geographical patterns 339
3 To each period its own geographical pattern of
causes of death
339
3.1 1969-1970 342
3.2 1978-79 344
3.3 1988-89 346
3.4 1993-94 348
4 Constant geographical contrasts 350
5 Four main clusters explanatory of how
geographical contrasts contribute to general mortality dynamics
358
5.1 Mortality dynamics by clusters 358
5.2 Contribution of geographical dynamics to
all-Russia mortality changes
363
6 Conclusion 365
7 Acknowledgements 367
References 368
Annex I 371
Annex II 374
Annex III 378
Geographical diversity of cause-of-death
patterns and trends in Russia
Jacques Vallin 1
Evgeni Andreev 2
France Meslé 3
Vladimir Shkolnikov 4
Abstract
This paper performs a systematic analysis of all currently available Russian data on mortality by region, census year (1970, 1979, 1989, and 1994) and cause of death. It investigates what links may be found between these geographical variations in cause-specific mortality, the negative general trends observed since 1965, and the wide fluctuations of the last two decades. For that, four two-year periods of observation were selected where it was possible to calculate fairly reliable mortality indicators by geographic units using census data for 1970, 1979, 1989, and micro-census data for 1994, and a clustering model was used.
Behind the complexity of the studied universe, three main conclusions appeared. Firstly, in European Russia, there is a stark contrast between south-west and north-east, both in terms of total mortality and of cause-of-death patterns. Secondly, analysis of overall cause-of-death patterns for all periods combined clearly confirms that contrast at the whole country level by the prolongation of the southern part of European Russia through the continuation of the black soil (“chernoziom”) belt along the Kazakhstan border, while the rest of Siberia presents a radically different picture to European Russia. Thirdly, while it is difficult to infer any permanent geographical pattern of mortality from that very fluctuating piece of history, 1988-89 appears to be a base period for at least the entire period from 1969-1994.
1 Institut national d'études démographiques, E-mail: [email protected]
2 Centre of Demography and Human Ecology, Moscow, E-mail: [email protected]
3 Institut national d'études démographiques, E-mail: [email protected]
1. Introduction
Russian life expectancy has been stagnating for females and declining for males since the mid-1960s, with a wide fluctuation in the 1980s and 90s related to the 1985 anti-alcohol campaign and the 1992-93 socio-economic crisis (Figure 1). The long-run adverse trends are mainly due to increases in cardiovascular diseases, alcohol-related mortality and violent deaths (Shkolnikov et al., 1996; Meslé et al., 2003). Changes in alcohol consumption are responsible for the abrupt rise in life expectancy observed in 1985-86, and the subsequent decrease of 1990-92 (Meslé et al., 1994; Shkolnikov and Nemtsov, 1997; Leon et al. 1997), while the even sharper decrease observed in 1992-94 stems from more varied causes of death, and is involved with social and economic difficulties encountered by individuals and families in the transition to a market economy (Meslé et al., 1998; Shkolnikov et al., 1998; Gavrilova et al., 2001). With adaptation of people to the new economic situation, life expectancy returned to its previous levels, but since 1998, it has resumed its long-term downwards trend (Meslé et
al., 2003).
It is, however, a matter of record that mortality varies within Russia from place to place. Patterns of regional mortality variation have been documented in a number of studies (Andreev, 1979; Shkolnikov, 1987; Shkolnikov and Vassin, 1994; Vassin and Costello, 1997; Jozan and Prokhorskas,1997;Walberg et al.,1998).
The general pattern of mortality increase from south-west to north-east, with lower mortality in the blacksoil regions of southern European Russia and the southern part of West Siberia, and higher mortality in northern European Russia, Ural, Siberia and the far East, was identified by Evgueni Andreev (1979) from 1970 data, and by Vladimir Shkolnikov (1987) from mortality data around the all-Soviet censuses of 1970 and 1979. The latter study found correlations between this geographical pattern and inter-regional differences in general socio-economic development, climate conditions, and alcohol consumption. Studies by Vladimir Shkolnikov and Serguei Vassin (1994), and by Peter Jozan and Remigijus Prokhorskas (1997), described geographical patterns of mortality from principal and “avoidable” causes around the following census of 1989. Serguei Vassin and Christine Costello (1997) used the same data to classify Russian regions by the shapes of their mortality age curves. Finally, Peder Walberg et al. (1998) analyzed decreases in male life expectancy from 1989 to 1994 (the last Russian micro-census) across regions of European Russia, and found some associations between these decreases and the acuity of labor market changes.
fluctuations of the last two decades. For that, four two-year periods of observation were selected where it was possible to calculate fairly reliable mortality indicators by geographic units using census data for 1970, 1979, 1989, and micro-census data for 1994. As Figure 1 shows, 1970 may be taken as the base year (1965 would have been preferable, but it is not a census year); 1979 is the closest census year prior to the anti-alcohol campaign; 1989 is fairly representative for the highest post-campaign life expectancy, and 1994 is the lowest point at the peak of the socio-economic crisis. Unfortunately, no reliable geographic mortality data are available for the most recent years 5. However, these four points may already go a long way to explaining the relationships between time changes in life expectancy and geographical variations of mortality.
Also of interest would be to use life expectancy by regions as an indicator of geographical variations of mortality. However, life expectancy has complicated non-linear relations with cause-specific mortality depending on their weights and age patterns. In particular, life expectancy is not easily decomposable by cause (Shkolnikov
et al., 2001). In this sense, age-standardized death rate (SDR) is a more suitable
indicator for a geographical analysis of cause-specific mortality. The choice of indicator will have little impact on the outcome since the all-cause SDR is closely correlated with life expectancy at birth across the Russian regions (Table 1).
Table 1: Correlation between SDR and life expectancy at birth among
the 73 Russian administrative units
Sex All periods 1969-70 1978-79 1988-89 1993-94
Males -0.91 -0.88 -0.86 -0.75 -0.86
Females -0.90 -0.89 -0.92 -0.87 -0.92
For each of the 73 administrative units used here 6 (see Annex I) SDR 7 were
computed on the basis of deaths by age and sex-specific mortality in the immediately pre-census and census years. Since censuses were taken at the very beginning of the census year 8, it was possible to use the age-specific population numbers reported by the
census as denominators.
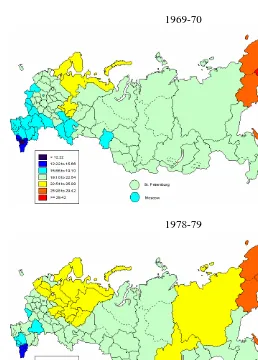
Figure 2 shows the geographical variations in age-standardized mortality rates for each of the four periods. For each sex, the four maps were drawn according to the same 7 value classes. The size of these classes is of one standard deviation, and the central one is centred on the mean all-Russia value for the four periods. In fact, since the range of values is much wider above than below this mean value, the central class is the third one 9.
When considering the maps, it must be borne in mind that the Russian population is very unequally distributed over its territory. A large part of the total population lives in administrative units mostly concentrated in the European part of the country and the south-western part of Siberia. By contrast, the very large units of northern Siberia, especially Tyumen Oblast, Krasnoyarsk Kray, and the Republic of Sakha (Yakutia), are sparsely-populated. For that reason, when interpreting the maps, more weight must be given to colour variations among the smaller western and southern areas than the large Siberian ones. Moreover, the population of territories like Tyumen Oblast or Krasnoyarsk Kray, is mainly concentrated in their very small southernmost tips (identified by dotted lines on the maps). Unfortunately, however, no data were available for these administrative sub-units, and so the entire territory is coloured as for that small part, which may give a misleading impression at first glance.
6 The present Russian territory is divided into 2 cities (Moscow and St Petersburg), 49 oblasts, 6 krays, 21 republics, 1 autonomous district
(Сhukchi AD), and 1 autonomous oblast (Jewish AO) (Goskomstat, 2002, p. 13). Prior to 1991, instead of these 21 republics, there were 15 “autonomous republics” that were direct members of the Russian Federation (including the Chechnya-Ingushia, which, in 1993, was split into
two republics: Chechnya and Ingushia), and 4 “autonomous oblasts” that were parts of 4 krays. Сhukchi autonomous district was part of Magadan Oblast and the Jewish autonomous oblast was included in Khabarovsk Kray. Data for these 5 autonomous oblasts, 1 autonomous
district, and for Chechnya and Ingushia separately, were not available and we can only use here data at the level of whole krays and the whole
autonomous republic of Chechnya-Ingushia. Accordingly, 73 geographical units (2 cities, 49 oblasts, 6 krays, and 16 republics, see Annex I) are
used here. Furthermore, no data is available for Chechnya for 1993-94, and the entire autonomous republic of Chechnya-Ingushia has been left in
blank.
7 SDR were computed on the basis of the WHO (1992) standard European population.
8 Exact census dates were 15 January 1970, 17 January 1979, and 12 January 1989. In 1994, the micro-census accounted for 14 February;
however, this was not used directly as a denominator, but only to correct the post-census population estimate for 1 January 1994.
Figure1: Trends in life expectancy since 1965 and the four points selected for geographical analysis
50 55 60 65 70 75 80
1965 1975 1985 1995
Males
Females
Life expectancy1970
1970
1979
1979
1989
1989
Figure 2a: Variation of age-standardized mortality rate among 73 administrative units in 1969-70, 1978-79,
1988-89 and 1993-94. Males
1969-70
Figure 2a: Males (continued)
1989
Figure 2b: Variation of age-standardized mortality rate among 73 administrative units in 1969-70, 1978-79,
1988-89 and 1993-94. Females
1969-70
Figure 2b: Females (continued)
1988-89
On the male side (Figure 2a), in 1970, a large part of Russia was less than half a standard deviation from the mean (1970-1994) all-Russia SDR value. This included most oblasts of central European Russia and almost all Siberian territories, and accounted for 58.6% of the total male population (Table 2). This means that, at a time when the big post-war gains in life expectancy from the decline in infectious diseases had occurred, Russia had grown increasingly homogeneous. However, two main deviations from the mean were observed: a much better situation in southern European Russia plus Moscow (32.1% of the total population), and a slightly worse one in its northern part (5.3%). The far East (Magadan, Kamchatka, Sakhalin) was affected by much higher mortality, but, again, these are sparsely-populated territories (1.1%). Some Caucasian republics (Dagestan, Kabardin-Balkar, North Ossetia, Chechnya-Ingushia), accounting for 2.9% of the total population, seemed to enjoy notably low mortality, but part at least of that advantage may only be apparent, stemming from under-registration of infant and old-age mortality (Andreev and Kvasha, 2002; Meslé et al., 2003).
Table 2: Percentage of total population living in regions included
in each of the SDR intervals, by sex.
Males
SDR intervals 1970 1979 1989 1994
<12.22 0.8 0 0 0
12.22-15.66 2.1 2.1 1.2 0
15.66 to 19.10 32.1 5.5 54.2 1.3
19.10 to 22.54 58.6 71.8 43.8 9.4
22.54 to 25.98 5.3 19.4 0.8 61.1
25.98 to 29.42 0.8 1.2 0 23.5
>= 29.42 0.3 0 0 3.9
Not available 0.9
Females
SDR intervals 1970 1979 1989 1994
<6.92 0.8 0.8 0 0
6.92-8.62 1.9 1.7 1.2 0
8.62 to 10.32 23.6 16.0 24.4 1.8
10.32 to 12.02 59 61.3 68.5 23.7
12.02 to 13.72 14.1 18.5 4.6 49.5
13.72 to 15.43 0.5 1.4 0.8 21.7
>= 15.43 0 0.3 0.5 2.5
In 1979, after ten years of rising mortality, the map has shifted towards higher level classes of SDR and the yellow areas (71.8% of population) have expanded, while the two blue ones have shrunk (5.5% and 2.1%). In particular, in European Russia, the northern disadvantage has spread towards a large number of new oblasts, while the southern advantage involves only a very small number of territories.
By contrast, in 1989, the remarkable progress made with the anti-alcohol campaign has produced a reverse shift (Shkolnikov and Nemtsov, 1997). The low mortality area expands extensively from southern European Russia to many oblasts along the border between Siberia and Central Asia (again, bearing in mind that the large blue splash of Tyumen Oblast is only due to the weight of its small southernmost part), and the two blue areas account for 55.4% of the total male population. Moscow is again within that advantaged area, now joined by St Petersburg. By contrast, only two special far-Eastern territories (0.8%) are still affected by slightly higher mortality.
From 1989 to 1994, all territories experience a sharp rise in mortality. Almost the entire map is shaded in high mortality colours, with only a couple of territories, accounting for 10.7% of the total male population, remaining in the three lower mortality classes (Table 2).
Apart from these shifts in value levels between successive maps, it can be observed that the homogenisation at work in the 1960s continued in the 1970s. The unweighted standard deviation for SDR was 2.95 for males in 1969-70, falling to 2.64 in 1978-79 (Table 3), with an accompanying, though less pronounced, decrease for the weighted10 standard deviation. In other words, the decrease in life expectancy was higher for advantaged than disadvantaged areas. By contrast, the gains due to the anti-alcohol campaign were far more marked for disadvantaged areas, and the unweighted standard deviation fell dramatically to 1.70 in 1988-89, and even more so for the weighted SD. Correspondingly, the socio-economic crisis had a much greater impact on disadvantaged areas, while the unweighted standard deviation of SDR jumped to 3.01 in 1993-94 (2.32 for weighted SD).
10 As the unweighted standard deviation give the same weight to all regions regardless of population, it is useful to also check trends in standard
Table 3: Standard deviation of SDR (unweighted and weighted by population of regions) among 73 administrative units at four periods
Sex 1969-70 1978-79 1988-89 1993-94
Males
Unweighted 2.95 2.64 1.70 3.01
Weighted 2.42 2.36 1.32 2.32
Females
Unweighted 1.43 1.51 1.65 1.46
Weighted 1.35 1.29 1.28 1.10
At the same time, the asymmetric geographical distribution mapped in Figure 2 minimises in 1988-89, while increasing in the other three periods11.
In all periods, the geography of female mortality is much more homogeneous than that of males (Table 3). Furthermore, standard deviation (weighted or not) varies very little from one period to the other, meaning that neither trends nor fluctuation greatly affect mortality level distribution. It is true that trends and fluctuation are equally less pronounced among females than males. Where male life expectancies declined, female expectancies stagnated, and the wide fluctuations observed among males were much slighter among females. At a lower level of contrast, however, women experienced the same type of geographical variations as men in all periods.
How does the cause-of-death structure of mortality contribute to these geographical changes over time? The first thing is to know if, for a specific period,
11 Asymmetry a can be measured by the ratio of the distance from the median M to the upper limit Q
1 of the first quartile to that from M to the
upper limit Q3 of the third quartile:
M Q
Q M a
− − =
3 1
Thus, for the SDR sets mapped in Figure 2, a takes the following values :
Sex 1969-70 1978-79 1988-89 1993-94
Males 0.82 0.95 1.07 0.91
Females 0.65 0.85 1.25 0.58
For both sexes, a is relatively closer to 1 in 1988-89, indicating minimum asymmetry that year. Homogeneisation is thus accompanied by a
decrease in asymmetry. Furthermore, 1988-89 is the only period where asymmetry is on the lower mortality side, which implies a reversal of
geographical regularities may be found in the cause-of-death structure of mortality. It would be then interesting to determine whether such regularities display any time-bound continuity in spite of or in relation to trends and changes in overall mortality. The first evident requirement is to select a way of measuring the distances between geographical units, in terms of cause-of-death patterns. Since geographical and time contrasts are more pronounced among males, the following analysis will be limited to them.
2. Data and methods
Two questions must be addressed: How to use discontinuous cause–of-death statistics? How to cluster geographical variations in cause-specific mortality?
2.1 Grouping causes of death
When using cause-of-death data at such a level, two problems are encountered. First, observed time-bound changes are partly due to disruptions in statistical time series. Second, observed geographical differences can be influenced by variations in data quality.
Since the late sixties, several classifications of causes of death have been in use in Russia, and deaths published according to old Soviet classifications had to be reclassified accordingly. As a result of a previous work, all cause-of-death data have been reclassified according to the most recent Soviet classification12 (1981, as modified in 1988 for violent deaths) for all Russia, for each year, from 1956 to 1998 (Meslé et
al., 1996 and 2003). For this particular geographical analysis, all-Russia transition
coefficients13 have been applied to cause-of-death data by region for the two-year period used14.
12 During the Soviet era, a specific cause-of-death classification was applied in all the Republics. Even after 1990, that classification remained in
use for around a decade in the new independent countries. The Soviet classification itself changed over time, and four successive versions were
used in the review period. Over time, however, its main structure evolved to more closely mirror the WHO International Classification of
Diseases, although it remains much less detailed (Meslé et al., 1996).
13 The method of reclassification used for the all-Russia level relies on transition coefficients from one classification to the next, calculated after a
complete analysis of medical definitions and statistical contents of individual items of both classifications (Meslé et al, 1996).
14 Assuming that changes in classification had the same impact in each region as at all-Russia level, is certainly not always true. However
computerised complete cause-of-death time series with which to check the actual differences are not available at the region level for the whole
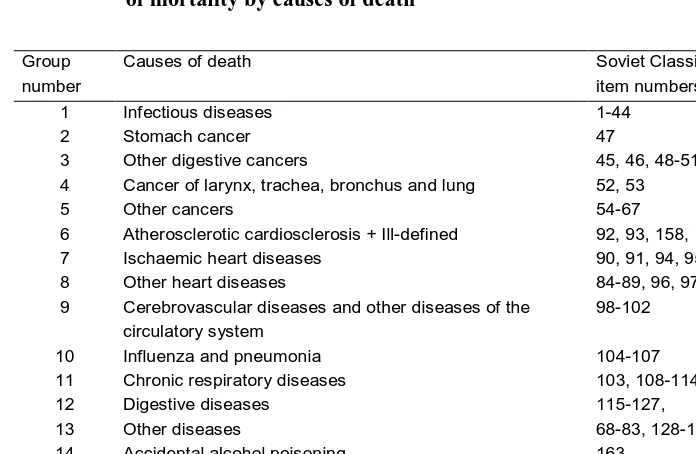
After testing different possibilities, the 175 items of the Soviet classification have been put into 16 groups meaningful for the regional analysis. That grouping retains as such the causes of death that are responsible for high mortality rates, but also includes more specific groups that could be clearly discriminant in geographic terms (Table 4).
In spite of the apparent specificity of their title, the items “atherosclerotic cardiosclerosis” (with or without hypertension) were merged with “ill-defined deaths” because, in the Soviet system still in use, “atherosclerotic cardiosclerosis” includes a significant proportion of imprecise diagnoses that should have been classified as “ill-defined” (Meslé and Vallin, 2003) (See also Section II).
Using such broad groups of causes partly but not entirely circumvents the data quality issue. In the Soviet system, causes of death were identified and coded at the local level and only the results were aggregated at higher levels. Theoretically, such a system amply accommodates geographical variations in cause determination. However, it may also be argued that the powerful Soviet era bureaucracy left local administration very little room for manoeuvre. Unfortunately, there are no specific studies of geographical variations in cause-of-death data quality that we could ascertain, such that we must use the available data "as found", with the caveat that part of our observations will be coloured by that issue.
2.2 Hierarchical cluster analysis
That analysis, based on Euclidian distance between cause-specific SDR patterns15 of the 73 geographical units (Annex I), was applied using within-group linkage methods16. This procedure attempts to identify relatively homogeneous clusters of geographical units based on selected characteristics, using an algorithm that starts with each unit in a separate cluster and combines clusters until only one is left. Thus, the numbers of clusters change in the process of calculation.
Table 4: Groups of causes used for geographical patterns
of mortality by causes of death
Group number
Causes of death Soviet Classification
item numbers
1 Infectious diseases 1-44
2 Stomach cancer 47
3 Other digestive cancers 45, 46, 48-51
4 Cancer of larynx, trachea, bronchus and lung 52, 53
5 Other cancers 54-67
6 Atherosclerotic cardiosclerosis + Ill-defined 92, 93, 158, 159
7 Ischaemic heart diseases 90, 91, 94, 95
8 Other heart diseases 84-89, 96, 97
9 Cerebrovascular diseases and other diseases of the circulatory system
98-102
10 Influenza and pneumonia 104-107
11 Chronic respiratory diseases 103, 108-114,
12 Digestive diseases 115-127,
13 Other diseases 68-83, 128-157
14 Accidental alcohol poisoning 163
15 Suicide, homicide, and injury undetermined whether accidentally or purposely inflicted
173-175
16 Other external causes 160-162, 164-172
15 In fact, Russian mortality trends are heavily influenced by age-group-specific problems, especially at adult ages. A forthcoming study will focus
on changes in the geographical mortality patterns in adult males only. This study seeks only to estimate changes in total mortality.
2.2.1 Period-specific geographical patterns
For our classification, each territory in period t was presented as a vector of 16 values
W(r,t,i):
)
,
(
)
,
,
(
)
,
,
(
i
t
i
t
r
SDR
i
t
r
W
SDR
σ
=
,where:
SDR is the standardized death rate,
r is the geographical unit (r = 0 for Russia),
t represents the period (1969-1970, 1978-1979; 1988-1989, or 1993-1994), i represents the cause-of-death group (from 1 to 16),
)
,
( i
t
SDR
σ
is the standard deviation among geographical units for the cause i during the period t.To obtain the clusters for a specific period, the classification was made on vectors of the 16 values of W of each unit, and the distance between units is the Euclidian distance weighted by the Russian level of mortality for each cause, weighted by the square root of the all-Russia SDR (
SDR
(
0
,
t
,
i
)
), or:(
)
(
)
(
)
(
)
(
)
21
2
1
2
,
,
,
,
0
,
,
−
⋅
∑
iW
r
t
i
W
r
t
i
SDR
t
i
2.2.2 Time-scale overall geographical patterns
To analyse the persistence of geographical cause-of-death patterns over time, a global clustering for all four periods together was obtained on the basis of the distances between the vectors of 16 causes multiplied by 4 periods, i. e. 16x4=64 values of W for each geographical unit. Once again, Euclidian distances are weighted by
)
,
,
0
(
t
i
SDR
:(
)
(
)
(
)
(
)
(
)
21
2
1
2
,
,
,
,
0
,
,
−
⋅
∑∑
t i
i
t
SDR
i
t
r
W
i
t
r
W
3. To each period its own geographical pattern of causes of death
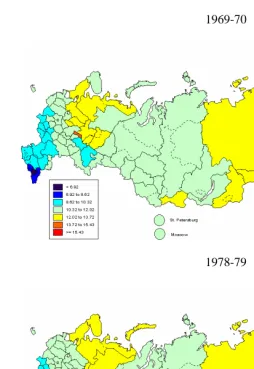
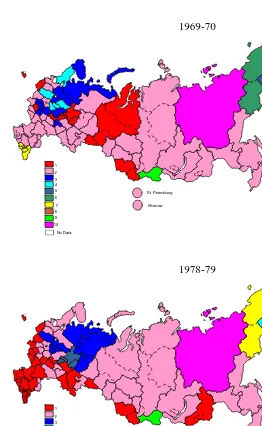
Figure 3 shows the results of the cluster analysis applied to each of the four periods, independently. Although such maps are not comparable, and must be interpreted independently of one another, we defined colour sets for each to maximize ease of interpretation. The results of the time-scale global analysis (next section) were used for that, and detailed explanations are given in annex II. The principle is to assign the same colour to the period-specific clusters that are least distant from the four-period cluster as that assigned in the global analysis. For example, in the four following maps, areas of the cluster that was closest to the first cluster of the global analysis were shaded red, and so on. The same colours were therefore used for clusters showing similarities. In some cases, however, the same global cluster was selected as the closest for two period-specific clusters of the same period. In these cases, the same colour was used, but with distinctive hatching. In this way, for example, the individual cluster of Kamchatka Oblast is associated in 1988-89 with global cluster number 6, already associated with St Petersburg and Moscow cities that formed another cluster in that period. So, while each map shows the results for 10 clusters, the colour sets of some maps include a specific 11th colour, while one of the ten basic colours is missing (see Table II-2 in Annex II).
Figure 3: Males. Geographical distribution of 10 clusters according to cause-of-death structure
1969-70
101
Kali ningr ad O blast
3
Republ ic of Kare lia
11
Leni ngrad Obl ast
13
P sko v Obl ast 12
Novgor od Obla st
7
Vol ogda Oblast
4
R epubli c of Kom i
32
Kir ov Obla st
25
T ver Obl ast
27
Y arosl avl Oblas t
17
Ivanovo Obl ast33
Ni zhn y Novgor od O blast
19
Kostr oma Obl ast
24
S mol ensk Obl ast
21
M oscow Oblast
16
V ladim ir O blast
29
R epubli c of M ari y E l
31
Chuvash Republ ic
15
Br yansk O blast
18
K aluga Obl ast
26
Tul a O blast
22
Or yol Oblast
37
Kursk Obl ast
35
Bel gorod Obl ast
36
Vo ronezh Obl ast
59
R ostov Obl ast
55
Republ ic of Nor th Osset ia56 C hechen and Ing ush Republ ics
51
Republ ic of Dagestan
41
Republ ic of Kalm ykia43Astr akhan Oblast
44
Volgogr ad Obl ast
47
Sar atov Obl ast
45
Penza Obl ast
39
Tam bov Oblast
38
Li petzk Obl ast
23
Ryazan Obl ast
30
Republ ic of Mor dovia
48
U lyanovsk Obla st
46
S amar a Oblast
64
Or enbur g O blast
42
Repu blic of Tat arst an
62
Udm urt r epubl ic
61
Republ ic of Bashkor tost an
68
Chelyabi nsk O blast
63
Kur gan O blast
67
S verdl ovsk Obl ast
74
O msk O blast 73
N ovosibi rsk Obla st
75
Tom sk O blast
72
K emer ov O blast
81
Republ ic of Tuva
80
Republ ic of Bur yat i a
96
Am ur Obl ast
94
P ri mor sky kr ai
65
P erm O blast
88
Chit a O blast
57
Kr asnodar kray and R epubli c of A dyg eya
71
Al tai Kr ay a nd Re public of Al tai
86
Ir kut sk Obl ast
95
Khabar ovsk K ray and Jew ish A utonom ous O blast
53
K abardi an- Balkar r epubl ic
58
S tavr opol Kr ay and Kar achaev-C ir cassi an r epubl ic
99
Magadan Obl ast and C hukchi Autonom ous O kru g
10
St. P eter sburg
2 0M oscow
8 Murmans k Oblas t
5
76
T yumen Obl ast
83
Kr asnoyarsk Kray and Republi c of K hakasia
91
Re public of Sakha (Y akuti a)
100 S akhal in Obl ast
97
Kam chatka Obl ast
St. Petersburg Moscow No Data 1 2 3 4 5 6 7 8 9 10 1978-79 101
Kali ningr ad O blast
3
Republ ic of Kar eli a
1 1
Leni ngra d Ob last
13
Pskov O blast 12
No vgorod Obl ast
7
V ologda Obl ast
4
Republ ic of Komi
32
Ki rov Obl ast
25
Tver Obl ast
27
Yar oslavl Obl ast
17
I van ovo O blast33
Ni zhny Novgor od Obla st
19
Kostr om a O blast
2 4
S mol ensk O blast
21
M oscow Obl ast16
V ladim ir Obl ast
29
Republ ic of M ar iy El
31
Chuvash Republ ic
15
Br yansk O blast
18
K aluga Obl ast
26
Tu la Oblast
22
Or yol Obl ast
37
Kur sk Obl ast
35
Bel gorod Obl ast
36
V oronezh Obl ast
59
R ostov Obl ast
55
Rep ublic of Nor th Osset ia56
C hechen and In gush Repub lics
51
Republ ic of Dagesta n
41
Republ ic of Kalm ykia43Astr akhan Oblast
44
Volg ograd Obl ast
47
Sar atov Obl ast
45
Pen za Obl ast
39
T ambov Obl ast
38
Lipet zk Obl ast
23
Ryazan Obl ast
30
Republ ic of Mor dovia
48
Ulyanovsk Obl ast
46
Sam ara Obl ast
64
Or enbur g O blast
42
R epubli c of Tat arst an
62
Udm urt republ ic
61
R epubli c of Bashkor tost an
68
Chel yabinsk Oblast
63
Kur gan O blast
67
Sverd lovsk O blast
74
Omsk Obl ast
73
Novosi bir sk Obl ast
75
Tomsk Obl ast
72
Kem erov Obl ast
81
Republi c of Tuva
80
Republi c of B uryat ia
96
A mur O blast
94
P ri mor sky kr ai
65Per m Obl ast
88
C hit a O blast
57
Kr asnodar kray and R epubli c of A dygeya
71
A lt ai Kray and R epubli c of A lta i
86
I r kutsk O blast
95
Khabar ovsk Kr ay an d Jewi sh Au tonom ous O blast
53
Kabar dian- Balkar r epubl ic
58
Stavr opol Kr ay and Kar achaev-C ir cassian republ ic
99
M agadan Obl ast and Ch ukchi A utonom ous O krug
10
St. P eter sbur g
20M oscow
8 Mur mansk Oblas t
5
76
Tyum en O blast
8 3
K rasnoyar sk Kr ay and Repu blic of Khakasi a
91
Republ ic of Sakha ( Yakut ia)
100 Sakhal in Obl ast
97
Kam chatka Obl ast
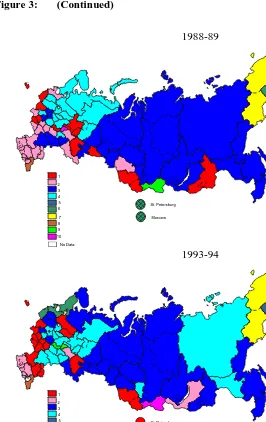
Figure 3: (Continued)
1988-89
101
Kali ningr ad O blast
3
Republ ic of Kar eli a
1 1
Leni ngra d Ob last
13
Pskov O blast 12 No vgorod Obl ast
7
V ologda Obl ast
4
Republ ic of Komi
32
Ki rov Obl ast
25
Tver Obl ast
27
Yar oslavl Obl ast
17
I van ovo O blast33
Ni zhny Novgor od Obla st
19
Kostr om a O blast
2 4
S mol ensk O blast
21
M oscow Obl ast16
V ladim ir Obl ast
29
Republ ic of M ar iy El
31
Chuvash Republ ic
15
Br yansk O blast
18
K aluga Obl ast
26
Tu la Oblast
22
Or yol Obl ast
37
Kur sk Obl ast
35
Bel gorod Obl ast
36
V oronezh Obl ast
59
R ostov Obl ast
55
Rep ublic of Nor th Osset ia56
C hechen and In gush Repub lics
51
Republ ic of Dagesta n
41
Republ ic of Kalm ykia43Astr akhan Oblast
44
Volg ograd Obl ast
47
Sar atov Obl ast
45
Pen za Obl ast
39
T ambov Obl ast
38
Lipet zk Obl ast
23
Ryazan Obl ast
30
Republ ic of Mor dovia
48
Ulyanovsk Obl ast
46
Sam ara Obl ast
64
Or enbur g O blast
42
R epubli c of Tat arst an
62
Udm urt republ ic
61
R epubli c of Bashkor tost an
68
Chel yabinsk Oblast
63
Kur gan O blast
67
Sverd lovsk O blast
74
Omsk Obl ast 73
Novosi bir sk Obl ast
75
Tomsk Obl ast
72
Kem erov Obl ast
81
Republi c of Tuva
80
Republi c of B uryat ia
96
A mur O blast
94
P ri mor sky kr ai
65Per m Obl ast
88
C hit a O blast
57
Kr asnodar kray and R epubli c of A dygeya
71
A lt ai Kray and R epubli c of A lta i
86
I r kutsk O blast
95
Khabar ovsk Kr ay an d Jewi sh Au tonom ous O blast
53
Kabar dian- Balkar r epubl ic
58
Stavr opol Kr ay and Kar achaev-C ir cassian republ ic
99
M agadan Obl ast and Ch ukchi A utonom ous O krug
10
St. P eter sbur g
20M oscow
8 Mur mansk Oblas t
5
76
Tyum en O blast
8 3
K rasnoyar sk Kr ay and Repu blic of Khakasi a
91
Republ ic of Sakha ( Yakut ia)
100 Sakhal in Obl ast
97
Kam chatka Obl ast
St. Petersburg Moscow No Data 1 2 3 4 5 6 7 8 9 10 1993-94 101
Kali ningr ad O blast
3
Republ ic of Kar eli a
1 1
Leni ngra d Ob last
13
Pskov O blast 12 No vgorod Obl ast
7
V ologda Obl ast
4
Republ ic of Komi
32
Ki rov Obl ast
25
Tver Obl ast
27
Yar oslavl Obl ast
17
I van ovo O blast33
Ni zhny Novgor od Obla st
19
Kostr om a O blast
2 4
S mol ensk O blast
21
M oscow Obl ast
16
V ladim ir Obl ast
29
Republ ic of M ar iy El
31
Chuvash Republ ic
15
Br yansk O blast
18
K aluga Obl ast
26
Tu la Oblast
22
Or yol Obl ast
37
Kur sk Obl ast
35
Bel gorod Obl ast
36
V oronezh Obl ast
59
R ostov Obl ast
55
Rep ublic of Nor th Osset ia56 C hechen and In gush Repub lics
51
Republ ic of Dagesta n
41
Republ ic of Kalm ykia43Astr akhan Oblast
44
Volg ograd Obl ast
47
Sar atov Obl ast
45
Pen za Obl ast
39
T ambov Obl ast
38
Lipet zk Obl ast
23
Ryazan Obl ast
30
Republ ic of Mor dovia
48
Ulyanovsk Obl ast
46
Sam ara Obl ast
64
Or enbur g O blast
42
R epubli c of Tat arst an
62
Udm urt republ ic
61
R epubli c of Bashkor tost an
68
Chel yabinsk Oblast
63
Kur gan O blast
67
Sverd lovsk O blast
74
Omsk Obl ast 7 3
Novosi bir sk Obl ast
75
Tomsk Obl ast
72
Kem erov Obl ast
81
Republi c of Tuva
80
Republi c of B uryat ia
96
A mur O blast
94
P ri mor sky kr ai
65Per m Obl ast
8 8
C hit a O blast
57
Kr asnodar kray and R epubli c of A dygeya
71
A lt ai Kray and R epubli c of A lta i
86
I r kutsk O blast
95
Khabar ovsk Kr ay an d Jewi sh Au tonom ous O blast
53
Kabar dian- Balkar r epubl ic
58
Stavr opol Kr ay and Kar achaev-C ir cassian republ ic
99
M agadan Obl ast and Ch ukchi A utonom ous O krug
10
St. P eter sbur g
20M oscow
8 Mur mansk Oblas t
5
76
Tyum en O blast
8 3
K rasnoyar sk Kr ay and Repu blic of Khakasi a
91
Republ ic of Sakha ( Yakut ia)
100 Sakhal in Obl ast
97
Kam chatka Obl ast
death for the cluster, divided by the Russian SMR. The stars are shown by period in Figures 4a to 4d. For each period, two graphs were plotted. The first aggregates stars of the four major clusters (those closest to the first 4 global clusters). The second aggregates the six remaining clusters, which are mostly quite singular clusters with very specific cause-of-death patterns, but comprising only a few territorial units. Most significance attaches to the shape of the first four stars.
3.1 1969-1970
Notwithstanding that Russian male life expectancy had been declining since 1965, the situation found at the end of the sixties still largely reflects the outcomes of previous decades' strong gains from the country-wide reduction of infectious diseases that produced greater homogeneity. This largely explains why most territorial entities fall in the same cluster (n° 2), coloured light pink on the 1969-70 map. This cluster aggregates 40 of the 73 units, including Moscow and St Petersburg (represented by two circles below the map to delineate them more clearly). The star for this cluster shown at the top of figure 4a appears clearly very closed to circle 1 representing the all-Russia cause-of-death pattern. The second most important cluster (cluster 3, in dark blue on the map) aggregates 10 units, all located in the northern European part of Russia. It is also very close to the Russian mean, except for two groups of causes: stomach cancer and cerebrovascular diseases17. Stomach cancer was also a cause of excess mortality in a third cluster geographically located in the same part of Russia (cluster 4, in light blue), however was not particularly affected by cerebrovascular diseases, but showed strong excess mortality from atherosclerotic cardiosclerosis. The latter group is known to be quite ill-defined, and probably includes many circulatory system diseases, including cerebrovascular disease (Meslé et al., 1998), although that fact may not be significant. By contrast, excess mortality from accidental alcohol poisoning, suicide and homicide is more representative of that cluster. Both of these groups are closely associated with alcohol consumption in Russia (Shkolnikov and Nemtsov, 1997). Alcohol consumption and especially accidental alcohol poisoning, is an even greater cause of excess mortality in the cluster shaded red (cluster 1), which aggregates 10 units, also mainly located in the northern part of European Russia, plus 3 units in western Siberia. That cluster is also strongly characterised by chronic respiratory diseases and to a lesser extent by
17 That group also includes "other diseases of the circulatory system", but that component is much less significant than cerebrovascular diseases,
Figure 4a: Cause-of-death patterns of each cluster compared to the all-Russia cluster (cluster SMR/Russian SMR). Ten clusters, males, 1969-70
0 0.2 0.4 0.6 0.8 1 1.2 1.4 1.6 1.8 Infectious diseases
Cancer of stomach
Other digestive cancers
Cancer of larynx, trachea, bronchus and lung
Other cancers
Atherosclerotic cardiosclerosis + Ill defined
Other ischaemic heart diseases
Other heart diseases
Cerebrovascular diseases + Other diseases of the circulatory system Influenza+pneumonia
Chronic respiratory diseases Digestive diseases
Other diseases Accidental poisoning by alcohol uicide + Homicide+Injury undetermined w hether
accidentally or purposely inflicted
Other external causes #1
#2
#3
#4
0 0.5 1 1.5 2 2.5 3 3.5 4 Infectious diseases
Cancer of stomach
Other digestive cancers
Cancer of larynx, trachea, bronchus and lung
Other cancers
Atherosclerotic cardiosclerosis + Ill defined
Other ischaemic heart diseases
Other heart diseases
Cerebrovascular diseases + Other diseases of the circulatory system Influenza+pneumonia
Chronic respiratory diseases Digestive diseases
Other diseases Accidental poisoning by alcohol Suicide + Homicide+Injury undetermined w hether
accidentally or purposely inflicted
Other external causes
#5
#6
#7
#9
#10
infectious diseases. There is also a notable excess mortality from atherosclerotic cardiosclerosis, but once again, this category is probably misleading, since its importance is very likely associated with an underestimation of cardiovascular mortality (and especially of “other ischaemic heart diseases”).
Of the other clusters, 5 comprise a single territorial unit. Each appears to display exceptional excess mortality for one specific group of causes. For example, in Yakutia (cluster 10), "other digestive cancers" mortality was 4 times higher than in Russia in that period, while chronic respiratory diseases are more than 3.5 times higher in the Mari Republic (cluster 11) than for all-Russia. Likewise, in Magadan (cluster 6), digestive diseases mortality was 4 times that of Russia, while influenza and pneumonia mortality was 4 times higher in the republic of Tuva (cluster 9). More interestingly, a specific cluster (n° 7) aggregating 4 units that comprise a continuous zone in the Caucasian region (the Republics of Dagestan, Chechnya-Ingouchia, North-Ossetia and Kabardin-Balkaria), is characterised by very low mortality for almost all causes except “infectious diseases” and “influenza and pneumonia”. Its “accidental alcohol poisoning” mortality was almost negligible and its “suicide and homicide” mortality was only one third that of Russia.
3.2 1978-79
The difference between 1969-70 and 1978-79 portrays here the results of the first step of a long-term decline in life expectancy. In 1978-79, cause-of-death patterns appear more heterogeneous among territories. The very large cluster coloured light pink on the 1969-70 map is split into two clusters coloured light pink (cluster 2) and red (cluster 1) on the 1978-79 map. While the light pink cluster still presents very similar cause-of-death pattern, quite close to the Russian mean, the red one is now different, but also close to the Russian mean (Figure 4b). They are distinguished by the fact that their slight differences from the all-Russia pattern are not the same (alcohol-related mortality is higher in the light pink cluster and lower in the red one, while the converse is true for “other ischaemic heart diseases” and cerebrovascular diseases).
Figure 4b: Cause-of-death patterns of each cluster compared to the all-Russia cluster (cluster SMR/Russian SMR). Ten clusters, males, 1978-79
0 0,2 0,4 0,6 0,8 1 1,2 1,4 1,6 Infectious diseases
Cancer of stomach
Other digestive cancers
Cancer of larynx, trachea, bronchus and lung
Other cancers
Atherosclerotic cardiosclerosis + Ill defined
Other ischaemic heart diseases
Other heart diseases
Cerebrovascular diseases + Other diseases of the circulatory system Influenza+pneumonia
Chronic respiratory diseases Digestive diseases
Other diseases Accidental poisoning by alcohol uicide + Homicide+Injury undetermined w hether
accidentally or purposely inflicted
Other external causes #1
#2
#3
#6
0 0,5 1 1,5 2 2,5 3 3,5 4 4,5 Infectious diseases
Cancer of stomach
Other digestive cancers
Cancer of larynx, trachea, bronchus and lung
Other cancers
Atherosclerotic cardiosclerosis + Ill defined
Other ischaemic heart diseases
Other heart diseases
Cerebrovascular diseases + Other diseases of the circulatory system Influenza+pneumonia
Chronic respiratory diseases Digestive diseases
Other diseases Accidental poisoning by alcohol uicide + Homicide+Injury undetermined w hether
accidentally or purposely inflicted
Other external causes
#4
#5
#7
#9
#10
cities showed a specific cause-of-death pattern with higher mortality from all cancers (especially digestive cancer), “other ischaemic heart diseases” and “other diseases”. To a large extent, this pattern typically reflects improved diagnostic accuracy. By contrast, violent deaths, infectious diseases, and chronic respiratory diseases are much less significant than for all-Russia.
Once again, the lower part of Figure 4b displays stars for marginal clusters formed by small numbers of units. The five single-unit clusters (7 Magadan, 4 Kamchatka, 9 Tuva, 10 Yakutia, and 11 Dagestan) show marked peculiarities, almost identical to 1969-70 when the same unit is concerned. By contrast, the remaining cluster, grey-blue in 1978-79, corresponds to a part of the red cluster of 1969-70, aggregating the Republics of Mari, Chuvach, and Udmurtia, and Kirov Oblast (cluster 5). That cluster effectively shows a cause-of-death pattern close to that of the red cluster of 1969-70.
3.3 1988-89
The period 1988-89 characterised the situation produced by the positive results of the Gorbachev anti-alcoholism campaign. At that time, as shown in table 2, the geographical heterogeneity of total mortality was much less than during the other three review periods. Life expectancy gains from reductions in alcohol- and cardiovascular diseases-related mortality had been higher in regions where mortality was high. The 1988-89 map in Figure 3 also shows a much clearer geographical structure of cause of deaths than in any other period. There is a very sharp contrast between the northern and southern parts of European Russia, and it is the only time where there is a clear demarcation between the European part (here extended to the southern tip of western Siberia) and the Asian part of Russia. Homogenisation in term of levels attributable to the reduction in alcohol-related causes of death, which have a spurious effect on cause-of-death patterns, seems to have been associated with the emergence of a geographical pattern more related to the more fundamental cause-of-death structure.
The cause-of-death patterns of the three main clusters, coloured light pink (southern European Russia, cluster 2), light blue (northern European Russia, cluster 4), and dark blue (most of Siberia, cluster 3), are quite close to the all-Russia pattern. They are slightly discriminated, however, by specific causes of death: alcohol-related causes are more significant in northern European Russia and much less in southern European Russia, but the converse is true for infectious diseases. Most cardiovascular categories and infectious diseases are more significant in Siberia.
Figure 4c: Cause-of-death patterns of each cluster compared to the all-Russia cluster (cluster SMR/Russian SMR). Ten clusters, males, 1988-89
0 0,2 0,4 0,6 0,8 1 1,2 1,4 1,6 Infectious diseases
Cancer of stomach
Other digestive cancers
Cancer of larynx, trachea, bronchus and lung
Other cancers
Atherosclerotic cardiosclerosis + Ill defined
Other ischaemic heart diseases
Other heart diseases
Cerebrovascular diseases + Other diseases of the circulatory system Influenza+pneumonia
Chronic respiratory diseases Digestive diseases
Other diseases Accidental poisoning by alcohol uicide + Homicide+Injury undetermined w hether
accidentally or purposely inflicted
Other external causes #1
#2
#3
#4
#11
0 0,5 1 1,5 2 2,5 3 3,5 4 4,5 Infectious diseases
Cancer of stomach
Other digestive cancers
Cancer of larynx, trachea, bronchus and lung
Other cancers
Atherosclerotic cardiosclerosis + Ill defined
Other ischaemic heart diseases
Other heart diseases
Cerebrovascular diseases + Other diseases of the circulatory system Influenza+pneumonia
Chronic respiratory diseases Digestive diseases
Other diseases Accidental poisoning by alcohol uicide + Homicide+Injury undetermined w hether
accidentally or purposely inflicted
Other external causes
#6
#7
#8
#9
Udmurt Republic, Bashkortostan Republic, and Kurgan Oblast to the Altaï. Departing appreciably from the Russian pattern, it is marked by higher mortality from chronic respiratory diseases, atherotic cardio-sclerosis and accidental alcohol poisoning.
As in the previous period, Moscow and St Petersburg form specific cluster n° 11. Exceptionally, this is included with the four main ones to account for the population sizes of these two entities. Also, that cluster's profile departs much less from the mean than the following ones, included in the second star graph. The 1988-89 Moscow and St Petersburg profile closely matches that of the previous period. However, mortality from “other ischaemic heart diseases” is below the Russian mean, compared to above it in the previous period, and the converse applies to the broad category of atherosclerotic cardiosclerosis and ill-defined causes. In fact, this difference from the previous period reflects less any real change in the disease profile than in coding practice. This is because a new instruction from the Health Ministry in 1989 required any death over the age of 80 where no specific cause was mentioned in the medical file or autopsy report to be classed as "senility", and forbade deaths at younger ages from being reported as acute cardiovascular failure unless the diagnosis was confirmed by an autopsy report (Meslé and Vallin, 2003). The first requirement resulted mainly in transfers from atherosclerotic cardiosclerosis to ill-defined causes, which is without consequence for the broad group used here, but the second led to numerous transfers of specific cardiovascular diseases (here aggregated under “other ischaemic heart diseases”) toward ill-defined causes, which is the main explanatory factor in the change of the star for that cluster.
As usual, small clusters generally comprising a single geographic unit, present singular profiles very far from the Russian mean. Significantly, however, the second graph of Figure 4b shows Yakutia no longer identified as a specific cluster, but incorporated in the large cluster 3.
3.4 1993-94
Figure 4d: Cause-of-death patterns of each cluster compared to the all-Russia cluster (cluster SMR/Russian SMR). Ten clusters, males, 1993-94
0 0,2 0,4 0,6 0,8 1 1,2 1,4 1,6 1,8 Infectious diseases
Cancer of stomach
Other digestive cancers
Cancer of larynx, trachea, bronchus and lung
Other cancers
Atherosclerotic cardiosclerosis + Ill defined
Other ischaemic heart diseases
Other heart diseases
Cerebrovascular diseases + Other diseases of the circulatory system Influenza+pneumonia
Chronic respiratory diseases Digestive diseases
Other diseases Accidental poisoning by alcohol uicide + Homicide+Injury undetermined w hether
accidentally or purposely inflicted
Other external causes #1
#2
#3
#4
0 0,5 1 1,5 2 2,5 3 3,5 4 Infectious diseases
Cancer of stomach
Other digestive cancers
Cancer of larynx, trachea, bronchus and lung
Other cancers
Atherosclerotic cardiosclerosis + Ill defined
Other ischaemic heart diseases
Other heart diseases
Cerebrovascular diseases + Other diseases of the circulatory system Influenza+pneumonia
Chronic respiratory diseases Digestive diseases
Other diseases Accidental poisoning by alcohol uicide + Homicide+Injury undetermined w hether
accidentally or purposely inflicted
Other external causes
#5
#6
#7
#8
#9
clusters and new disease profiles to their stars. One general effect of that change is to make the disease profiles closer to the mean and less different from each other (Figure 4d). The first cluster (in red) that includes for the first time Moscow and St Petersburg is close to the Russian mean for all causes of death except atheroclerotic cardiosclerosis and ill-defined causes. It aggregates fairly well developed regions, including the two metropolitan areas where the mortality rise closely mirrored the national mean, but where also the new coding rules mentioned above were still applied.
The second cluster (in pink), showing the most favourable profile, with often sub-mean mortalities, relatively low impact of accidental alcohol poisoning and greater incidence of other heart diseases, has been reduced to a much smaller number of geographic units, almost entirely limited to Caucasian regions. For that reason, it is also marked by a relative importance of digestive and infectious diseases. Clusters 3 (dark blue) and 4 (light blue) display considerable geographical discontinuity, both including regions in the far East as well as middle Siberia and north-western European Russia. Mortality levels are almost invariably equal to or above the mean for all causes. The main difference between the two lies in “other ischaemic heart diseases”, which are the cause of much higher mortality in the third than fourth cluster.
Smaller clusters are more singular than ever. Kamchatka (cluster 5), Magadan (cluster 7), Tuva (cluster 10), and Dagestan (cluster 8), in particular, are once more isolated in specific clusters with generally the same type of deviations from the mean. For Kamchatka, however, the impact of accidental alcohol poisoning is very prominent.
4. Constant geographical contrasts
The wide mortality fluctuations and general time trends notwithstanding, are there any major geographical features that can be reliably retained when aggregating data for all four periods? To characterize the global geographical pattern, we used the distance measurement between the vectors of 16 causes multiplied by four periods for each geographical unit, as explained earlier in section I-B-2. As previously, we first defined a set of 73 clusters (as many clusters as geographical units), incrementally merging the two closest clusters, leaving only two clusters at the end, splitting all-Russia into two geographical entities.
oblast and the Republic of Sakha (former Yakoutia) arguably slightly weakens that continuity, but the importance of these very large sparsely-populated areas should probably not be over-stated. These two units aside, the second cluster clearly aggregates the rest of Asian Russia with all the north-eastern part of European Russia. A second point is that these two final clusters embrace two very significant and contrasting parts of geographical and historical Russia: the rich agricultural part running from the Northern Caucasus to the Lithuanian border, the Southern Volga basin and the Siberian prolongation of the chernoziom (black soil) belt, and the less hospitable regions of northern European Russia and Siberia. All-period mortality has been consistently lower in the former than the latter part. And Figure 6 shows that these two big clusters present two very different disease profiles.
Mortality is lower for almost all causes in cluster 1 than in cluster 2. The only exception is for chronic respiratory diseases that produce a slightly higher mortality in cluster 1 than all-Russia. However, the difference is much less than for the high excess mortality revealed by cluster 2 for two large groups of causes: violent deaths (including alcohol-related) and cardiovascular mortality. The standardized mortality rate by accidental alcohol poisoning is 40% above the Russian mean in cluster 2, and slightly below in cluster 1. Excess mortality in cluster 2 is also highly significant for the two other groups of violent death, especially suicide and homicide. Likewise, that cluster presents high excess mortality for the three broad groups of cardio-vascular diseases (ischaemic heart diseases, other heart diseases and cerebrovascular diseases). Another major cause of excess mortality for that group is related to acute respiratory diseases (influenza and pneumonia). Even digestive and respiratory cancer mortalities are also above the Russian mean.
However, there is a useful purpose to looking beyond this approximate split into the two largest clusters, and refining the analysis by returning to the previous steps of our clustering procedure. The three remaining charts of Figure 5 show the maps with 4, 6, and 8 clusters, and, finally, Figure 7, the map with 10 clusters. Arguably, the latter is the most appropriate for final comments. This is because the 4- and 6-cluster maps only isolate very specific geographical units, without disrupting the big areas shown by the 2-cluster map. It is only with the 8-cluster map that the first large area is split into two large parts, while the 10-cluster map (Figure 7) does likewise for the second large area. And these two large partitions are, again, of great geographical interest.
Figure 5: Global clustering for the four periods together, according to 2 to 8 clusters. Males
Males, 2 clusters
101
Kali ningr ad O blast
3
Republ ic of Kare lia
11
Leni ngrad Obl ast
13
P sko v Obl ast 12 Novgor od Obla st
7
Vol ogda Oblast
4
R epubli c of Kom i
32
Kir ov Obla st
25
T ver Obl ast
27
Y arosl avl Oblas t
17
Ivanovo Obl ast33
Ni zhn y Novgor od O blast
19
Kostr oma Obl ast
24
S mol ensk Obl ast
21
M oscow Oblast16
V ladim ir O blast
29
R epubli c of M ari y E l
31
Chuvash Republ ic
15
Br yansk O blast
18
K aluga Obl ast
26
Tul a O blast
22
Or yol Oblast
37
Kursk Obl ast
35
Bel gorod Obl ast
36
Vo ronezh Obl ast
59
R ostov Obl ast
55
Republ ic of Nor th Osset ia56 C hechen and Ing ush Republ ics
51
Republ ic of Dagestan
41
Republ ic of Kalm ykia43Astr akhan Oblast
44
Volgogr ad Obl ast
47
Sar atov Obl ast
45
Penza Obl ast
39
Tam bov Oblast
38
Li petzk Obl ast
23
Ryazan Obl ast
30
Republ ic of Mor dovia
48
U lyanovsk Obla st
46
S amar a Oblast
64
Or enbur g O blast
42
Repu blic of Tat arst an
62
Udm urt r epubl ic
61
Republ ic of Bashkor tost an 68 Chelyabi nsk O blast
63
Kur gan O blast
67
S verdl ovsk Obl ast
74
O msk O blast 73
N ovosibi rsk Obla st
75
Tom sk O blast
72
K emer ov O blast
81
Republ ic of Tuva
80
Republ ic of Bur yat i a
96
Am ur Obl ast
94
P ri mor sky kr ai
65P erm O blast
88
Chit a O blast
57
Kr asnodar kray and R epubli c of A dyg eya
71
Al tai Kr ay a nd Re public of Al tai
86
Ir kut sk Obl ast
95
Khabar ovsk K ray and Jew ish A utonom ous O blast
53
K abardi an- Balkar r epubl ic
58
S tavr opol Kr ay and Kar achaev-C ir cassi an r epubl ic
99
Magadan Obl ast and C hukchi Autonom ous O kru g
10
St. P eter sburg
2 0M oscow
8 Murmans k Oblas t
5
76
T yumen Obl ast
83
Kr asnoyarsk Kray and Republi c of K hakasia
91
Re public of Sakha (Y akuti a)
100
S akhal in Obl ast
97
Kam chatka Obl ast
St. Petersburg
Moscow 1
2
No Data
Males, 4 clusters
101
Kali ningr ad O blast
3
Republ ic of Kare lia
11
Leni ngrad Obl ast
13
P sko v Obl ast
12
Novgor od Obla st
7
Vol ogda Oblast
4
R epubli c of Kom i
32
Kir ov Obla st
25
T ver Obl ast
27
Y arosl avl Oblas t
17
Ivanovo Obl ast33
Ni zhn y Novgor od O blast
19
Kostr oma Obl ast
24
S mol ensk Obl ast
21
M oscow Oblast16
V ladim ir O blast
29
R epubli c of M ari y E l
31
Chuvash Republ ic
15
Br yansk O blast
18
K aluga Obl ast
26
Tul a O blast
22
Or yol Oblast
37
Kursk Obl ast
35
Bel gorod Obl ast
36
Vo ronezh Obl ast
59
R ostov Obl ast
55
Republ ic of Nor th Osset ia
56
C hechen and Ing ush Republ ics
51
Republ ic of Dagestan
41
Republ ic of Kalm ykia43Astr akhan Oblast
44
Volgogr ad Obl ast
4 7
Sar atov Obl ast
45
Penza Obl ast
39
Tam bov Oblast
38
Li petzk Obl ast
23
Ryazan Obl ast
3 0
Republ ic of Mor dovia
48
U lyanovsk Obla st
46
S amar a Oblast
64
Or enbur g O blast
4 2
Repu blic of Tat arst an
6 2
Udm urt r epubl ic
61
Republ ic of Bashkor tost an
68
Chelyabi nsk O blast
63
Kur gan O blast
6 7
S verdl ovsk Obl ast
74
O msk O blast 73
N ovosibi rsk Obla st
75
Tom sk O blast
72
K emer ov O blast
81
Republ ic of Tuva
80
Republ ic of Bur yat i a
96
Am ur Obl ast
94
P ri mor sky kr ai
65
P erm O blast
88
Chit a O blast
57
Kr asnodar kray and R epubli c of A dyg eya
71
Al tai Kr ay a nd Re public of Al tai
8 6
Ir kut sk Obl ast
9 5
Khabar ovsk K ray and Jew ish A utonom ous O blast
53
K abardi an- Balkar r epubl ic
58
S tavr opol Kr ay and Kar achaev-C ir cassi an r epubl ic
9 9
Magadan Obl ast and C hukchi Autonom ous O kru g
10
St. P eter sburg
2 0M oscow
8 Murmans k Oblas t
5
76
T yumen Obl ast
83
Kr asnoyarsk Kray and Republi c of K hakasia
91
Re public of Sakha (Y akuti a)
100
S akhal in Obl ast
97
Kam chatka Obl ast
Figure 5: (Continued)
Males, 6 clusters
101
Kali ningr ad O blast
3
Republ ic of Kar eli a
1 1
Leni ngra d Ob last
13
Pskov O blast 12
No vgorod Obl ast
7
V ologda Obl ast
4
Republ ic of Komi
32
Ki rov Obl ast
25
Tver Obl ast
27
Yar oslavl Obl ast
17
I van ovo O blast33
Ni zhny Novgor od Obla st
19
Kostr om a O blast
2 4
S mol ensk O blast
21
M oscow Obl ast
16
V ladim ir Obl ast
29
Republ ic of M ar iy El
31
Chuvash Republ ic
15
Br yansk O blast
18
K aluga Obl ast
26
Tu la Oblast
22
Or yol Obl ast
37
Kur sk Obl ast
35
Bel gorod Obl ast
36
V oronezh Obl ast
59
R ostov Obl ast
55
Rep ublic of Nor th Osset ia56 C hechen and In gush Repub lics
51
Republ ic of Dagesta n
41
Republ ic of Kalm ykia43Astr akhan Oblast
44
Volg ograd Obl ast
47
Sar atov Obl ast
45
Pen za Obl ast
39
T ambov Obl ast
38
Lipet zk Obl ast
23
Ryazan Obl ast
30
Republ ic of Mor dovia
48
Ulyanovsk Obl ast
46
Sam ara Obl ast
64
Or enbur g O blast
42
R epubli c of Tat arst an
62
Udm urt republ ic
61
R epubli c of Bashkor tost an
68
Chel yabinsk Oblast
63
Kur gan O blast
67
Sverd lovsk O blast
74
Omsk Obl ast 73
Novosi bir sk Obl ast
75
Tomsk Obl ast
72
Kem erov Obl ast
81
Republi c of Tuva
80
Republi c of B uryat ia
96
A mur O blast
94
P ri mor sky kr ai
65
Per m Obl ast
88
C hit a O blast
57
Kr asnodar kray and R epubli c of A dygeya
71
A lt ai Kray and R epubli c of A lta i
86
I r kutsk O blast
95
Khabar ovsk Kr ay an d Jewi sh Au tonom ous O blast
53
Kabar dian- Balkar r epubl ic
58
Stavr opol Kr ay and Kar achaev-C ir cassian republ ic
99
M agadan Obl ast and Ch ukchi A utonom ous O krug
10
St. P eter sbur g
20M oscow
8 Mur mansk Oblas t
5
76
Tyum en O blast
8 3
K rasnoyar sk Kr ay and Repu blic of Khakasi a
91
Republ ic of Sakha ( Yakut ia)
100 Sakhal in Obl ast
97
Kam chatka Obl ast
St. Petersburg Moscow 1 2 3 4 5 6 No Data
Males, 8 clusters
101
Kali ningr ad O blast
3
Republ ic of Kar eli a
1 1
Leni ngra d Ob last
13
Pskov O blast 12
No vgorod Obl ast
7
V ologda Obl ast
4
Republ ic of Komi
32
Ki rov Obl ast
25
Tver Obl ast
27
Yar oslavl Obl ast
17
I van ovo O blast33
Ni zhny Novgor od Obla st
19
Kostr om a O blast
2 4
S mol ensk O blast
21
M oscow Obl ast
16
V ladim ir Obl ast
29
Republ ic of M ar iy El
31
Chuvash Republ ic
15
Br yansk O blast
18
K aluga Obl ast
26
Tu la Oblast
22
Or yol Obl ast
37
Kur sk Obl ast
35
Bel gorod Obl ast
36
V oronezh Obl ast
59
R ostov Obl ast
55
Rep ublic of Nor th Osset ia56 C hechen and In gush Repub lics
51
Republ ic of Dagesta n
41
Republ ic of Kalm ykia43Astr akhan Oblast
44
Volg ograd Obl ast
47
Sar atov Obl ast
45
Pen za Obl ast
39
T ambov Obl ast
38
Lipet zk Obl ast
23
Ryazan Obl ast
30
Republ ic of Mor dovia
48
Ulyanovsk Obl ast
46
Sam ara Obl ast
64
Or enbur g O blast
42
R epubli c of Tat arst an
62
Udm urt republ ic
61
R epubli c of Bashkor tost an
68
Chel yabinsk Oblast
63
Kur gan O blast
67
Sverd lovsk O blast
74
Omsk Obl ast 73
Novosi bir sk Obl ast
75
Tomsk Obl ast
72
Kem erov Obl ast
81
Republi c of Tuva
80
Republi c of B uryat ia
96
A mur O blast
94
P ri mor sky kr ai
65Per m Obl ast
88
C hit a O blast
57
Kr asnodar kray and R epubli c of A dygeya
71
A lt ai Kray and R epubli c of A lta i
86
I r kutsk O blast
95
Khabar ovsk Kr ay an d Jewi sh Au tonom ous O blast
53
Kabar dian- Balkar r epubl ic
58
Stavr opol Kr ay and Kar achaev-C ir cassian republ ic
99
M agadan Obl ast and Ch ukchi A utonom ous O krug
10
St. P eter sbur g
20M oscow
8 Mur mansk Oblas t
5
76
Tyum en O blast
8 3
K rasnoyar sk Kr ay and Repu blic of Khakasi a
91
Republ ic of Sakha ( Yakut ia)
100 Sakhal in Obl ast
97
Kam chatka Obl ast