0 INTRODUCTION
0.1 Background
Oil & gas exploration and production activities in deep waters of the Gulf of Mexico, Gulf of Guinea, Brazil, and the North Sea have increased dramatically in recent years, nearly doubling, compared to the
activities of a decade ago [1]. Regardless of the
floating platform concept adopted for many offshore field development activities, there is always need for a riser system, which has played a massive role
as offshore infrastructure [2]. There is, therefore,
a need to ensure that the integrity of riser systems is not compromised; that is, ensuring high fatigue life in performance. In West African deepwater, for example, steel catenary risers (SCR) are commonly used because of the prevalent conditions, though
fatigue remains a challenge [3]. SCR is a
cost-effective alternative for oil and gas export and for water injection lines on deepwater fields, where large-diameter flexible risers present technical and
economic limitations [4]. Among the riser concepts
(e.g. flexible risers, hybrid risers), SCRs have enjoyed
widespread acceptability for deep and ultra-deepwater applications in recent years. This is due to their relatively low cost, conceptual simplicity, significant structural capacity, and ease of fabrication and installation. However, their fatigue response has been a concern to the industry, especially in West Africa [3]. SCR fatigue damage can be caused by vortex-induced vibration (VIV) and vortex-induced motion (VIM) at
the touch-down-point (TDP) [3]. Fatigue of SCR at
TDP has been one of the most challenging problems
in deep water due to interactions with the seabed [5].
The fatigue damage induced by VIV and VIM can be fatal to the riser [6].
0.2 Wave Environment
Harsh environments influence motions of floating platforms, which in turn affect the riser system dynamics. For instance, the application of SCRs with semi-submersibles or floating production, storage and offloading vessels (FPSOs) in harsh deepwater environments presents design challenges due to large wave-induced motions on the platform, and large vessel offsets caused by wind, currents, and slow-drift
On the Fatigue of Steel Catenary Risers
Chibueze, N.O. – Ossia, C.V. – Okoli, J.U.Nnamdi Onochie Chibueze – Chinwuba Victor Ossia* – John Umunna Okoli
University of Port Harcourt, Offshore Technology Institute, Nigeria
Steel catenary risers (SCR), though an appropriate and cost effective tool for deepwater development, are fraught with difficult fatigue challenges derived from loads due to the actions of wind, wave and current. In this study, a model SCR-AB with end-A attached to floating production, storage and offloading vessels (FPSO) and end-B anchored to the seabed was created using OrcaFlex© finite element software. Also attached to this model is a 104 kg 6D buoy of 6 m height and volume 20 m³, which was fixed to the SCR at 900 m of the riser length. The various sections of the homogenous 2200 m long SCR pipe include 50 m flex joint section, 350 m strake length, 1300 m riser pipe length, and 500 m flowline section. Metrological ocean data, geotechnical data and SCR data were input into the model which was subjected to the Ochi-Hubble and Joint North Sea Wave Project (JONSWAP) wave spectra. Analyses to determine the influence of fatigue damage on the model was made using system simulation under both static and dynamic modes. The results for JONSWAP wave spectra showed the fatigue life of the SCR to be 1.8 years at the touch-down-point (TDP) while that of Ochi-Hubble wave spectra showed a fatigue life of 13.6 years at SCR TDP, differing by a factor of 7.5. Furthermore, the S-N curves obtained from both wave spectra corroborated an inverse relationship between Stress values S and the number of stress cycles to failure N on a log-log scale.
Keywords: steel catenary risers, touchdown point, Ochi-Hubble, JONSWAP
Highlights
• Fatigue life at SCR TDP and SCR hang-off obtained are very low, indicative of higher stresses derived from FPSO dynamics, ocean current, wave spectra, and other environmental loadings.
• There is a sharp rise in the SCR tension (mooring line effective tension) from zero at FPSO hang-off point to a maximum of 30×106 kN at 5 m arc length due to the reasons mentioned above.
• JONSWAP and Ochi-Hubble wave spectra used for SCR design are used to determine the SCR fatigue life, tension, cost, etc. by the oil and gas industry operators.
wave motions. The resulting large heave motions of the vessel cause buckling and fatigue-related issues
of the riser at TDP [7]. The wave spectra adopted in
SCR design becomes crucial. The two-parameter Pierson-Moskowitz wave spectrum (Eqs. (1) and (2)) is recommended by the American Bureau of Shipping
[8] for an open ocean, such as the Atlantic.
S Hs pexp p
η ω ω ω ω ω
( )
= − 5 16 5 4 2 4 5 4, (1)
or,
S H
T exp T
s p s s η ω ω πω π π π ω
( )
= − − 2 4 5 4 4 4 42 1 2
. (2)
The Joint North Sea Wave Project (JONSWAP) spectrum (Eqs. (3) and (4)) modified the
Pierson-Moskowitz spectrum [9] above to account for regions
with geographical boundaries the limit the fetch in wave generation.
S Hs pexp p a
η ω ω ω ω ω γ γ
( )
= − (
−)
5 16 54 1 0 287
2 4
5
4
. ln , (3)
where: a exp p
p = −
(
−)
ω ω σ ω 2 2 22 and
σ= ω ωω ω≤ > 0 07 0 09 . . . for for p p
Factor (1 – 0.287 lnγ) limits JONSWAP
application since the spectral value is zero for γ = 32.6; in which case,
S g exp p a
η ω α ω ω ω γ
( )
= − 2 5 4 54 . (4)
To cover the variety of wave shapes associated with swell, storm growth and decay, the six-parameter Ochi-Hubble wave spectrum (Eq. (5)) was proposed
[10]. S H j j pj j sj j j η ω λ λ ω λ ω λ
( )
= + ( )
× × − + = +∑
1 4 4 1 4 4 1 4 1 2 4 2 4 1 Γexp
ω ω pj 4
. (5)
where j = 1, 2 stands for the swell (lower) and
wind-sea (higher) frequency components. The six
parameters Hs1, Hs2, ωp1, ωp2, λ1, and λ2 are determined
numerically to minimize errors.
0.3 Governing Equations
The governing equations that run the OrcaFlex [11]
to [13] algorithm include Newton’s Second Law,
Morrison, Navier-Stokes and catenary equations.
0.3.1 Newton’s Second Law of Motion;
Newtonian force F is the sum of the inertia, damping
(viscous) and elastic force-components as in Eq. (6):
F Ma Cv kx= + + . (6)
0.3.2 Morrison Equation
In the Morrison equation, fluid force F is the sum of
the Froude-Krylov force FFK, hydrodynamic force FH
and the drag force FD.
F=ρVu+ρC V u va
(
−)
+ ρC A u v u vd(
−)
− 12
. (7)
On simplifying, the fluid force becomes equal to the sum of the inertia force and drag-force.
F=
(
∆aw+C aa∆ r)
+ C AV Vd r r1 2ρ
. (8)
0.3.3 Navier-Stokes Equation
Fluid inertia is equal to the sum of the pressure gradient, viscous force and body force.
ρ ∂ ∂ + ∂ ∂ + ∂ ∂ + ∂ ∂ = = −∂ ∂ + ∂ ∂ + ∂ ∂ + ∂ ∂ v
t u vx v vy w wz p
y µ xv yv zv
2 2 2 2 2 2
+Fy, (9)
ρ ∂ ∂ + ∂ ∂ + ∂ ∂ + ∂ ∂ = = −∂ ∂ + ∂ ∂ + ∂ ∂ + ∂ ∂ w
t u wx v wy w wz p z µ w x w y w z 2 2 2 2 2 2
+Fz, (10)
ρ ∂ ∂ + ∂ ∂ + ∂ ∂ + ∂ ∂ = = −∂ ∂ + ∂ ∂ + ∂ ∂ + ∂ ∂ w
t u wx v wy w wz p z µ w x w y w z 2 2 2 2 2 2
0.3.4 Catenary Equation
Steel catenary risers being pipelines suspended between a production platform and the seabed adopts an approximate catenary shape, defined by Eq. (12).
y H
w w xH
=
−
cosh 1 . (12)
where w is weight per unit length of riser and H is
a constant representing horizontal component of tension.
1 MATERIALS AND METHODS
To study the influence of fatigue in SCR adequately, two wave application modes (Ochi-Hubble wave spectra and JONSWAP wave spectra) were adopted using Orcina OrcaFlex software. The software quality assurance is based on the requirements of BS 5750, 5887, and 5515, and on Defence Standard 00-16. Its validation checks include checking the program against mathematical theory, the real world, and against other institutional computer programs.
Larsen [14] reported results from static and
dynamic analyses of standard flexible riser systems performed by eleven different institutions using their in-house software. OrcaFlex developers took part in the major comparison of flexible riser programs initiated by the International Ship and offshore Structures Congress (ISSC) “Slender Marine Structures” committee. The study contains a complete description of the test cases and results that provide a benchmark test for users and programmers of computer code for flexible riser analysis. The results showed good agreement between OrcaFlex and other established programs with a 10 % to 15 % coefficient of variation.
A large-scale test has been carried out in Lake Pend Oreille under a joint industry project
by scientific marine services (SMS) [15] for PMB
Engineering; Australia. OrcaFlex results showed very close agreement with the test results, including details of SCR behaviour at touchdown. A major validation exercise was carried out to compare OrcaFlex with model test results obtained from a joint industry
project [16]. Good agreement was obtained.
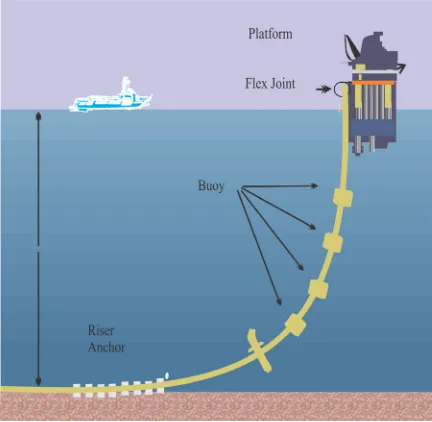
In this study, an SCR [17] and [18] comprising a
line with the end-A of the riser attached to the FPSO and end-B anchored to the seabed as in Fig. 1 is modelled by carrying out the following tasks using the OrcaFlex post-processor software:
a) Set the SCR line length to be 2,200 m and as a homogenous pipe with flex joint, strake, riser
pipe and flowline lengths modelled on the line (in that order) with the height of 1000 m set above the seabed with an azimuth angle of 180º.
Fig. 1. Typical steel catenary riser between an FPSO and seabed
b) A 6D buoy is modelled and anchored onto the SCR-line.
c) The design parameters and environmental properties, which included the wave train of both Ochi-Hubble, a two parameter wave spectra that fully describes the typical sea state (valid for the swell and wind-sea conditions) of the Gulf of Guinea and that of JONSWAP were inputs in the different cases.
d) The line modelled as a riser is given real life data-values. Typical SCR data imputed to this study include: pipe of outer diameter 273.1 mm, inner diameter 205.7 mm, and thickness 67.4 mm, density 7850 kg/m³, elastic modulus
200 GPa, second moment of inertia 8.67×10⁻⁵,
mass per unit length 128.2 kg/m, bending
stiffness 3.27×10⁶ kN, axial stiffness 1.73×10⁴
kN, torsional stiffness 10 kNm2/rad, design life
20 years, bulk modulus 160 GPa, yield strength 483 MPa, tensile strength 562 MPa, kinematic
viscosity 1.35×10⁻⁶ m²/s; and the SCR-contents,
which is a crude oil of density 800 kg/m³ and flow rate of 0.1 kg/s.
e) Global analysis: This describes the overall static and dynamic structural behaviour of the riser by exposing the system to a stationary environmental loading condition [19]:
environmental forces, weight, buoyancy and drag forces. After running the static analysis of this model, there was a static convergence for the model after a maximum of 100 iterations.
• The dynamic analysis is a time simulation of the SCR-model motion for a specified period, starting from the static analysis position. The real life environment data for current, wind and seabed conditions were used as inputs. Typical environment data used as input parameters in this study include: (i) metrological Ocean data for 100 years return period: significant wave height 4 m, most probable maximum wave height 7.8 m, crest of maximum individual wave 4.5 m, peak spectral period 15.5 s, mean zero crossing 7.17 s, mean wave direction 189°, (ii) wind data 10 min wind speed 20.4 m/s, wind direction 180 Set the SCR line length to be 2,200 m and as a homogenous
pipe with flex joint, strake, riser pipe and flowline
lengths modelled on the line (in that order) with the height of 1000 m set above the seabed with an azimuth angle of 180°, (iii) current data:
current speed (below 1000 m depth)0.15, surface
directions 180°, (iv) sea water data: sea surface temperatures 25 °C, near-bed sea temperatures 4 °C, sea water density 1025 kg/m³, depth of water 1000 m, (v) seabed data: soil friction coefficient 0.45 (nonlinear soil model was adopted). In running this dynamic analysis, the simulation time was first set at 16 s and observed before being run for 3 h, the severest sea state in the Gulf of Guinea.
f) Fatigue analysis was carried out on the SCR model for both Ochi-Hubble and JONSWAP wave spectra for comparison. Before the fatigue analysis was performed, a set of Orcaflex simulation files that model the system was prepared under possible real-time load conditions. This load case was assigned an exposure level of 20 years (175,200 h) riser design life.
2 RESULTS AND DISCUSSION
2.1 Fatigue Life - Arc Length Analysis
From Fig. 2 based on the JONSWAP wave spectrum, it can be observed that:
• hang-off fatigue life, HOFL is 10 years;
• fatigue life range, FL; 500 years < FL < 5,000 years;
• TDP fatigue life, TDPFL = 1.8 years at 1828.8 m;
• maximum fatigue life beyond TDP FLmax =
10,000 years.
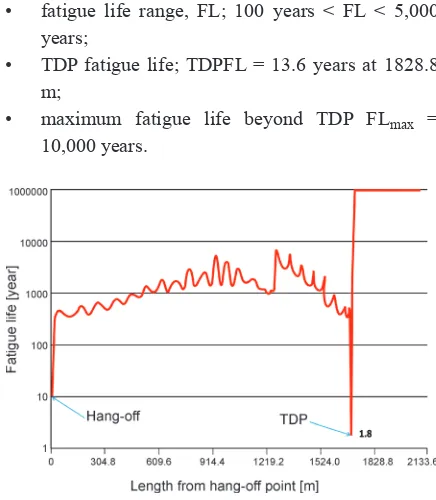
From Fig. 3, based on Ochi-Hubble wave spectrum, it can be observed that:
• hang-off fatigue life; HOFL ≈ 7 years;
• fatigue life range, FL; 100 years < FL < 5,000 years;
• TDP fatigue life; TDPFL = 13.6 years at 1828.8 m;
• maximum fatigue life beyond TDP FLmax =
10,000 years.
Fig. 2. Fatigue life versus SCR length from hang-off point in JONSWAP wave spectra
Fig. 3. Fatigue life versus SCR length from hang-off point in Ochi-Hubble wave spectra
Fig. 4. SCR tension versus arc length curve
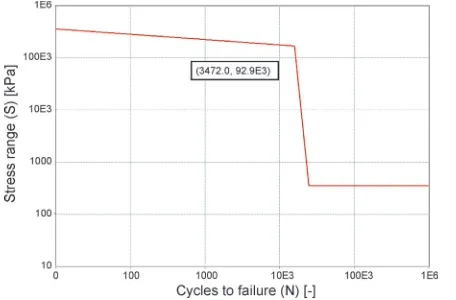
2.2 Stress (S) – Cycles (N) to Failures
The S-N curves in Figs. 5 and 6 showed that higher
stress values (S) caused a lower number of cycles to
failure (N), that is, lower endurance limits.
Fig. 5. Stress S versus cycles to failure N curve for SCR in JONSWAP wave spectra
The fall rate of stress with respect to cycles is higher with the JONSWAP spectra than the
Ochi-Hubble spectra. Comparing the slopes of the S-N
curves, it can be observed that the fall-rate for JONSWAP spectra is almost of order > 100 on a log-log scale relative to the Ochi-Hubble spectra. This implies that when the stresses due to environmental loading vary, it will have an effect on the riser life before failure.
Fig. 6. Stress S versus cycles to failure N curve for SCR in Ochi-Hubble wave spectra
3 CONCLUSION
Using an SCR model in Ochi-Hubble wave spectra gives a higher fatigue life than JONSWAP spectra, which are often used by design companies. With a higher SCR fatigue life in Ochi-Hubble wave spectra, there is no overdesign since it thoroughly describes the actual sea state in the Gulf of Guinea.
SCR modelled in JONSWAP wave spectra gave a misrepresentation of the SCR fatigue life leading to overdesign, which implies high cost both on the side of multinational companies and contractors.
Stress variations due to environmental loading contributed immensely to SCR fatigue damage.
The high tension observed at the SCR hang-off, close to the FPSO, with both wave-spectra can be attributed to the combined action of waves, wind and current, as well as, FPSO heavy motion.
4 NOMENCLATURE
A drag area, [m²]
C viscosity damping factor, [Ns/m]
Ca added mass coefficient of body
Cd drag coefficient for the body
Fx,y,z body force in x,y,z directions, [N/m³]
Hs significant wave height, [m]
M mass, [kg]
P pressure, [Pa]
Sη wave spectral density, [m²/Hz]
Ts average zero up-crossing period, [s]
V volume, [m³]
Vr fluid velocity relative to body, [m/s]
a acceleration, [m/s2]
ar fluid -body relative acceleration, [m/s²]
aw fluid acceleration rel. to earth, [m/s²]
g acceleration due to gravity, [m/s²]
j integer counter
k stiffness, [N/m]
u, v, w x, y, z axis velocity components, [m/s]
t time, [s]
ω circular frequency of the wave, [rad/s]
ωp peak frequency for peak spectrum; [rad/s]
γ peaked-ness parameter (1 to 7).
α parameter
ρ density, [kg/m³]
µ dynamic viscosity, [Pa·s]
Δ Mass of fluid displaced by body, [kg]
λ Ochi-Hubble’s parameters 5 & 6
5 REFERENCES
[1] Song, R., Stanton, P. (2007). Deepwater tieback SCR,
unique design challenges and solutions. Offshore
Technology Conference, paper OTC-18524-MS Houston
DOI:10.4043/18524-MS.
[2] Lim, F. (2006). Installation of risers in deepwaters. 4th
Petromin Deepwater and Subsea Technology Conference and Exhibition, Kuala Lumpur.
[3] Song, R., Stanton, P. (2009). Advances in deepwater steel
catenary riser technology state of art: Part II-Analysis. ASME
28th International Conference on Ocean, Offshore and Arctic Engineering, Honolulu, p. 285-296,
DOI:10.1115/OMAE2009-79405, DOI:10.1115/OMAE2009-79405.
[4] Bai, Y., Bai, Q. (2010). Handbook of Subsea Structural
Engineering, 5th Edition, Gulf Professional Publishing,
Burlington, p. 847-849.
[5] Li, F.Z., Low, Y.M. (2012). Fatigue reliability analysis of a steel catenary riser at the touchdown point incorporating soil model
Uncertainties. Applied Ocean Research, vol. 38, p. 100-110,
DOI:10.1016/j.apor.2012.07.005.
[6] Bai, Y. (2001). Pipelines and Risers, vol. 3. Elsevier Ocean
Engineering Books Series, Bhattacharya, R, McCormick, M.E. (eds.), Elsevier Sciences Limited, Kidlington, p. 84-110.
[7] Xia, J. (2009). Weight – Optimised Steel Catenary Risers
and their Application in Harsh Deepwater Environment, PhD Thesis, University of Strathclyde, Strathclyde.
[8] American Bureau of Shipping (2010). Guide for
Spectral-Based Fatigue Analysis for Floating, Production, Storage and Offloading (FPSO) Installations, update 2014, p. 8-12, Houston.
[9] Vyzikas, T. (2014). Application of Numerical Models and
Codes. A Best Practice Report prepared as part of the MERIFIC Project – Marine Energy in Far Peripheral and Island Communities (MERIFIC), University of Plymouth, Plymouth, p. 56-60.
[10] Ochi, M.K., Hubble, E.N. (1976). Six-Parameters Wave Spectra.
Coastal Engineering Proceedings, p. 301-328.
[11] Orcina Ltd (2013). OrcaFlex version 9.7. Software Technical
Specification. Ulverston, Cumbria.
[12] Orcina Ltd (2013). Orcina Orcaflex, retrieved from: http://www.
orcina.com/SoftwareProducts/OrcaFlex/index.php, accessed on 2013-12-22.
[13] Orcina Ltd (2013). OrcaFlex Manual: Version 9.7a. Orcina,
Ulverston, Cumbria.
[14] Larsen, C.M. (1992). Flexible riser analysis - comparison of
results from computer programs. Marine Structures, vol. 5, no.
2-3, p. 103-119, DOI:10.1016/0951-8339(92)90024-J.
[15] Scientific Marine Services, Inc (1998). Highly Compliant
Riser Large Scale Model Test Joint Industry Project Data Reduction and Report SMS Project 97-504 PMB Engineering,
retrieved from:
http://www.bsee.gov/Technology-and- Research/Technology-Assessment-Programs/Reports/300-399/305AB/, accessed on 2013-12-21.
[16] Hartnup, G.C., Airey, R.G., Fraser, J.M., (1987). Model basin
testing of flexible marine risers. Proceedings of the 6th
International Offshore Mechanics and Arctic Engineering Symposium & Exhibition, Houston.
[17] Bai, Y., Bai, Q. (2005). Subsea Pipelines and Risers, (1st ed.).
Elsevier, Amsterdam.
[18] Bai, Y., Bai, Q. (2012). Subsea Engineering Handbook. Gulf
Professional Publishers (Elsevier), Waltham.
[19] DNV-OS-F201 (2010). Dynamic Risers, offshore standard. Det