Assessing environmental contamination of River Ganga using
correlation and multivariate analysis
Bhutiani, R., Khanna, D.R., Tyagi, B., Tyagi, P.K . and Kulkarni, D.B.
Department of Zoology and Environmental Science Gurukula Kangri University, Haridwar, India.
Received: 13 Jan 2015 Accepted: 22 Apr. 2015
ABSTRACT: The aim of this study was to assess the environmental impact of socio-cultural practices on the water quality of River Ganga at the foothills of the Garhwal Himalayas in Uttarakhand State, India. The physico-chemical parameters that contributed to the t e m p o r a l variation and pollution in t h e river were identified in this study. Principal component analysis (PCA) and Cluster analysis (CA) were used in the identification of anthropogenic factors (industrial, urban sewage, agricultural, land use and mining activities) and natural factors (soil erosion, weathering). The results of this study show that total coliform, fecal coliform, nitrate, sodium, phosphate, sulphate, TDS (Total dissolved solids), temperature, BOD (Biochemical oxygen demand), calcium and chloride are parameters significantly contributing to pollution load.
Keywords: cluster analysis, Ganga River, principal component analysis, water quality.
INTRODUCTION
There are fourteen major river basins in India of which River Ganga, the most reverend river, has been declared the National river of India. The river is fed by the glaciers of the Himalayas primarily by the twenty mile long and three mile wide Gangotri glacier. It travels 200 km through the Himalayas, and reaches the pilgrimage towns of Haridwar and Rishikesh (Uttarakhand) in the Shiwalik Hills and begins to flow in a south-eastern direction through the plains of northern India. River Ganga and its water quality has a bearing on the faith of Hindu devotee, regional economy, economy of state and tourism sector of Uttarakhand. Since past few decades, due to population explosion and rapid industrialization, the beautiful river has been exploited beyond its carrying
266 impact of tourism related activities on the river body. Domestic sewage plays a dominant role in polluting the river. Heavy influx of organic as well as inorganic wastes exert huge impact due to tourism. Haridwar and Rishikesh are two well-known international tourist places. The biggest gathering of Hindus is also held at Haridwar, after every twelve years. Lakhs of devotees take a dip in the holy river. The health of the river is linked with the development of Uttarakhand State and plays a very important role in enhancing the regional economy and improving human habitat. Human activities such as intensive agriculture, urbanization and industrialization contribute to river water deterioration (Cachada et al., 2012). This study was carried out from June (2010) to May (2012) in the Haridwar–Rishikesh region of Uttarakhand State of India. This study identified water quality parameters that could lead to contamination of River Ganges in Haridwar and Rishikesh region and identified the sources of pollution by using correlation analysis and principal component analysis/cluster analysis (PCA/CA) methods.
MATERIALS AND METHODS
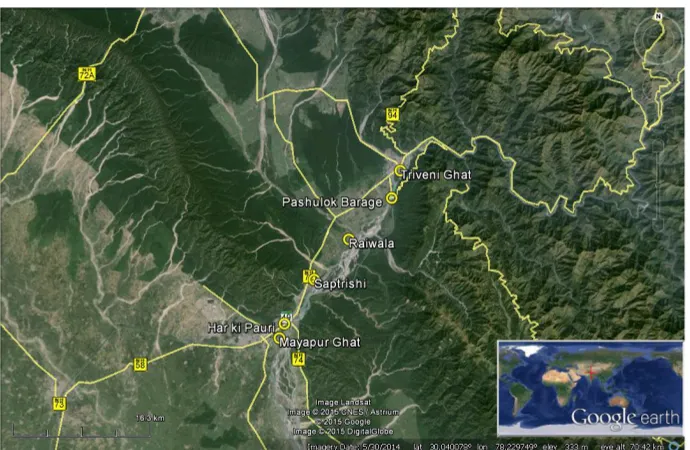
The study area is located in Haridwar-Rishikesh region in Uttarakhand State of India between 29°58"N-29◦58"N and 78°18′51″E-78°10"E. The climate of this particular area belongs to typical subtropical monsoon climate: hot and humid in summers and cold and dry in winters, and has a strong potential for producing enormous quantities of biomass. The sampling locations were selected to cover maximum sites where the actual bathing and other tourist activities were being carried out. Water samples were collected from six sampling sites (Figure 1) from Trivenighat (Rishikesh) to Mayapurghat (Haridwar). Sampling sites included Trivenighat (Rishikesh), Pashulokbarrage (Rishikesh), Raiwala (Rishikesh), Saptarishi (Haridwar), Har-Ki-Pauri (Haridwar) and Mayapurghat (Haridwar). Thus, the duration of the sampling was two years from June (2010) to May (2012). Water quality parameters included temperature, turbidity, TDS, pH, dissolved oxygen, biochemical oxygen demand, chemical oxygen demand, calcium, magnesium, chloride, fluoride, sodium, potassium, nitrate, phosphate and sulphate.
Samples were collected in plastic containers previously washed with detergents and HNO3 acid and later rinsed with sampled
water several times. The samples were then filtered through Whatman filter paper No.1 and preserved at 5C. All samples were determined according to the American Public Health Association Standard Method for Water and Wastewater Analysis (APHA, 1998). The pH of water was estimated by pH meter, while temperatures of the samples were measured at the point of collection using mercury in glass thermometer. Conductivity and TDS were measured by digital conductivity and TDS meter. A turbidimeter was used to determine the turbidity of the samples. DO was measured by the Winkler’s Azide method. Sample was collected BOD bottle and fixed at site using MnSO4 and KI. BOD was measured from
the differences of initial and 5 day DO. COD was determined by titrimetric method after 2 hr open reflux. The acidity and dissolved carbon dioxide were measured by titrimetric method using standard 0.02 M NaOH. The Total and phenolphthalein alkalinity were measured by titrimetric method using phenolphthalein and methyl orange as indicators. Total Alkalinity was determined by titrimetric method using a standard solution of 0.01 M HCl and methyl orange as indicator. Total Hardness was measured by adding calcium and magnesium using EDTA (Ethylene – Di amine Tetra – Acetic Acid) as titrant with ammonium chloride and ammonium hydroxide buffer solution and Erichrome Black T as indicator. Calcium hardness was determined using EDTA method with murexide (ammonium purpate) as indicator. Chloride was determined by the argentometric method, in a neutral or slightly alkaline solution using potassium chromate as indicator by standard silver nitrate as the titrant. Nitrate was determined colorimetrically by UV/visible spectrophometer (Agilent, Cary 60 UV Vis) using brucine sulphate as a complexing
calorimetrically based on a blue complex induced by the addition of stannous chloride. Sulphate was determined turbidimetrically with spectrophotometer using barium chloride as the precipitating agent. TS and TSS were determined gravimetrically and flouride was determined by the SPADNS Zirconium Lake Colorimetric method. The total solid (TS) present in 100 ml of sample water was calculated by evaporating the water sample at 103 to 105C to dryness and keeping the beaker in drying oven, cooling it in desiccators and then weighing the beaker. The TS in mg/1 was the difference in weights of the beaker before filling with sample and after evaporation of sample. All analyses were carried out in triplicate and the mean of three readings was taken as the value. Statistical calculations were performed using the “Statistical Package Software; SPSS-11.5 and Minitab for Windows”. Correlation and other multivariate statistical techniques (PCA and CA) were used to analyze water quality dataset obtained from River Ganges.
RESULTS AND DISCUSSION Baseline Water Quality
Table 1 summarizes the descriptive statistics of the river water quality including mean, median, minimum, maximum, standard deviation and standard error. All the physico-chemical parameters were found to be within permissible water quality limits. However, parameters: Total Coliform and Fecal Coliform were found to exceed permissible standard limits.
268
Table 1. Baseline water quality parameters in the study area
Parameters Mean Median Minimum Maximum SD SE
Temperature (OC) 18.7 18.75 14.12 22.62 2.69 0.55 Turbidity (Siemens/cm) 4.85 5.25 2.87 6 0.84 0.17 TDS (mg/l) 55.62 52.65 34.14 89.41 17.4 3.55 pH 7.61 7.58 7.47 7.78 0.09 0.01 DO (mg/l) 9.71 9.68 8.76 10.6 0.49 0.1 BOD (mg/l) 1.9 1.91 1.41 2.44 0.25 0.05 COD (mg/l) 6.05 6 5.02 8 0.66 0.135
Ca (mg/l) 25.34 25.43 18.02 32.96 4.53 0.92 Mg (mg/l) 6.48 5.54 3.6 13.03 3.09 0.63 Cl (mg/l) 24.43 25.87 13.8 35.52 6.19 1.26 F (mg/l) 0.14 0.14 0.12 0.23 0.03 0 Na (mg/l) 10.84 9.31. 6.94 17.09 3.75 0.76
K (mg/l) 2.72 2.72 1.75 3.55 0.58 0.12 NO3 (mg/l) 0.18 0.18 0.13 0.22 0.02 0 PO4 (mg/l) 0.06 0.06 0.04 0.09 0.01 0 SO4 (mg/l) 21.07 20.53 18.31 24.29 2.03 0.41 Total Coliform 2606.3 2742.1 1981.4 3138 344 70.2 Fecal Coliform 4236 4701 2269 5548 1126 230
Table 2. Matrix showing coefficient of correlation between parameters
Temp Turbidity TDS pH DO BOD COD Ca Mg Cl Fl Na K Ni PO4 SO4
Temperature
Turbidity 0.63
TDS 0.17 0.4
Ph 0.14 0.13 0.37
DO -0.62 -0.42 -0.5 -0.6
BOD 0.85 0.5 0.13 0.35 -0.8
COD 0.29 0.56 0.2 -0.1 -0 0.1
Calcium 0.78 0.61 0.46 0.56 -0.8 0.76 0.25
Magnesium -0.39 0.38 0.31 -0.1 0.17 -0.38 0.28 -0.3
Chloride 0.79 0.6 0.61 0.31 -0.8 0.75 0.31 0.85 -0.2
Fluoride -0.06 0.3 0.35 0.32 -0.2 -0.14 -0.06 0.27 0.33 0.1
Sodium 0.27 0.43 0.75 0.57 -0.7 0.42 0.09 0.62 0.08 0.6 0.4
Potassium -0.49 0.13 0.58 0.23 0.09 -0.45 0.15 -0.1 0.67 -.1 0.5 0.5
Nitrate 0.16 0.43 0.59 0.37 -0.4 0.25 0.17 0.48 0.15 0.5 0.5 0.8 0.6
Phosphate -0.03 0.61 0.65 0.12 -0.2 -0.08 0.34 0.25 0.68 0.3 0.6 0.6 0.8 0.7
Sulphate 0.24 0.54 0.77 0.48 -0.7 0.34 0.16 0.64 0.28 0.6 0.5 0.9 0.5 0.8 0.79
TC -0.08 0.26 0.44 0.2 0.12 -0.04 0.26 0.29 0.2 0.2 0.5 0.7 0.7 0.9 0.72
FC 0.09 0.49 0.63 0.32 -0.2 0.08 0.45 0.43 0.3 0.5 0.5 0.7 0.7 0.8 0.79 0.88
and nitrate (0.86), Total coliform and phosphate (0.72), fecal coliform and nitrate (0.81), fecal coliform and phosphate (0.79), Fecal coliform and Sulphate (0.75) suggested the luxurious growth of microbes due to heavy influx of organic matter. Sodium and nutrients such as nitrate (0.81), sulphate (0.88) and phosphate (0.622) showed high degree of correlation. Potassium also showed
a very high degree of correlation with domestic sewage, as well as land use activities. Parameters such as temperature, BOD, calcium, chloride and turbidity showed high inter dependency among each other and were associated with pollution caused by organic pollutants e.g negative correlations were observed among DO, BOD and COD. The results of correlation indicated that TDS showed moderate relation with calcium (0.46), chloride (0.61), potassium (0.58), nitrate (0.59) and phosphate (0.65). While turbidity was found to be moderately associated with BOD (0.50), COD (0.56), calcium (0.61), chloride (0.60), sodium (0.43), nitrate (0.43), phosphate (0.61) and sulphate (0.54). The pH showed moderate correlation with calcium (0.56) and sodium (0.57), while moderate correlations were observed between calcium and sulphate (0.64), calcium and nitrate (0.48), calcium and sodium (0.62), magnesium and potassium (0.67), magnesium and phosphate (0.68), chloride and sodium (0.61), chloride and sulphate (0.60), sodium and potassium (0.52) and potassium and nitrate (0.55). Table 2 shows the results of correlation between parameters. All these associations suggested that the surface chemistry of the river is mainly controlled by temperature, TDS, Na, chloride and nutrients. The high Na and Cl contents detected in certain samples suggests the dissolution of chloride salts. Research shows that dissolution of halite in water releases equal concentrations of Na and Cl into the solution (Belkhiri et al., 2010).
Principal Component Analysis/Factor Anaysis (PCA/FA) was applied to the data set to identify the principal factors of pollution. Mathematically, PCA normally the following five major steps: i) Coding of the variables X1,X2,……Xn (which are the
16 physico-chemical parameters in the present study) and standardization of the measurements to ensure that all have equal weights in analysis, ii) The calculation the
270 Eigen values of 1.0 or greater are considered significant (Kim and Mueller, 1978). Kaiser’s varimax rotation scheme was employed and factor loadings were classified as ‘strong’, ‘moderate’ and ‘weak’, corresponding to absolute loading values of >0.75, 0.75–0.50 and 0.50–0.30, respectively (Kim and Mueller, 1978). PCA revealed that the first four factors explained approximately 85.40% of the
total variance. Evidently, the first factor was more correlated with the variables than the other factor. Four varifactors (VFs) shown in Table 3 were obtained through the FA performed on the PCs. Table 3 shows that the four varimax rotated factors accounted for more than 85% of the total variance and hence could explain temporal variation in the hydrochemistry.
Table 3. Varifactors identified through PCA
Variables VF1 VF2 VF3 VF4 Communality
Temperature -0.084 0.922 0.138 -0.238 0.932 Turbidity 0.210 0.636 -0.521 -0.422 0.898 TDS 0.561 0.356 -0.459 0.155 0.676 pH 0.303 0.415 -0.108 0.612 0.650 DO -0.185 -0.850 0.102 -0.374 0.908 BOD -0.023 0.916 0.198 0.019 0.880 COD 0.207 0.237 -0.216 -0.773 0.743 Calcium 0.318 0.898 0.002 0.079 0.913 Magnesium 0.139 -0.294 -0.890 -0.193 0.936 Chloride 0.309 0.874 -0.005 -0.099 0.870 Fluoride 0.470 0.014 -0.467 0.297 0.528 Sodium 0.761 0.467 -0.181 0.265 0.900 Potassium 0.695 -0.366 -0.543 0.092 0.921 Nitrate 0.892 0.262 -0.094 0.040 0.875 Phosphate 0.694 0.057 -0.653 -0.169 0.939 Sulphate 0.736 0.454 -0.373 0.179 0.919 Total Coliform 0.974 -0.035 -0.026 -0.110 0.962 Fecal Coliform 0.900 0.178 -0.211 -0.206 0.929
Factor 1 explained 45.40% of the total variance and had strong positive loadings for total coliform and Feacal coliform. This factor keened towards a negative influence on surface water quality as a result of domestic waste. Hence, this factor represented organic contamination. In addition, this factor had moderate loadings for TDS, sodium, nitrate, potassium and phosphate, indicating that pollution sources included agricultural runoff from a nearby region. This factor also represents erosion from upland areas during rainfall as TDS had high loading for this very factor (Shrestha and Kazama, 2007). Factor 2 had strong
indicator. Factor 3 had high loading for COD and slightly negative loading for pH, thus indicates slight pollution from industrial sewage. The industrial activities were incident from nearby region and were likely to be the source of Factor 3. Thus this factor represented the organic, as well inorganic contamination. Factor 4 had a high positive loading for pH and high negative loading for DO. This factor was labeled as water quality indicator and explained 5.80% of the total variation. Additional factors provide marginally less explanatory capability and were not examined further. Magnesium, Fluoride and COD were considered as non principal on the basis of first two factors as it accounted for 69.60% of the total variance. The Loading plot given in Figure 2 shows the position of Total coliform, Fecal coliform, Nitrate, Sodium, Phosphate, Sulphate and TDS towards the right most corner along VF-1 (Factor 1) axis that represent their maximum contribution and their position near to zero along PC-2 axis, which shows almost no contribution at all. Temperature, BOD, Calcium and Chloride were observed to be towards the left most corner of the plot indicating no contribution of these parameters to the VF-1, while maximum contribution along the VF2 axis is shown. 64% variance is seen along PC-1 axis where TDS lies at the right most position. The remaining parameters such as pH, COD and Magnesium were found to be centralized showing negligible contribution towards either factor.
272 surface water could be attributed to the interaction of water with rocks and secondly, the association of TDS with higher concentration of Na and K ions.
Fig. 3. Dendogram showing clustering of parameters
CONCLUSIONS
In this study, four most significant factors were identified as causal agent of temporal variation at all the study's sites. The first two factors indicated anthropogenic influence on the overall river water quality due to domestic sewage, agricultural runoff and slight land use activities. The third and fourth factors represented anthropogenic impacts such as industrial and mining activities. The results showed that physico-chemical parameters namely total coliform, feacal coliform, nitrate, sodium, phosphate, sulphate and TDS, temperature, BOD, calcium and chloride were principal factors contributing to pollution load. Similar results were reported in another study of River Cauvery in Karnataka, India where the main factors included BOD, COD, TC, FC, Conductivity, TDS and chlorides (Sudevi and Lokesh, 2012). The overall analysis supported the fact that the main contributors towards the temporal variation among the parameters in river water were Domestic and other discharges. A similar finding was noted in a study in Sri Lanka, which concluded that the water quality of Kelani River significantly depends on the different land use characteristics (Athukorala et al., 2013). This could be attributed to increased tourist activities
leading to heavy organic and inorganic influx into the river's water in the form of Domestic sewage. Cluster analysis was in line with the results of Factor analysis. Non principal parameters: Magnesium, fluoride and COD were identified as non principal parameters on the basis of factor analysis and cluster analysis, as these parameters did not explain the temporal variation in this study. The outcome showed that there was a potential for improving the efficiency and economy of the monitoring network in this particular river by reducing the number of monitoring parameters.
REFERENCES
American Public Health Association (1998). Standard Methods for the Examination of Water and Waste Water, 20th Edition. (American Public Health Association, Washington DC).
Athukorala, S.W., Weerasinghe, L.S., Jayasooria, M., Rajapakshe, D., Fernando, L., Raffeeze, M., Miguntanna, N.P. (2013). An anlysis of water quality variation in Kelani river, Sri lanka using Principal Component Analysis.(Paper presented at Research Symposium on Engineering Advancements SAITM – RSEA 2013)
Belkhiri, L., Boudoukha, A., Mouni, L., Lotfi, T. and Baouz (2010). Multivariate statistical characterization of groundwater quality in Ain Azel plain, Algeria. African Jr. Env. Sc. and Tech. Vol. 4(8), pp. 526-534.
Bhutiani, R. and Khanna, D. R. (2007). Ecological Status of River Suswa: Modelling DO and BOD. Environ. Monit. Assess.Vol. 125:183-195.
Bhutiani, R., Khanna, D.R., Kulkarni, D.B. and Ruhela, M. (2014). Assessment of Ganga River Ecosystem at Haridwar, Uttarakhand, India with reference to Water Quality Indices. Appl.Wat. Sc. Springer DOI 10.1007/s13201-014-0206-6.
Bu, H., Tan, X., Li, S. and Zhang, Q. (2009).Water quality assessment of the Jinshui River (China) using multivariate statistical techniques. Environ. Earth Sci., 2009, 60(8):1631– 1639.
Cachada, A., Pereira, M.E., Ferreira, E., Duarte, A.C. (2012). Sources of potentially toxic elements and organic pollutants in an urban area subjected to an industrial impact. Environ. Monit. Assess.184:15-32. DOI: 10.1007/s 10661-011-1943-8.
multivariate social scientist: Introductory statistics using generalized linear models. (Thousand Oaks, CA: Sage Publications).
Juahir, H., Zain, S.M., Yusoff, M.K., Hanidza, T.I.T., Armi, A.S.M., Toriman, M.E., Mokhtar, M. (2010). Spatial water quality assessment of Langat River Basin (Malaysia) using environmetric techniques. Environ. Monit. Assess. 173(1-4):625– 641.
Khanna, D.R., Sarkar, P., Gautam, A. and Bhutiani, R. (2007). Fish scales as bio-indicator of water quality of river Ganga. Environ. Monit. Assess. Vol. 134: 153-160.
Khanna, D.R., Bhutiani, R., Tyagi, B., Tyagi, P.K. and Ruhela, M. (2012). Assessment of water quality of River Ganges during Kumbhmela 2010. Env. Cons. J.Vol 13 (3):165-169.
Khanna, D.R. and Bhutiani, R. (2003a). Limnological characteristics of river Ganga at Haridwar (Uttaranchal), U.P. J. Zoo.23(3): 179-183.
Khanna, D.R. and Bhutiani, R. (2003b). Limnological status of Satikund pond at Haridwar (U.A). Indian J. Env. Sc.7(2): 131-136.
Khanna, D.R. and Bhutiani, R. (2004). Fish and their ecology of river Ganga at GohriGhat, Garhwal (Uttaranchal). (In: Proc. of national seminar Fish Diversity in protected habitats.(8: 291-298) Nature Conservator Publication).
Khanna, D.R., Bhutiani, R. and Chandra, Kumar S. (2009). Effect of the euphotic depth and mixing depth on phytoplanktonic growth mechanism. Int. J. Env. Res. 3(2):223-228.
Khanna, D.R., Bhutiani, R. and Ruhela, M. (2013). Fish diversity and their limnological Status of Ganga river system in foothills of Garhwal Himalaya, Uttaranchal, India. J. Environ. Res. Develop. Vol. 7 No. 4: 1374-1380.
Khanna, D.R., Bhutiani, R., Pathak, S.K., Tyagi, P. and Tyagi, B. (2008). Effect of tourism on the physico-chemical parameters of stream Nalhota at guchu Pani, District Dehradun (India): Env. Cons. J. Vol-9 No. (3):109-115.
Kim, J.O., Mueller, C.W. (1978).Introduction to factor analysis: what it is and how to do it. Quantitative applications in the social sciences series. (Newbury Park, CA: Sage).
Panda, U.C., Sundaray, S.K., Rath, P., Nayak, B.B. and Bhatta, D. (2006). Application of factor and cluster analysis for characterization of river and estuarine water systems-a case study: Mahanadi River (India). J. Hydrol., 331(3-4):434– 445. Shrestha, S. and Kazama, F. (2007).Assessment of surface water quality using multivariate statistical techniques: A case study of the Fuji river basin, Japan. Environ. Modell. Softw. 22(4):464-475. Sudevi B. and Lokesh K. (2012).Evaluation of Cauvery River Water Quality at Srirangapatna in Karnataka using Principal Component Analysis.International J. Eng. and Sc.Vol. 1, Issue 4 (October): 6-12