in the population sciences published by the Max Planck Institute for Demographic Research Konrad-Zuse Str. 1, D-18057 Rostock · GERMANY www.demographic-research.org
DEMOGRAPHIC RESEARCH
VOLUME 22, ARTICLE 31, PAGES 985-1014
PUBLISHED 01 JUNE 2010
http://www.demographic-research.org/Volumes/Vol22/31/ DOI: 10.4054/DemRes.2010.22.31
Research Article
Moving close to parents and adult
children in the Netherlands:
The influence of support needs
Annika Smits
© 2010 Annika Smits.
This open-access work is published under the terms of the Creative Commons Attribution NonCommercial License 2.0 Germany, which permits use, reproduction & distribution in any medium for non-commercial purposes, provided the original author(s) and source are given credit.
1 Introduction 986
2 Theoretical framework 987
2.1 Intergenerational solidarity and moving 987 2.2 Support needs associated with moving close to parents or children 988 2.3 Other factors associated with moving 990
2.4 The Netherlands context 991
3 Data and method 991
3.1 Data 991
3.2 Dependent variable 994
3.3 Independent variables 995
3.4 Method 997
4 Results 1004
5 Discussion 1007
6 Acknowledgements 1008
Moving close to parents and adult children in the Netherlands:
The influence of support needs
Annika Smits1
Abstract
In this paper, the extent to which support needs lead to moves of adult children (aged 30 and above) to within one kilometer of their parents and vice versa is examined. Using Netherlands population data from 2004 and 2005, it is found that the divorce of the adult child increases the likelihood of moving close to parents, especially in the event of recent divorce. A recent first birth in the adult child’s household also leads to moving close to parents, whereas having children aged one and above makes moves of the parents close to the adult child more likely.
1. Introduction
Despite the increasing individualization in western societies, the ties between parents and their adult children in terms of support and contact are still strong. The extent to which parents and children exchange support and maintain contact varies, particularly when they live close to each other (see for example Bordone 2009; Grundy and Shelton 2001; Hank 2007; Knijn and Liefbroer 2006; Mulder and Van der Meer 2009). Although living close to kin does not necessarily imply the exchange of support, certain types of support require the close proximity of a caregiver (Joseph and Chalmers 1996; Litwak 1985; Shelton and Grundy 2000). It is plausible, therefore, that parents and children move close to each other when either of them has an increased need for support or contact.
Yet, although a large amount of research addresses the importance of geographical proximity for kin support, only a few studies have considered the location of parents and children as triggers for moving. Furthermore, these studies mainly focus on the moves of only one of the two generations (of parents: Litwak and Longino 1987; Silverstein 1995; Rogerson, Burr, and Lin 1997; Van Diepen and Mulder 2009: of children: Michielin, Mulder, and Zorlu 2008). These studies leave open the question of which generation is more likely to move close to the other and whose support needs are better predictors for such a move. Other studies of the geographical proximity between parents and children have only investigated the decrease in the distance between them, failing to distinguish between those who move close (but still as far as a 15-minute drive away) and those who move very close (e.g., a 5-minute walk away) (Michielin, Mulder, and Zorlu 2008; Silverstein 1995; Rogerson, Burr, and Lin 1997). This deficiency is unfortunate because people who move very close to their parents or children are likely do so because they want to have close contact or exchange support, while people who move less close are more likely to have other motives for their move (Pettersson and Malmberg 2009). Moreover, even though it is likely that moving in with parents or children is associated with housing problems rather than with support needs, in previous research this type of move has not always been separated from other moves to be closer (Pettersson and Malmberg 2009; Rogerson, Burr, and Lin 1997; Silverstein 1995).
resulted in coresidence have been excluded and analysed in a separate paper (Smits, van Gaalen, and Mulder forthcoming). The analyses have been performed using multinomial logistic regression models and data derived from the Social Statistical dataBase (SSB), which consists of rich administrative individual data for the entire Netherlands population.
2. Theoretical framework
2.1 Intergenerational solidarity and moving
Following the processes of individualization and urbanization, concern has been expressed that distances between family members will grow and family ties weaken (Burgess 1960; Cowgill 1974; Aboderin 2004). Nevertheless, recent studies have revealed that many older Europeans still live close to their adult children and maintain contact at least once a week (Hank 2007), and that intergenerational distances have not increased during the past decade (Malmberg and Pettersson 2007), at least not in Sweden.
Distances between parents and children are shaped by the moves of either generation during the life course (Lin and Rogerson 1995). For the younger generation, who move more frequently than the older, moves are often driven by life-course events such as entering the labour market or having a child (Mulder and Wagner 1998; Feijten and Mulder 2002). The proximity of kin is not necessarily required for these event-driven moves, but may well be taken into account, especially by those with an increased need for support (Michielin, Mulder, and Zorlu 2008). For the older generation, mobility tends to decline towards retirement and grow slightly afterwards, where, following Litwak and Longino’s (1987) developmental model, three categories can be distinguished: (a) moves to more attractive locations after retirement; (b) moves closer to kin following health problems or widowhood; and (c) moves to institutions.
because they have strong ties to their residential environment for reasons of work or childcare. Regardless of who has the better opportunities to move, the support needs of either generation may lead to moves close to parents or children. I expected to find that the generation with the greater support needs would be the most likely to move. Thus, the support needs of the adult child were expected to be associated with the child’s move close to the parents and the support needs of the parents with the parent’s move close to the adult child.
2.2 Support needs associated with moving close to parents or children
Not only does the geographical proximity between parents and children facilitate the exchange of intergenerational support, but the distance between parents and children also decreases with increasing parental support needs (Silverstein 1995; Rogerson, Burr, and Lin 1997). In the United States, elderly parents with health problems tended to move closer to their offspring in order to receive their support (Longino et al. 1991; Serow and Sly 1991). In the Netherlands, adult children were found to move closer to parents in the case of a divorce or recent childbirth (Michielin, Mulder, and Zorlu 2008). It should be stressed that many support needs are likely to lead to moving in general, such as a move to a ground-floor apartment when climbing stairs becomes difficult or moving out of a formerly shared residence in the case of divorce. The aim of this paper is, however, to establish whether people with greater support needs are extra likely to move close to parents or children.
The need for support from parents or adult children might be less strong when a partner is present in the household, the person likely to be the first to turn to (Mulder and Van der Meer 2009). Furthermore, having a partner might reduce the likelihood of moving, because then the new residential location has to be advantageous for two people, both at risk of losing location-specific capital. It was, therefore, expected that unmarried (or unpartnered) children would be more likely to move close to their parents than partnered children would be. For the same reason, parents without a partner were also expected to be more likely to move close to their children than parents with a partner would be.
The presence of children in the household often involves stronger ties to a specific location, such as to the children’s school and friends in the neighbourhood (Long 1972), which make moving away from that location less likely. However, these ties do not yet exist in the year following the first childbirth, when young parents are still likely to make adjustment moves (Deurloo, Clark, and Dieleman 1994; Mulder and Wagner 1998). When these adjustment moves are made, moving close to parents is likely to be an attractive possibility for those who need help with childcare and childrearing. I therefore expected that, compared with childless adult children, those with a recent first-born were more likely to move close to parents. Other adult children with children could be expected to be less likely than their childless counterparts to move close to parents, particularly those with children of school age. At the same time, the presence of children in the adult child’s household might stimulate the parents to move close. That would facilitate fulfilling their desire to spend time with their grandchildren and to provide support when needed (Lin and Rogerson 1995). The help of parents in the provision of childcare for grandchildren might be particularly needed when the grandchildren are below school age (four or younger).
Health problems or problems with performing activities of daily living are likely to generate support needs that require the proximity of a caregiver (Litwak 1985; Joseph and Chalmers 1996) and might be associated with a move close to parents or children. Unfortunately, the data used did not contain information about problems with activities of daily living, but did reveal whether people received a disability benefit. Dependence on a disability benefit was expected to be associated with a move close to parents or children.
It can be hypothesised that children and parents who have a high income (and are able to buy care on the market when needed) have a less strong need for the proximity of kin. Also, people with higher incomes are likely to have specialized jobs, which are more widely dispersed than non-specialized jobs. People with higher incomes might find moving away from their place of residence difficult and would be less likely to move close to parents or adult children. It was also expected that adult children and parents who depend on social security benefits or who do not receive any income from labor or social security benefits would be more likely to move close to kin because they are more likely than their employed counterparts to have increased support needs (see also Hank 2007).
residence of their male employed partner (Mulder and Wagner 1993; Boyle, Halfacree, and Robinson 1998).
Moving close to parents was expected to be more likely when other siblings already live close to parents, because the presence of siblings may add extra value to the parents’ location (Michielin, Mulder, and Zorlu 2008). For the parents, however, the likelihood of moving close to an adult child is probably smaller when at least one other child already lives close because contact and care might have already been provided for by this alternative caregiver (Mulder and Van der Meer 2009). The absence of such alternative caregivers was expected to increase the likelihood that only children move close to parents and that parents move close to their only child.
2.3 Other factors associated with moving
An important factor associated with moves close to parents and children is level of education. Highly educated children are likely to have higher incomes and thus have better resources to move (Mulder 1993). Mobility is also known to decrease with increasing age. Furthermore, the parents’ likelihood to move close to children was expected to decrease with age because older adults were usually found to be satisfied with their home and residential environment and so less likely to move away (Rogerson, Burr, and Lin 1997).
The direction of the effect of having moved recently was not clear beforehand. On the one hand, I expected the likelihood of moving close to parents or children to be lower for people who had moved only recently, since moving is costly. On the other hand, the longer people have lived somewhere, the less likely it is that they move away from that location (Clark and Dieleman 1996). Furthermore, I expected homeowners to be less likely to move close to kin than renters, because homeowners are more strongly tied to their residential environment than are renters (Speare, Goldstein, and Frey 1975; Courgeau 1985; Helderman, Van Ham, and Mulder 2006).
2.4 The Netherlands context
Some understanding of the Netherlands context is relevant to frame the above expectations about moves close to kin. In the Netherlands, the average distance between parents and children is about 29 kilometers, with 32% of the population having at least one family member (including siblings and parents-in-law) living no further than one kilometer away (Mulder and Kalmijn 2006). The extent to which support is exchanged differs markedly, depending on how far away parents and children live from each other. In the Netherlands, parents who lived five or more kilometers away from their children were considerably less likely to receive help with household chores and odd jobs than parents who lived within five kilometers of an adult child (Knijn and Liefbroer 2006).
The Netherlands’ built environment can be characterized as relatively urbanised, meaning that there are almost no remote rural areas. Owner-occupied housing prevails in the more rural areas, whereas housing in the larger cities is often dominated by the social rental sector.
3. Data and method
3.1 Data
The empirical analyses are based on the Social Statistical dataBase (SSB) provided by Statistics Netherlands (see Bakker 2002 for a description of the SSB). The database includes population register data and other administrative data on the entire Netherlands population, including address registration data. Record linkage between individual records and those of the parents allows for the reconstruction of parent-child networks, although not all parents could be traced in the registers. Record linkage was successful when the parent and child had ever lived in the same municipality after October 1st,
considered a very suitable database for the investigation of a rather uncommon event like moving close to parents or children.
The focus of the analyses was on the moves of children and parents that took place between September 2004 and September 2005. Children aged 30 and above, not living in the parental home and with at least one parent alive during this whole period were selected. Children aged 30 and below were excluded from the dataset because many of them still lived in the parental home. Furthermore, parents older than 90 and those who had their first child at age 18 or younger were excluded because they were considered to be select groups.
Children who already lived within one kilometer of their parents in 2004 were excluded from the analyses. This was the case for 821,7002 children (22.5% of all
people in the data). Table 1 provides an overview of selected descriptive measures for parents and children who lived within one kilometer of each other in 2004 and those who did not. Compared with parents and children who lived farther away, those living at a distance of maximum one kilometer were more often the recipients of a disability benefit or other benefits, were less often employed, and had lower incomes. Parents and children who lived within a one kilometer distance in 2004 were also slightly younger, less often homeowners, more often rural residents, and more often non-Western migrants than those living further away. These results are in line with previous research in which people with a low socioeconomic position were found to be more likely to live close to parents or adult children (for the United States: Clark and Wolf 1992. For several European countries: Hank 2007. For Sweden: Malmberg and Pettersson 2007). The vast majority (94%) of the parents and children who already lived at a one kilometer distance in 2004 remained in the same area in 2005. About 4.5% remained within a ten kilometer distance and almost 1.5% moved to a distance of more than ten kilometers.
The analyses were performed after a listwise exclusion of 38,400 missing values on parental income, 17,500 on parental housing tenure, and 15,900 on the adult child’s housing tenure, which resulted in 2,725,400 observations.
Table 1: Comparison of children and parents who were included in the analyses (N = 2,725,400) and those who were excluded because they already lived within a one kilometer distance in 2004 (n = 821,700)
% (M, SD)
Included in analyses ≤ 1 km in 2004 Situations and events associated with support
needs
Child’s labor-market position
Receives disability benefit 4.12 4.93
Self-employed 7.55 8.69
Employed 73.76 69.98
Receives other benefit 5.47 6.59
Economically inactive 9.10 9.81
Child’s income 1.07; 0.55 0.98; 0.51
Parental labor-market position
Parent receives disability benefit 7.42 9.30
Parent is self-employed 3.02 3.66
Parent is retired 76.15 71.49
Parent is employed 10.47 10.98
Parent receives other benefit 2.94 4.57
Parental income 0.94; 0.37 0.88; 0.34
Child is only child 11.57 13.50
Control variables
Age of child 40.81; 7.49 39.89; 7.32
Age of oldest parent 70.13; 8.66 69.09; 8.70
Child is homeowner 70.45 64.02
Parent is homeowner 50.40 48.10
Child is rural resident 55.06 66.67
Parent is rural resident 59.18 66.65
Child’s migrant status
Non-migrant 90.79 89.57
Non-Western migrant 2.95 5.17
Western migrant 6.26 5.25
3.2 Dependent variable
The moves of parents and children were measured according to four categories: 0 = no move, 1 = moves very close, 2 = moves close, and 3 = moves elsewhere. The choice of this measure is based on the assumption that “the decision about moving and the choice of the destination location will be part of one decision” (Michielin, Mulder and Zorlu 2008:334). Not moving was therefore included as a separate category in the dependent variable, in addition to moves very close, moves close, and moves elsewhere. Moves very close were defined as moves from five kilometers or further away to within a one-kilometer distance. Note that moves that resulted in coresidence were not included in the analyses. The choice of a distance threshold of one kilometer makes it plausible that moves very close to parents or adult children were related to support needs or the wish to maintain contact rather than to other motives. Furthermore, living within one kilometer facilitates the realization of face-to-face contact within a ten-minute walk (or a three-minute bike ride); so that assistance at home can be provided relatively quickly. Support needs that require such close proximity of a caregiver include helping someone up and down stairs, getting dressed, cooking, and shopping. A category ‘moves close’ (moves to within between more than one and ten kilometers or less) was constructed to separate the distances for which the provision of care is still feasible on a daily basis from those for which the provision of daily care is not plausible. For parents and children who already lived within five kilometers in 2004, it was not plausible that moves to within one kilometer were more strongly related to support needs than to other motives (such as moves to larger homes within the same area). For this reason, these moves have been categorized as moves close. Moves elsewhere were defined as moves to a distance of over ten kilometers. The distribution of the dependent variable becomes clear from Table 2.
Table 2: Children’s and parents’ moves between 2004 and 2005, percentages, N = 2,725,400
Children’s moves Parents’ moves % of total % of movers % of total % of movers
No move 92.32 95.46
To within 1 kilometer 0.19 2.51 0.13 2.84
To 1 - ≤ 10 kilometers 3.16 41.17 2.13 46.77
Distances (along a straight line) between the child and the parents were calculated using the geographical coordinates of the centre of each six-digit postal code area. For the parents, the location used was that of both registered parents when they were living together, or that of the only parent living in the Netherlands, or of a randomly-chosen parent when the parents lived apart in 2005. Note that when parents lived apart in 2005, other parental covariates included in the models referred to the randomly-chosen parent as well. To check whether the results would be different for mothers and fathers, I performed additional analyses for mothers and fathers separately (results not shown). These models differed only marginally from the models presented in this paper.
3.3 Independent variables
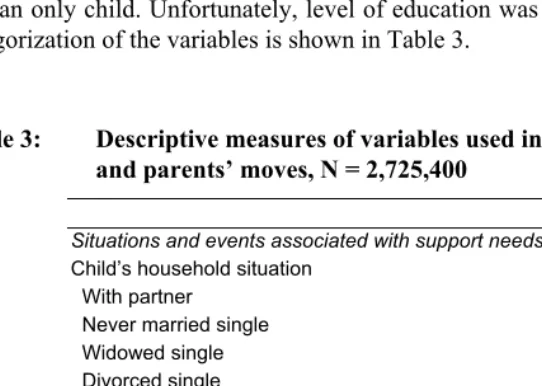
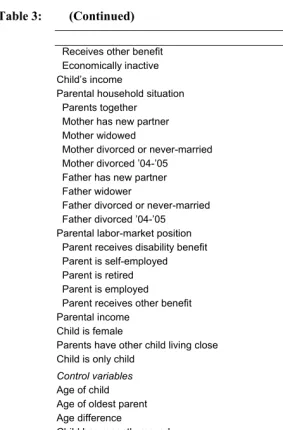
The explanatory variables used in the analyses included the household situation, the presence of children in the adult child’s household, labor-market position, income (as a logarithm), the gender of the adult child, whether parents had (at least) one other child living close (within one kilometer, including coresidence), and whether the adult child was an only child. Unfortunately, level of education was not available in the data. The categorization of the variables is shown in Table 3.
Table 3: Descriptive measures of variables used in the analyses of children’s and parents’ moves, N = 2,725,400
% (M, SD)
Situations and events associated with support needs Child’s household situation
With partner 80.08
Never married single 13.19
Widowed single 0.64
Divorced single 5.43
Divorced ’04-’05 0.67
Child has children in the household
No children 36.30
Recently first child 4.83
Children aged 1 to 4 15.32
Children above age 4 43.56
Child’s labor-market position
Receives disability benefit 4.12
Self-employed 7.55
Table 3: (Continued)
% (M, SD)
Receives other benefit 5.47
Economically inactive 9.10
Child’s income 1.07; 0.55
Parental household situation
Parents together 63.34
Mother has new partner 3.29
Mother widowed 16.71
Mother divorced or never-married 4.81
Mother divorced ’04-’05 0.02
Father has new partner 4.09
Father widower 4.84
Father divorced or never-married 2.88
Father divorced ’04-’05 0.03
Parental labor-market position
Parent receives disability benefit 7.42
Parent is self-employed 3.02
Parent is retired 76.15
Parent is employed 10.47
Parent receives other benefit 2.94
Parental income 0.94; 0.37
Child is female 50.47
Parents have other child living close 27.74
Child is only child 11.57
Control variables
Age of child 40.81; 7.49
Age of oldest parent 70.13; 8.66
Age difference 29.32; 5.07
Child has recently moved 22.07
Parent has recently moved 10.02
Child is homeowner 70.45
Parent is homeowner 50.40
Child is rural resident 55.06
Parent is rural resident 59.18
Child’s migrant status
Non-migrant 90.79
Non-Western migrant 2.95
Western migrant 6.26
‘Household situation’ included the event of divorce, measured as a change in marital status from married to divorced between in 2004 and 2005. The labor-market position of the child and that of the parents included a measurement of receiving a disability benefit. People receive this in the Netherlands if they are unable to earn a full income owing to sickness or a handicap. There was also a measurement of being economically inactive, which corresponds to receiving no income from labor or social-security benefits. ‘Being retired’ was measured in a separate category for the parents, but not for the adult child because very few adult children in the data were retirees. Parents or children who received benefits other than disability benefits and retirement benefits (for example unemployment benefits or other social security benefits), were grouped together in one category: ‘receives other benefit.’ When both parents lived together, the labor-market position that was considered to be most strongly associated with the parents’ support needs was used. The categories ranged from receiving a disability benefit to receiving other benefits or being inactive. Income was taken from the individual tax income in euro per month. Negative incomes and incomes of zero were set at zero in the logarithmic measure. When both parents were alive and living together, the mean of their incomes was used.
When no specification is given, the control variables in the models refer to whoever the analysis pertains to: the adult child in the model of the child’s moves and the parents in the model of the parents’ moves. Included as control variables were: age (as a linear and a quadratic term), age difference from the oldest parent, having moved recently (between 2001 and 2004), being a homeowner, living in a rural area (defined as an area with fewer than 1000 addresses per square kilometer), and the child’s migrant status (where first- and second-generation migrants are grouped together and labelled as either non-Western migrants or Western migrants).
3.4 Method
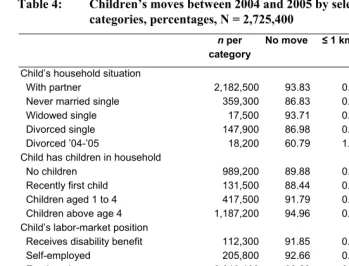
Table 4: Children’s moves between 2004 and 2005 by selected support need categories, percentages, N = 2,725,400
n per category
No move ≤ 1 km 1 - ≤ 10 km
> 10 km
Child’s household situation
With partner 2,182,500 93.83 0.16 2.63 3.39
Never married single 359,300 86.83 0.29 4.81 8.06
Widowed single 17,500 93.71 0.15 2.62 3.52
Divorced single 147,900 86.98 0.32 5.26 7.45
Divorced ’04-’05 18,200 60.79 1.53 18.60 19.08
Child has children in household
No children 989,200 89.88 0.24 3.78 6.10
Recently first child 131,500 88.44 0.35 4.43 6.78
Children aged 1 to 4 417,500 91.79 0.27 3.61 4.32
Children above age 4 1,187,200 94.96 0.11 2.35 2.58
Child’s labor-market position
Receives disability benefit 112,300 91.85 0.24 3.47 4.43
Self-employed 205,800 92.66 0.17 3.10 4.07
Employed 2,010,100 92.23 0.19 3.18 4.40
Receives other benefit 149,100 91.02 0.25 3.77 4.96
Economically inactive 148,100 93.72 0.18 2.54 3.56
Child is female 1,375,600 92.66 0.20 2.99 4.16
Parents have other child living close 756,000 93.41 0.24 3.18 3.16
Child is only child 315,400 89.57 0.29 4.23 5.91
Total 2,725,400 92.33 0.19 3.16 4.33
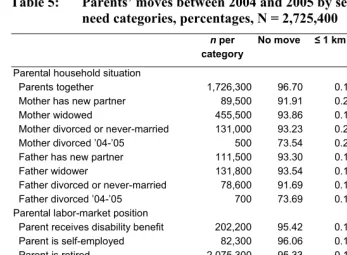
Table 5: Parents’ moves between 2004 and 2005 by selected support need categories, percentages, N = 2,725,400
n per category
No move ≤ 1 km 1 - ≤ 10 km
> 10 km
Parental household situation
Parents together 1,726,300 96.70 0.11 1.61 1.58
Mother has new partner 89,500 91.91 0.23 3.64 4.22
Mother widowed 455,500 93.86 0.16 2.97 3.01
Mother divorced or never-married 131,000 93.23 0.21 3.17 3.39
Mother divorced ’04-’05 500 73.54 0.20 10.91 15.35
Father has new partner 111,500 93.30 0.10 2.41 4.19
Father widower 131,800 93.54 0.13 2.90 3.43
Father divorced or never-married 78,600 91.69 0.16 3.31 4.84
Father divorced ’04-’05 700 73.69 0.15 9.59 16.57
Parental labor-market position
Parent receives disability benefit 202,200 95.42 0.17 2.25 2.16
Parent is self-employed 82,300 96.06 0.11 1.92 1.91
Parent is retired 2,075,300 95.33 0.12 2.18 2.36
Parent is employed 285,500 96.31 0.12 1.64 1.93
Parent receives other benefit 80,100 95.14 0.18 2.29 2.40
Child is female 95.45 0.15 2.12 2.28
Parents have other child living close 756,000 95.70 0.07 2.33 1.89
Child is only child 315,400 95.85 0.18 1.94 2.03
Total 2,725,400 95.46 0.13 2.13 2.29
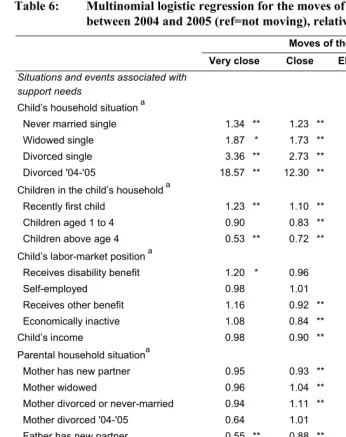
Table 6: Multinomial logistic regression for the moves of the adult child between 2004 and 2005 (ref=not moving), relative risk ratios
Moves of the child
Very close Close Elsewhere Very closeb
Situations and events associated with support needs
Child’s household situation a
Never married single 1.34 ** 1.23 ** 1.30 ** 1.03
Widowed single 1.87 * 1.73 ** 1.39 ** 1.35
Divorced single 3.36 ** 2.73 ** 2.68 ** 1.26 **
Divorced '04-'05 18.57 ** 12.30 ** 9.26 ** 2.01 **
Children in the child’s household a
Recently first child 1.23 ** 1.10 ** 1.14 ** 1.08
Children aged 1 to 4 0.90 0.83 ** 0.70 ** 1.28 **
Children above age 4 0.53 ** 0.72 ** 0.53 ** 1.00
Child’s labor-market position a
Receives disability benefit 1.20 * 0.96 1.03 1.17
Self-employed 0.98 1.01 1.08 ** 0.91
Receives other benefit 1.16 0.92 ** 1.04 * 1.11
Economically inactive 1.08 0.84 ** 1.69 ** 0.64 **
Child’s income 0.98 0.90 ** 1.59 ** 0.62 **
Parental household situationa
Mother has new partner 0.95 0.93 ** 1.29 ** 0.73 **
Mother widowed 0.96 1.04 ** 0.93 * 1.02
Mother divorced or never-married 0.94 1.11 ** 1.22 ** 0.77 **
Mother divorced '04-'05 0.64 1.01 1.15 0.55
Father has new partner 0.55 ** 0.88 ** 1.33 ** 0.42 **
Father widower 0.96 1.10 ** 0.95 1.01
Father divorced or never-married 0.68 ** 0.98 1.19 ** 0.57 **
Father divorced '04-'05 1.52 0.99 1.60 * 0.97
Parental labor-market position a
Receives disability benefit 1.08 1.00 1.05 * 1.03
Self-employed 0.92 0.91 ** 1.00 0.93
Retired 0.98 0.96 * 1.07 ** 0.92
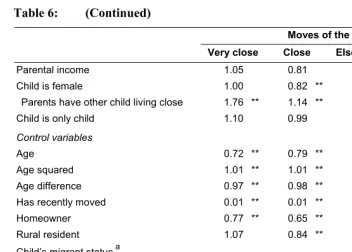
Table 6: (Continued)
Moves of the child
Very close Close Elsewhere Very closeb
Parental income 1.05 0.81 1.37 ** 0.77 **
Child is female 1.00 0.82 ** 1.06 ** 0.95
Parents have other child living close 1.76 ** 1.14 ** 0.83 ** 2.13 **
Child is only child 1.10 0.99 0.95 ** 1.16 *
Control variables
Age 0.72 ** 0.79 ** 0.84 ** 0.86 **
Age squared 1.01 ** 1.01 ** 1.01 ** 1.01 **
Age difference 0.97 ** 0.98 ** 1.00 0.97 **
Has recently moved 0.01 ** 0.01 ** 0.01 ** 1.26
Homeowner 0.77 ** 0.65 ** 0.59 ** 1.31 **
Rural resident 1.07 0.84 ** 0.75 ** 1.43 **
Child’s migrant status a
non-Western migrant 1.04 1.09 ** 0.83 ** 1.25 *
Western migrant 1.03 1.05 ** 1.10 ** 0.94
N 2,725,400 df 108
χ2 140,729
Note: The standard errors are corrected for the clustering of children with the same mother.
aReference categories: with partner; no child, employed; parents together; parents employed; native Dutch. bParameters for
moving close, with moving elsewhere as the reference category. *p < .01 **p < .001
Even though the data were not derived from a sample, but from a complete population, significance levels are reported because the data can be regarded as a one-moment sample from a theoretical population of many time points.
Table 7: Multinomial logistic regression for the moves of the parents between 2004 and 2005 (ref=not moving), relative risk ratios
Moves of the parents
Very close Close Elsewhere Very closeb
Situations and events associated with
support needs
Child’s household situation a
Never married single 0.81c * 0.90 ** 0.93 ** 0.87
Widowed single 1.31 1.23 0.82 ** 1.60
Divorced single 0.97c 1.04 1.02 0.95
Divorced '04-'05 1.11c 0.99 1.09 1.01
Children in the child’s household a
Recently first child 1.10 0.94 * 0.92 ** 1.20
Children aged 1 to 4 1.42c ** 1.03 0.87 ** 1.63 **
Children above age 4 1.26c ** 1.15 ** 0.90 1.39 **
Child’s labor-market position a
Receives disability benefit 1.14 1.01 1.09 ** 1.04
Self-employed 1.10 0.95 ** 0.96 1.14
Receives other benefit 1.03 0.97 1.09 ** 0.95
Economically inactive 0.91 0.76 ** 1.23 ** 0.74 **
Child’s income 0.84 ** 0.73 ** 0.95 ** 0.71 **
Parental household situation a
Mother has new partner 2.17c ** 2.11 ** 2.91 ** 0.74 *
Mother widowed 1.62c ** 1.81 ** 1.69 ** 0.96
Mother divorced or never-married 1.90c ** 1.93 ** 2.39 ** 0.79 *
Mother divorced '04-'05 3.16 12.24 ** 22.09 ** 0.14
Father has new partner 0.78 1.53 ** 2.50 ** 0.31 **
Father widower 1.10 1.50 ** 1.50 ** 0.73 *
Father divorced or never-married 1.37c * 2.02 ** 3.02 ** 0.45 **
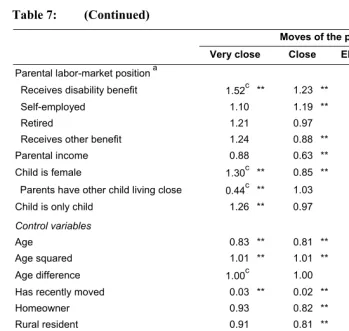
Table 7: (Continued)
Moves of the parents
Very close Close Elsewhere Very closeb
Parental labor-market position a
Receives disability benefit 1.52c ** 1.23 ** 1.33 ** 1.14
Self-employed 1.10 1.19 ** 1.17 ** 0.93
Retired 1.21 0.97 1.07 1.13
Receives other benefit 1.24 0.88 ** 0.16 1.18
Parental income 0.88 0.63 ** 1.13 ** 0.78 **
Child is female 1.30c ** 0.85 ** 1.06 ** 1.23 **
Parents have other child living close 0.44c ** 1.03 0.74 ** 0.60 **
Child is only child 1.26 ** 0.97 0.82 ** 1.54 **
Control variables
Age 0.83 ** 0.81 ** 0.78 ** 1.06
Age squared 1.01 ** 1.01 ** 1.01 ** 1.00
Age difference 1.00c 1.00 0.99 ** 1.01 *
Has recently moved 0.03 ** 0.02 ** 0.03 ** 1.06
Homeowner 0.93 0.82 ** 0.90 ** 1.03
Rural resident 0.91 0.81 ** 1.12 ** 0.81 **
Child’s migrant status a
non-Western migrant 1.30 * 1.06 0.93 1.40 *
Western migrant 1.00 0.82 ** 0.97 1.03
N 2,725,400 df 108
χ2 140,729
Note: The standard errors are corrected for the clustering of children with the same mother.
aReference categories: with partner; no child, employed; parents together; parents employed; native Dutch. bParameters for
moving close, with moving elsewhere as the reference category. cCoefficient differs significantly from coefficient in child’s regression (p < .001 Wald test).
4. Results
The multivariate results in Table 6 show that never-married and widowed singles are more likely than those with a partner to move very close to parents, but these moves are not significantly more likely than moves elsewhere (see first row of Table 6). At the same time, parents are less likely to move very close to a never-married adult child than to an adult child who lives with a partner (see first row, first column of Table 7). This result might be explained by the role of support needs: never-married children are likely to be less (financially) independent of their parents than are their partnered counterparts. The former probably move very close to their parents in order to receive support from them, but are less likely to provide them with it. As expected, divorced adult children are more likely to move very close to parents than are partnered children and the effect of moving very close is significantly greater than that of moving elsewhere, particularly when the divorce took place recently. (Note that to enhance the readability of this paper, the term ‘effect’ is used to indicate statistical effect estimates, not to indicate claims about causality.)
Adult children are less likely to move very close to a father with a new partner or a father who is divorced or never married than to parents who still live together. Significant positive effects on moves very close to an adult child were found for mothers with a new partner (which was surprising) and widowed mothers and divorced or never-married mothers and fathers (which was expected). Apparently, divorce and, to a lesser extent, widowhood, increase the need for contact and support and the wish to live close to an adult child. It should be noted, however, that the effects on moves very close are not greater than those on moves close or elsewhere. The associations of the mother’s and the father’s recent divorce with moves very close are positive, but not significant. This lack of significance can be explained by small group sizes resulting from randomly choosing one of both parents. In the additional models for mothers and fathers separately, the effects of a parent’s recent divorce on moving very close to an adult child were significant, but again, not stronger than those on moves close or moves elsewhere.
Parents who receive a disability benefit are more likely to move very close to an adult child than are parents who are employed, possibly because they are likely to need care and desire to live close to their children. The parents’ income is not associated with moves close to parents or adult children, but it is positively associated with the odds that either generation moves elsewhere. This finding confirms the idea that people with a higher income have a less strong need for the proximity of kin. In addition, people with higher incomes have more opportunities to move than those who are less well off. The greater likelihood of moves elsewhere might be explained by the fact that high-income children move further away for job-related reasons, whereas high-high-income parents move further away for reasons related to the quality of their housing or residential area.
The gender of the adult child does not seem to influence the extent to which adult children move close to their parents, but parents are significantly more likely to move close to a daughter than to a son, which was expected.
As expected, moves of the adult child in the direction of the parents are more likely when at least one other child already lives close to the parents, whereas the presence of at least one other child within one kilometer of the parents reduces the parents’ likelihood of moving away. Only children are not significantly more likely to move very close to their parents, but parents of an only child are more likely than other parents to move very close to their child and less likely to move elsewhere.
opposite is true for parents in rural areas. So, children in rural areas are less likely to move, but if they move the chances are greater that they move very close to their parents. This finding provides partial support for the expectation that living in rural areas is associated with stronger filial responsibility and with a greater likelihood of moves close to kin.
To address the question of which generation is most likely to move very close to the other and under what circumstances this move occurs, Table 8 gives an overview of the situations and events with significant positive effects on moving very close to the other generation, and for which these positive effects are significantly stronger than those on moving elsewhere. To distinguish who is most likely to move very close under a given situation, the adult child or the parents, the table only includes the characteristics for which the parameters differ significantly between the child’s and the parents’ model. The effect of divorce is most pronounced in the analyses. Divorced adult children are more likely to move very close to parents than are children who live with a partner, and the effect on moving very close is significantly stronger than that on moving elsewhere. Obviously, the event of divorce is often followed by a move, but moves very close to parents are extra likely after the adult child’s divorce. Note that this tendency is not true for parents who have recently experienced a divorce; they are more likely to move elsewhere than to move very close to their adult child (see Table 7).
Table 8: Who is most likely to move to within one kilometer?
Characteristic Who moves to within one kilometer?
Child’s household situation (ref. with partner)
Divorced single Child
Divorced '04-'05 Child
Child has children in the household (ref. none)
Children aged 1 to 4 Parents
Children above age 4 Parents
Child is female Parents
Parents have other child living close Child
that these children move back to where they spent their youths and where their siblings still live (or moved back to).
5. Discussion
This paper examines the extent to which support needs lead to adult children and parents moving close to each other, and addresses the question of who is most likely to do so. The results clearly suggest that the support needs of either generation are associated with moves closer to parents or adult children. For adult children, being divorced or having recently divorced is associated with moves close to the parents. Parents are more likely to move close to an adult child when the adult has children aged one year or older, when the adult child is female, and when the adult child is an only child. Also, parents with a disability benefit are more likely than employed parents to move close to an adult child.
The results suggest that when people move close to kin, the person in need is the most likely to move. Thus, the support needs of an adult child are associated with the child’s move close to the parent, but not with moves of the parents close to them. The moves of parents close to their adult children with children form an exception. It is possible that these parents move close to their children to help out with childcare, which is consistent with findings from several European countries (Hank and Buber 2009), but the literature also suggests that older parents wish to spend time with their grandchildren (Lin and Rogerson 1995), which makes the issue of whose needs are better met by such moves less clear.
There is also an indication that parents move closer to an adult child because they have better opportunities to do so. Where adult children often have strong ties to their local environment for reasons of work, childcare, and schools for the children, their parents do not. Future research should further explore the role of needs and opportunities in moving close to parents and children.
The findings presented in this study suggest moves close to parents and children in the Netherlands can be a response to increased support needs. This conclusion is in line with findings for Sweden (Pettersson and Malmberg 2009). Future studies could address the issue to what extent the association between support needs and moves close to kin also exists in other countries.
generation’s support needs and initiate a move towards them. When a longer period of observation would have been used, more moves in reaction to changes in support needs might have been captured. At the same time, however, the measurement of the event variables would have been less precise: it would be less clear whether the observed moves would actually be related to the event. The data did not include the adult children’s or parents’ level of education, although previous research indicated that this is strongly related to migration behavior (e.g., Sjaastad 1962). The actual motives for moving close to parents and children were also not known. The opportunity of taking into account the motives for moving close to kin would contribute radically to the knowledge on intergenerational proximity and mobility. Despite these limitations, the analyses presented in this paper do reveal that support needs have a substantial impact on moving close to parents and children.
6. Acknowledgements
References
Aboderin, I. (2004). Modernisation and ageing theory revisited: Current explanations of recent developing world and historical Western shifts in material family support for older people. Ageing & Society 24(1): 29-50. doi:10.1017/S0144686X03001521.
Amato, P.R. (2000). The consequences of divorce for adults and children. Journal of Marriage and Family 62(4): 1269-1287. doi:10.1111/j.1741-3737.2000.01269.x. Bakker, B.F. (2002). Statistics Netherlands’ approach to Social Statistics: The Social
Statistical Dataset. OECD Statistics Newsletter 11: 4-6.
Bordone, V. (2009). Contact and proximity of older people to their adult children: A comparison between Italy and Sweden. Population, Space and Place 15(4): 359-380. doi:10.1002/psp.559.
Boyle, P., Halfacree, K., and Robinson, V. (1998). Exploring Contemporary Migration. Harlow: Longman.
Burgess, E.W. (1960). Aging in western culture. In: Burgess, E.W. (ed.). Ageing in Western Societies. Chicago: University Press: 3-28.
Clark, R. and Wolf, D. (1992). Proximity of children and elderly migration. In: Rogers, A. (ed.). Elderly migration and population redistribution: A comparative study. London: Belhaven: 77-96.
Clark, W.A.V. and Dieleman, F.M. (1996). Households and housing. New Brunswick, NJ: CUPR Press.
Clogg, C.C., Petkova, E., and Haritou, A. (1995). Statistical methods for comparing regression coefficients between models. American Journal of Sociology 100(5): 1261-1293. doi:10.1086/230638.
Courgeau, D. (1985). Interaction between spatial mobility, family and career life-cycle: A French survey. European Sociological Review 1(2): 139-162.
Cowgill, D.O. (1974). The aging of populations and societies. The Annals of the American Academy of Political and Social Science 415(1): 1-18. doi:10.1177/000271627441500102.
Deurloo, M.C., Clark, W.A.V., and Dieleman, F.M. (1994). The move to housing ownership in temporal and regional contexts. Environment and Planning A 26(11): 1659-1670. doi:10.1068/a261659.
Feijten, P. and Mulder, C.H. (2002). The timing of household events and housing events in the Nertherlands: A longitudinal perspective. Housing studies 17(5): 773-792. doi:10.1080/0267303022000009808.
Gram-Hanssen, K. and Bech-Danielsen, C. (2008). Home dissolution: What happens after separating? Housing Studies 23(3): 507-522. doi:10.1080/02673030802020635.
Grundy, E. and Shelton, N. (2001). Contact between adult children and their parents in Great-Britain 1986-1999. Environment and Planning A 33(4): 685-697. doi:10.1068/a33165.
Hank, K. (2007). Proximity and contacts between older parents and their children: A European comparison. Journal of Marriage and Family 69(1): 157-173. doi:10.1111/j.1741-3737.2006.00351.x.
Hank, K. and Buber, I. (2009). Grandparents caring for their grandchildren: Findings from the 2004 survey of health, ageing, and retirement in Europe. Journal of Family Issues 30(1): 53-73. doi:10.1177/0192513X08322627.
Helderman, A.C., Van Ham, M., and Mulder, C.H. (2006). Migration and home ownership. Tijdschrift voor Economische en Sociale Geografie 97(2): 111-125. doi:10.1111/j.1467-9663.2006.00506.x.
Joseph, A.E. and Chalmers, A.I. (1996). Restructuring long-term care and the geography of ageing: A view from rural New Zealand. Social Science and
Medicine 42(6): 887-896. doi:10.1016/0277-9536(95)00187-5.
Joseph, A.E. and Hallman, B.C. (1998). Over the hill and far away: Distance as a barrier to the provision of assistance to elderly relatives. Social Science and Medicine 46(6): 631-639. doi:10.1016/S0277-9536(97)00181-0.
Lee, G.R., Coward, R.T., and Netzer, J.K. (1994). Residential differences in filial responsibility expectations among older persons. Rural Sociology 59(1): 100-109. doi:10.1111/j.1549-0831.1994.tb00524.x.
Liefbroer, A.C. and Mulder, C.H. (2006). Family obligations. In: Dykstra, P.A., Kalmijn, M., Knijn, T., Komter, A., Liefbroer, A., and Mulder, C.H. (eds.). Family Solidarity in the Netherlands. Amsterdam: Dutch University Press: 123-146.
Lin, G. and Rogerson, P. (1995). Elderly parents and the geographic availability of their adult children. Research on Aging 17(3): 303-331. doi:10.1177/0164027595173004.
Litwak, E. (1985). Helping the Elderly: Complementary Roles of Informal Networks and Formal Systems. New York: Guildford.
Litwak, E. and Longino, C.F. Jr. (1987). Migration Patterns Among the Elderly: A Developmental Perspective. The Gerontologist 27: 266-72. http://dx.doi.org/10.1093/geront/27.3.266
Long, L.H. (1972). The influence of number and ages of children on residential mobility. Demography 9(3): 371-382. doi:10.2307/2060860.
Longino, C.F.Jr., Jackson, D.J., Zimmerman, R.S., and Bradsher, J.E. (1991). The second move: Health and geographic mobility. Journal of Gerontology: Social Sciences 46(4): 218-244. doi:10.1093/geronj/46.4.S218.
Malmberg, G. and Pettersson, A. (2007). Distance to elderly parents: Analyses of Swedish register data. Demographic Research 17(23): 679-704. doi:10.4054/DemRes.2007.17.23.
Michielin, F. and Mulder, C.H. (2007). Geographical distances between adult children and their parents in the Netherlands. Demographic Research 17(22): 655-678. doi:10.4054/DemRes.2007.17.22.
Michielin, F., Mulder, C.H., and Zorlu, A. (2008). Distance to parents and geographical mobility. Population, Space and Place 14(4): 327-345. doi:10.1002/psp.509. Mulder, C.H. (1993). Migration Dynamics: A Life course Approach. Amsterdam:
Thesis Publishers.
Mulder, C.H. and Van der Meer, M.J. (2009). Geographical distances and support from family members. Population, Space and Place 15(4): 381-399. doi:10.1002/psp.557.
Mulder, C.H. and Wagner, M. (1993). Migration and marriage in the life course: A method for studying synchronized events. European Journal of Population 9(1): 55-76. doi:10.1007/BF01267901.
Mulder, C.H. and Wagner, M. (1998). First-time home-ownership in the family life course: A West German-Dutch comparison. Urban Studies 35(4): 687-713. doi:10.1080/0042098984709.
Pettersson, A. and Malmberg, G. (2009). Adult children and elderly parents as mobility attractions in Sweden. Population, Space and Place 15(4): 343-357. doi:10.1002/psp.558.
Rogerson, P.A., Burr, J.A., and Lin, G. (1997). Changes in geographic proximity between parents and their adult children. International Journal of Population Geography 3(2): 121-136. doi:10.1002/(SICI)1099-1220(199706)3:2<121::AID-IJPG60>3.0.
CO;2-I.
Rossi, A. and Rossi, P. (1990). Of human bonding: Parent-child relations across the life course. New York: Aldine de Gruyter.
Serow, W.J. and Sly, D.F. (1991). Geographic mobility of the elderly in industrialized societies. In: Lutz, W. (ed.). Future Demographic Trends in Europe and North America: What Can We Assume Today? London: Academic Press: 399-419. Shelton, N. and Grundy, E. (2000). Proximity of adult children to their parents in Great
Britain. International Journal of Population Geography 6(3): 181-195. doi:10.1002/1099-1220(200005/06)6:3<181::AID-IJPG181>3.0.CO;2-U.
Silverstein, M. (1995). Stability and change in temporal distance between the elderly and their children. Demography 32(1): 29-45. doi:10.2307/2061895.
Sjaastad, L.A. (1962). The costs and returns of human migration. Journal of Political Economy 70(S5): 80-93. doi:10.1086/258726.
Smits, A., van Gaalen, R.I., and Mulder, C.H. (forthcoming). Parent – child coresidence: Who moves in with whom and for whose needs? Journal of Marriage and Family.
Van Diepen, A.M.L. and Mulder, C.H. (2009). Distance to family members and relocations of older adults. Journal of Housing and the Built Environment 24(1): 31-46. doi:10.1007/s10901-008-9130-0.