DESERT 17 (2013) 215-224
Assessment of Spatial Structure of Groundwater Quality Variables
Based on the Geostatistical Simulation
Gh.R. Zehtabian
a*, H. Mohammad Asgari
b, M. Tahmoures
ca
Professor, Faculty of Natural Resources, University of Tehran, Karaj, Iran
b
Assistant Professor, Khoramshahr University of Marine Science and Technology, Khoramshahr, Iran
c
Ph.D. Student, Faculty of Natural Resources, University of Tehran, Karaj, Iran
Received: 14 July 2007; Received in revised form: 13 December 2008; Accepted: 30 December 2008
Abstract
Our main objective in the present study was to assess the spatial variation of chemical and physical water properties. Prior to the design of groundwater quality monitoring networks, it is essential to investigate the spatial structure of the groundwater quality variables. A case study is presented which used ground water quality observations from groundwater domestic wells in the Dameghan, Iran. The anslyses of the spatial structure used the following variables: Electrical Conductivity (EC), PH, SAR, TDS, Sodium (Na), Calcium (Ca), Magnesium (Mg). For all these variables the spatial structure is described by means of geostatistical simulation, used to yield a series of stochastic images characterized by equally probable spatial distributions of the chemical and physical water properties across the area. The data set including 5 years of annual observations. At first normality and homogeneity of data are examined. Then variographic analysis using two techniques including kriging, Weighted Moving Average (WMA) were applied for presenting spatial variation of water properties. Finally comparison of the results using statistical techniques showed that for more groundwater quality variables (e.g. TDS, EC, Cation, Na, Ca) kriging technique performed better than WMA-2 technique in characterizing the spatial variability. WMA-2 technique only for some groundwater quality variables like SAR and Mg has better result than kriging to simulate groundwater quality variables.
Keywords: Water properties; Interpolation; Geostatistics; Spatial variation; Dameghan; Iran
1. Introduction
Pollution from agriculture and industrial origin threatens the groundwater quality in Iran. Since groundwater is the main source of fresh water, pollution causes a decrease in the long-term resources of water suitable for human consumption. Furthermore, since most groundwater finally flows to the surface, a deterioration of groundwater quality affects the ecohydrological conditions of the receiving seepage areas as well as the receiving seas.
Prior to the design of groundwater quality
Corresponding author. Tel.: +98 26 32223044-6, Fax: +98 26 32223044-6.
E-mail address: ghzehtab@ut.ac.ir
measures and management and planning decisions can be made to minimize the deterioration in the polluted areas.
Geostatistical methods were developed to create mathematical models of spatial correlation structures with a variogram as the quantitative measure of spatial correlation. The variogram is commonly used in geostatistics and the interpolation technique, known as kriging, provides the ‘‘best’’, unbiased, linear estimate of a regionalized variable in an unsampled location, where ‘‘best’’ is defined in a least-squares sense. The emphasis is set on local accuracy, i.e. closeness of the estimate to the actual, but unknown, value without any regard for the global statistical properties of the estimates. The kriging estimation variances are independent of the value being estimated and are related only to the spatial arrangement of the sample data and to the model variogram.
One development of geostatistics, that has become more popular in the last decade, is the stochastic simulation which represents analternative modelling technique, particularly suited to applications where global statistics are more important than local accuracy. Application of geostatistics techniques in hydrological sciences is a useful approach to avoid some errors and increase of calculation accuracy as well. In classic statistics samples taken from a population are lack of spatial properties. Therefore the calculated values of a parameter in a homogene sample do not include any information of the same parameter in another sample with a defined distance. Geostatistics consider the value as well as location of the sample. Then it is possible to analyze value and location of the samples together. To achieve this purpose it is necessary to relate spatial properties (distance, direction) of different samples using mathematical formula called spatial structure.
Obviously geostatistical methods use various variables and then produce different results. In many causes a method which is selected to reach the prediction process but it is vital to find out the most appropriate interpolation technique for precipitation prediction. Amini (2002) applied kriging and co-kriging techniques for predicting Cl- concentration of soil in Roudash, Isfahan which showed that kinging method provides more accurate and low cost results.
Azimzadeh et al. (2005) used kriging technique to estimate the area of desert pavement and threshold velocity of wind erosion in Mehriz,
Yazd. The results indicated that common kinging is a precise and relevant method to produce the map of the effective factors of wind erosion including Reg area and iso-velocity threohod lines. Campling et al (2007) were used kriging method to estimate spatial distribution of rainfall as well as to optimize the number and location of rain gages in Spain. Kriging techniques are employed to assess the spatial dependencies of the water quality variables such as TDS (e.g.Jager et al, 1990), groundwater level (e.g.Hudak and Loaiciga, 1993; Geo et al, 1996; Ahmed, 2002) and groundwater quality variables such as NO3 and Cl (e.g. Rohani and Hall, 1988; Loaiciga, 1989).Ahmed (2002) applied kriging to assess the spatial dependencies of the water quality variables such as TDS and concluded that kriging has high capability for this purpose. Torabi (1999) investigating the groundwater table in Qom plain. Jager et al. (1990) also used geostatistical tools like kriging to simulate groundwater quality variables and they result kriging is better than other geostatistical tools for simulating groundwater quality variables. Cressie, N (1985) introduced kriging method as most acceptable and strongest tool to interpolate data for preparation of contour maps of groundwater. Mohammadi et al (1999) used geostatistical tools to prepare hazard zonation maps of ecological pollution. Misaghi et al (2002) estimated groundwater table by using geostatistics methods. Nazarizadeh et al (2005) used geostatistical tools to investigate the spatial structure of groundwater quality variables and stated that the variograms of EC,Cl, So4-2 have spherical structure.
For correct watershed management planning the maps of important characteristics of water resources such as: EC, Ca, Mg, Cat ion, … should be used. The use of current and traditional methods for investigation of changes of spatial structure of groundwater quality variables are expensive and time-consuming methods. On the other hand classic statistics can not consider spatial changes of variables. Physical and chemical characteristics of water resources change in time and place, even spatial structure of water variables change in various geographic directions. Therefore in this research geostatistical methods are used that consider spatial structure and changes of groundwater quality variables.
2. Materials and Methods
2.1. Study area
The study region located in north eastern of Iran in Semnan province with 35 36 14” to 36
5 9” latitudes and 54 5 44” to 54 58 16” longitude which covers 15600 ha. Temperature varation in the region is high. The minimum
temperature in the area is -12C in winter while it reaches to higher than 44 C in summers. The annual pan evaporation varies between 1250-4200 mm. The climate of study area is mostly semi-arid and the annual precipitation is 148.4 mm. In this study we used groundwater quality observations since (1999-2006) from 58 domestic wells in Dameghan plain (Figure 1).
(Legend)
Domestic wells
Fig.1. Distribution of domestic wells in the study area
2.2. The method of data collecting
This research has been done by using the data of 58 observed wells that have been gathered by Ministry of Power and Electricity. The depth of the wells is 35-55 meters. Because of high cost of data collecting from the other wells (no observed wells) and difficulty of the data gathering, the prepared data by mentioned Ministry have been used in the current study.
2.3. Methods
Geostatistical prediction includes two stages which is first identification and modeling of spatial structure. At this stage continuity, homogeneity and spatial structure of a given variable is studied using variogram. Second stage is geostatistical estimation using kriging technique
which depends on the properties of the fitted variogram which affects all stages of the process.
2.4. Variogram analysis
Variogram method is a suitable technique for estimating spatial variability of a variable. Calculation of variogram graph is one of essential
stages in geostatistics which is defined as follow:
2 1h 2n
1
nh
i Z xi Z xi h
h
(1)
Where:
(h): value of variogram for pair points with distance h
n(h): Number of pair points with distance h Z(xi): observed value of variable x
For variogram plotting it is necessary to compute y (h) for different values of h and then to plot the values for different distances of h. In another word variogram is the variance of different points with distance h. The obtained variograph of measured samples is called experimental variogram which is a vector value that is a dependent of distance and direction. The properties variogram include threshold (sill=C0). The threshold is the maximum value of variogram which is spatial variance of the variable. The lowest value of variogram includes partial effect which shows variance of errors of measurements. The effective distance demonstrates the distance. That variogram has the highest value. Instead of variance, covariance shows the similarity of variables. Since arithmetic summation of similarity and dissimilarity is constant then it is possible to replace it with the average difference of points of distance h. The relation between variogram and co-variogram is defined as:
y(h)+c(h)=
2 (2) Where:2
=threshold y (h): variogram value c (h): co-variance value3.4. Theory of common kriging
Kriging is a prediction method that considers values of a variable in unsampled points as a linear composition of the values of surrounding points. Considering the values of variable Z in n measured points as follow:
Z= (z(x,), Z (x2),….Z (xn)) (3) Estimation of Z in point X0 using kriging estimation is defined as:
Z*(x0) =
) ( 1 i i n i x z
(4)The most important part of kriging is statistical weighs assigned to
i.To avoid bios of estimation, the weighted should be determined in a way that summation is equal to one ( 1)
1
i n i and the variance of
estimates should be minimized-as: (5) Min ] = ٢ )) ٠ x ( z -) ٠ x ( * z [( E )] = ٠ x ( * z [ var 3.5. Weighted Moving Average (WMA)
In WMA technique, the value of weighting factor (λi) is estimated based on the following equation. Where:
ni Di
Di i
1
(6)
D: the distance between observed and estimated points
α :equation order
n: Number of observed points:
Three mentioned methods were validated using follow criteria: 2 1 *( ) ( )) ( 1 xi Qz xi z n RMSE n i
(7)
n i xi z xi z n MAE 1 ) ( ) (1 * (8)
It should be mentioned that the results of three described methods were obtained using GS+ software.
4. Results
Since the first step for geostatistical application for a set of data is variogram analysis then the results of variogram analysis in the study area were calculated (Table 1). Then kriging, and WMA methods were applied for the data (Table 2).
It is necessary to keep in mind that normality test was examined for the data and logarithm of the data were used to avoid skewness.
Table 1. The properties of suitable variogram model of variables
Variable Mean Sd Skewness Kurtosis Model Nugget Sill Ro(effective range)
Co/Co+C SAR (me/l) 5.29 2.6 0.86 1.71 Spherical 0.087 1.458 112100 0.94
EC (ds/m) 2630 1635 3.47 9.02 Linear 0.001 1.611 10200 0.999
pH 8.2 0.24 0.96 1.87 Spherical 0.014 0.0857 40400 0.83
TDS (mg/l) 1734 1100.6 2.51 9.16 Linear 0.001 2.011 101900 0.999 Cat ion (me/l) 26.6 17.001 2.58 9.72 Linear 0.001 1.61 10200 0.999 Na (me/l) 49.6 17.47 1.37 2.68 Spherical 1 2.77 53900 0.999
Mg (me/l) 6 4.62 1.35 1.01 Linear 0.001 2.01 55200 1
Table 2. The results of estimation of different geostatistical techniques
The spatial variations of the mean of the variables are presented in Fig.2 where the contour lines were drawn using the kriging technique. In Fig.3 Average concentration distribution maps of: Ca, EC, Cat ion, Mg, Na and pH in Dameghan plain have been shown.
5. Variograms
In the references, spatial interrelationship of data is assessed by (C/C+C0), and if this parameter is close to 1, spatial interrelationship is suitable and if the mentioned parameter is close to 0 spatial interrelationship is weak and the value of nugget effect is high. All of physical and chemical soil factors that have been investigated in this research (according to table 1), have high value of mentioned parameter (C/C+C0), and this issue justifies the use of geostatistical techniques. According to table 1 spatial interrelationship of Mg and Ca data are higher than the other variables.
As seen in the variogram results (Table 1) the most appropriate models fitted to groundwater quality variables are spherical and linear models. However the results of current study show high spatial structure of the variable data but the most appropriate results based on the statistical comparisons showed high capability of kriging technique.
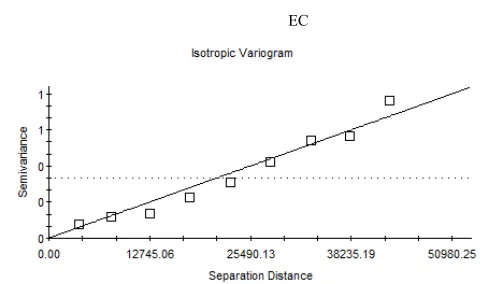
Figure 2 shows the variograms of physical and chemical soil factors that have been investigated in this research.
Assessment of effective range of various parameters show that some variables like EC and TDS have short effective range and for their assessment, we should prepare grading with short distance, If we want to calculate sampling distances (grading) for these two variables (EC and TDS) is 2/3 effective range (about 7 km), for Mg,Ca and pH, sampling distance is about 37 km and for SAR , Na and cation, it is about 74 km. (7) All of physical and chemical soil factors that have been investigated in this research have high value of (C/C+C0) parameter, and this issue justifies the use of geostatistical techniques. In Fig. 3 average concentration distribution maps of: EC (a), Ca (b), Cat ion (c), Mg (d), Na (e) and pH (f) in Dameghan plain, over 1999-2006 have been shown.
This study has attempted to predict the spatial distribution and uncertainty of groundwater quality variables in the north Eastern of Iran Semnan Province using the geostatistical techniques (kriging and WMA-2). Pollution from agriculture and industrial origin threatens the groundwater quality in Iran. Since groundwater is the main source of fresh water, pollution causes a decrease in the long-term resources of water suitable for human consumption. Furthermore, because most groundwater finally flows to the surface, a deterioration of groundwater quality affects the ecohydrological conditions of the receiving seepage areas as well as the receiving seas.
Variable Method of estimation r RMSE MAE
SAR (me/l) Kriging 0.13 2.95 2.01
SAR (me/l) WMA-2 0.017 2.86 1.99
EC (ds/m) Kriging 0.53 1402.6 866.8
EC (ds/m) WMA-2 0.50 1484 877.2
pH Kriging 0.73 0.17 0.12
pH WMA-2 0.70 0.173 0.121
TDS (mg/l) Kriging 0.52 942.9 580
TDS (mg/l) WMA-2 0.42 1020 585
Cation (me/l) Kriging 0.015 6.8 5.9
Cation (me/l) WMA-2 0.04 6.54 5.7
Na (me/l) Kriging 0.04 6.98 4.9
Na (me/l) WMA-2 0.14 7.57 5.1
Mg (me/l) Kriging 0.49 9.1 4.67
Mg (me/l) WMA-2 0.73 3.1 2.25
Ca (me/l) Kriging 0.52 7.1 2.5
Ca EC
Cat ion Mg
Na pH
(a) EC
(b) Ca
(c) Cat ion
(d) Mg
(e) Na
Fig. 3. Average concentration distribution maps of: EC (a), Ca (b), Cat ion (c), Mg (d), Na (e) and pH (f) in Dameghan plain, over 1999-2006
7. Discussion and Conclusion
The use of current and traditional methods for investigation of changes of spatial structure of groundwater quality variables are expensive and time-consuming methods. On the other hand classic statistics can not consider spatial changes of variables. Physical and chemical characteristics of water resources change in time and place, even spatial structure of water variables change in various geographic directions. Therefore in this research geostatistical methods are used that consider spatial structure and changes of groundwater quality variables.
The analysis showed that for more groundwater quality variables (e.g. TDS, EC, Cat ion, Na, Ca) kriging technique performed better than WMA-2 technique in characterizing the spatial variability. WMA-2 technique only for some groundwater quality variables like SAR and Mg has better result than kiriging to simulate groundwater quality variables.
As seen in the variogram results (Table 1) the most appropriate models fitted to groundwater quality variables are spherical and linear models. However the results of current study show high spatial structure of the variable data but the most appropriate results based on the statistical comparisons showed high capability of kriging technique.
Assessment of effective range of various parameters show that some variables like EC and TDS have short effective range and for their assessment, we should prepare grading with short distance, If we want to calculate sampling distances (grading) for these two variables (EC and TDS) is 2/3 effective range (about 7 km), for Mg,Ca and PH, sampling distance is about 37 km and for SAR, Na and cation, it is about 74 km. All of physical and chemical soil factors that have been investigated in this research have high value of (C/C+C0) parameter, and this issue justifies the use of geostatistical techniques.
This study shows the high capability of geostatistical tools for provision of maps of spatial structure of groundwater quality variables. The results also confirm the research conducted by Ahmed (2002) and Jager et al.
(1990) that they also concluded geostatistical tools like kriging have high capability for simulating groundwater quality variables.
References
Ahmed, S., 2002. Groundwater monitoring network design: application of Geostatistics with a few case studies from a granitic aquifer in a semi-arid region. In: Groundwater Hydrology, M.M. Sherif, V.P. Singh and M. Al-Rashed (Eds.), Balkema, Tokyo, Japan. 2, 37-57.
Amini, M., Khadi, H., Fathianpour, N., 2002. Comparison of kriging and co-kriging methods for estimating Cl- concentration of soil, Iranian Journal of Agricultural Science (In Persian), Vol. 33: 4:741-748.
Azimzadeh, H.R., Ekhtesasi, M.R., Mohammadi, J., Refahi, H. 2005. Application of geostatistics using kriging method for estimating desert pavement and wind erosion threshold (In Persian), First National Conference of Wind Erosion, pp52-61.
Cinnirella, S., Buttafuoco, G., Pirrone N., 2003. Uncertainty and spatial analysis of groundwater nitrate concentrations in the Po river: a stochastic approach. In: European Conference on Coastal Zone Research: an ELOISE Approach, March 24-27, Gdank, 153pp. Cressie, N., 1990. Statistics for Spatial Data. Revised Edition. Wiley, New York, USA. 900pp.
Geo, H., Wang, J. and Zhao, P., 1996. The update Kriging variance and optimal sampling design. Math. Geol., 28, 295-313.
Hasanipak, A., 1988, Geostatistics (In Persian), University of Tehran Press, 314pp.
Issak, E.H. & R.M. Srivastava, 1989. An introduction to applied geostatistics. Oxford University Press, 561pp. Jager, N., 1990. Hydrogeology and Groundwater simulation. Lewis Publishers. 512pp.
Jager, N., 1989. An introduction to applied geostatistics. Oxford University Press, 561pp.
Mahdavi, M., Hosseini, E., Mahdian, M.H., Rahimi, S., 2004. Determining the most suitable geostatistical techniques for estimating spatial distribution of precipitation in arid and semi-arid regions (In Persian), Iranian Journal of Natural Resources, Vol. 56: 4:341- 348.
Mohammadi, G,, Van Meroone, 1999. Using geostatistical tools to prepare hazard zonation maps of ecological pollution.Tarbite Modares University. 278pp.
Misaghi, F, Mohammadi, F, 2002. estimating groundwater table by using geostatistics methods. 654pp.
Nazarizadeh, F, Ershadian, B, Zandvakili, K., 2005. Application of geostatistical tools to investigate the spatial structure of groundwater quality variables. 375pp.