An Evaluation of the Effectiveness of the
‘Speech Bubbles’ Drama Intervention
Programme, 2015-17
Dr Heather Price, Psychosocial Studies, and
Eric Ansong, Social Research Methods
Acknowledgements
We would like to express grateful thanks to the London Bubble Theatre Company for commissioning this research. We acknowledge the support of Dr Sheila Preston in securing the original UEL civic engagement grant with the London Bubble Theatre Company.
Table of Contents
Overview 1
Background 3
The UEL Study – Methodology 6
Ethical conduct 6
Screening tools and procedures 6
Research design 7
Fig. 1 – research design 8
Research sample 8
Fig. 2 – ethnicity 9
The Communication Trust’s Speech, Language and Communication and
Progression Tools 10
Fig. 3 SLCPT Profile Chart, modified 10
Fig. 4 SLCPT ages 5-6 yrs, 3rd question in each of the six aspects of SLC 11 Fig. 5 SLCPT ages 7-8 yrs, 3rd question in each of the six aspects of SLC 12
Logging children’s answers and scoring 13
Statistical analysis 13
The UEL Study – Results 14
Results from Wave 1 to Wave 2: 2015-16 14
Fig.5 Improvement of ‘‘Speech Bubbles’’ children in comparison to
‘control’ children, 2015-16 14
Fig.6 Average point rise in scores: ‘‘Speech Bubbles’’ children in
comparison to ‘control’ children, 2015-16 15
Results from Wave 1 to Wave 2: Statistical Analysis 16
Spoken Language, 2015-16 16
Vocabulary, 2015-16 16
Sentences, 2015-16 16
Storytelling, 2015-16 17
Speech, 2015-16 17
Social interaction, 2015-16 17
Results from Wave 2 to Wave 3: 2016-17 18
Fig. 7 ‘‘Speech Bubbles’’ children: Performance in July 2017
Fig. 8 ‘Control’ children: Performance in July 2017
in comparison to July 2016 (after receiving the intervention) 19
Fig. 9 ‘Speech Bubbles’ children, July 2016 and July 2017
[image:4.595.93.492.46.778.2]compared with ‘Control’ children, July 2016 and 2017 20 Results from Wave 1 to Wave 2 to Wave 3: Statistical Analysis
21
Table 1. Description of sample
22
Table 2. Description of outcome variables by measurement occasion 22
Multivariate results 23
Spoken Language 23
Fig. 10 Equivalence of mean spoken language scores, July 2017 24
Storytelling 24
Fig. 11 Equivalence of mean storytelling and narrative scores, July 2017 25
Social Interaction 26
Vocabulary 27
Speech 28
Sentences 28
Discussion of the results – the ‘Speech Bubbles’ Effect 30
The original treatment cohort 30
The original control cohort 30
Age, gender and home language 31
Mechanisms of change 31
Greater progression in the first year of the study 32
Overall improvement of both cohorts 33
Strengths and Limitations of the Study 34
The Communication Trust’s Progression Tools 34
Rigour of sample selection 35
Ethical conduct, procedure and analysis of the results 35
Conclusion and recommendations 36
The aims of the UEL evaluation 36
Recommendations 37
A final note 37
References 38
Appendix 1 41
Overview
In June 2015, the London Bubble Theatre Company accepted a research proposal submitted by the University of East London for the evaluation of the Theatre’s ‘Speech Bubbles’ drama-oriented school-based intervention.
The project received ethical approval from the University’s Research Ethics Committee and the evaluation took place over 2015-17 in three selected schools in the London Borough of Southwark. Children with speech, language and
communication needs (SLCN) in Key Stages 1 and 2, aged between 5 and 8 years, received the ‘Speech Bubbles’ intervention either in 2015-16, or in 2016-17. Researchers measured each group’s SLC development from a baseline and at key points subsequently, comparing the two groups and conducting statistical analyses of the results.
The research questions the evaluation sought to answer were:
• Does taking part in ‘Speech Bubbles’ make a positive difference to children’s speech, language and communication development?
• If so, is this difference statistically significant? That is, can it be reliably attributed to the effect of the ‘Speech Bubbles’ intervention alone?
‘Speech Bubbles’ is an intervention aimed at improving speech, language and communication in selected children in the early years of primary school. It is led by drama practitioners with the support of learning support assistants (LSAs) from participating schools. ‘Speech Bubbles’ is delivered across the school year for a total of 24 weeks to groups of 10 children referred by their class teachers. The sessions have a tight, predictable structure. Each week there is a warm-up involving games that state the group’s values of inclusion and pro-social behaviour. The whole group then acts out one of the children’s stories. Staff obtain these individual stories by speaking with each child in turn at the end of the session. Their story is then the one used the following week. There is a warm-down period before the children re-join their classes.
‘Speech Bubbles’ was devised by the London Bubble Theatre Company and delivered initially in Southwark in 2008, reaching 12 schools by 2012. In 2012-14, children received the programme in a further 14 mainstream schools in
disadvantaged areas in London and the North East in an extended programme funded by the Shine Trust. During this period, ‘Speech Bubbles’ was evaluated by Dr Jonathan Barnes at the Sidney De Haan Research Centre for Arts and Health,
Canterbury Christ Church University (Barnes, 2012; Barnes, 2015).
In September 2014 the London Bubble Theatre Company submitted evidence about ‘Speech Bubbles’’ effectiveness to Project Oracle’s Children and Youth Evidence Hub. Project Oracle is managed by the Social Innovation Partnership and London Metropolitan University, and funded by the Greater London Authority, the Mayor’s Office for Police and Crime and the Economic and Social Research Council. It aims to build the capacity of projects to obtain an evidence-base for the outcomes they wish to achieve. ‘Speech Bubbles’ was validated at ‘Standard of Evidence 2’. This meant that it was independently found to have a clear project model and evaluation plan, and a clear set of aims about what it wanted to achieve (Standard 1). It was also found to have evidence of change in its recipients over time, which provides some measure of impact (Standard 2).
In commissioning the 2015-17 research evaluation from the University of East London, the London Bubble Theatre Company has succeeded in obtaining evidence of the impact of the ‘Speech Bubbles’ intervention that is more robust. It has established that the positive change found in those receiving its intervention is consistently attributable to the intervention itself and not to other factors. As this report goes on to discuss in depth, the independent screening and analysis
programme undertaken by researchers at the University of East London for the London Bubble Theatre Company shows that there are clear benefits to children's speech, language and communication development as a result of them having participated in a ‘Speech Bubbles’ drama programme. In three areas of SLC development in particular (spoken language, storytelling and narrating and social interaction), the children’s improvement reaches statistically significant levels. It is therefore a highly valuable intervention.
Background
Speech, language and communication abilities are now being emphasised as foundational to many areas of children’s learning and development. The Bercow Review of provision for children and young people with speech, language and communication needs highlighted how ongoing struggles in these areas can have a significant, long lasting impact on confidence, social and emotional development, school progression and mental well-being (Bercow, 2008). Children with language difficulties have poorer educational outcomes (Durkin et al, 2009), but speech, language and communication needs are not just about speech and language delay, or poor performance against speaking, listening, attentional and reading and writing targets. They affect peer relationships and pro-social skills (Bakopoulou and Dockrell, 2016), and put children at increased risk of a range of psychosocial problems
(Snowling et al, 2006).
Earlier in the decade, publications from the Better Communication Research Programme (BCRP) initiated followed the Bercow Review indicated that young children from neighbourhoods with high social deprivation were more likely to be identified as having SLCN, with rates reaching as high as 50% of pre-schoolers in the most disadvantaged areas (Roulstone et al, 2011; Dockrell et al, 2012). SLCNs continue to be more common in children who live in areas of social disadvantage (Korpilahti et al., 2016) and provision for these socially deprived groups is uneven at best (Pring, 2016). These researchers highlight poverty of the communication
environment as the problem, not poverty per se. In this context, boys are particularly disadvantaged from the early years onwards (Moss and Washbrook, 2016), as are children from Chinese, Bangladeshi, Black African, Black Caribbean, and Black other backgrounds (Strand and Lindsay, 2009) and children whose first language is not English (Dockrell et al., 2014).
One recommendation of the All-Party Parliamentary Group on Speech and Language Difficulties (APPG, 2013) was that pupils with SLCN, particularly those living in disadvantaged areas, should receive early interventions underpinned by robust evidence of their effectiveness. The APPG further recommended that relevant practitioners could benefit from professional development and coaching in providing rich oral language environments, including in schools.
The London Bubble Theatre Company’s ‘Speech Bubbles’ Programme is an intervention specifically for early primary-aged children in disadvantaged
neighbourhoods with identified speech, language and communication needs, including the need to develop prosocial behaviour, confidence and self-esteem. It uses trained drama practitioners paired with the schools’ own familiar learning support staff, who themselves receive additional training in how to create an
enriched oral and story-telling environment. The ‘Speech Bubbles’ programme is also distinctive in working with the whole body, putting children’s own narrated stories at the centre of the workshops and building young children’s confidence without
immediate pressure to speak. Hearing and telling stories is linked to success in literacy (Brice Heath, 1982; Pellegrini and Galda, 1993; Isbell et al, 2004). Recent research also focusses on the benefits to mental health and emotional well-being of being able to mentalize, and to have a language for representing one’s experiences and feelings (Muller and Midgley, 2015). Storytelling provides a rich and creative symbolic language for doing this.
In his 2014-15 evaluation, Dr Jonathan Barnes obtained statements from class teachers of each child’s speech and language development at the point of referral and after the intervention. In teacher summaries of children’s improvement in learning, speaking and listening after the intervention, on a scale of 0-4 (where 0 indicates ‘slipped back’ and 4 indicates ‘striking improvement’), 85% showed
improvement, with 45% showing clear or striking improvement. Participating schools have also routinely made available data assessing each child’s National Curriculum APP (Assessing Pupil Performance) scores or their equivalent, as schools have moved to assessment without levels. However, these measures are quite ‘blunt instruments’ in relation to SLCNs and were found by Dr Barnes to be inconclusive in evidencing the contribution ‘Speech Bubbles’ made to children’s progress. Nearly all children in participating schools were reported as obtaining the expected average rise in levels, regardless of whether or not they participated in ‘Speech Bubbles’ programmes.
Additional evidence obtained by Dr Barnes aimed at securing a degree of externality. This included independent speech therapy assessments at one school, independent speech therapists’ observations of the programme in general at
another, a small number of case studies of individual children from a sub-group of participating schools, and a small number of follow-ups of children into years 5 and 6 in one school. In 2012, the project also piloted the use of the Leuven well-being scales (LW-BS; Laevers, 1994a and b). These were used to rate children whilst watching audio-visual recordings of them participating in ‘Speech Bubbles’ sessions, and were undertaken by classroom teachers not involved in the project, and by parents and carers.
Dr Barnes notes that ‘Speech Bubbles’ owes its success to
“A predictable structure; secure, gentle relationships; clarity of purpose; consistent drama and child-centred-ness…and confidence engendered within the group.” (Barnes, 2015).
Barnes attempted to capture the subjectively experienced dimensions of ‘Speech Bubbles’ and the emerging confidence in the children by gathering
qualitative data. This included school and drama practitioners’ summaries of each child’s weekly progress in the project; parents’ and carers’ comments gathered from the two ‘open’ sessions held during each delivery of the programme; and the video recordings of sessions subsequently analysed by parents, LSAs, teachers and an independent group of teachers.
Dr Barnes’ findings were very positive, particularly with regard to
stakeholders’ clear convictions that ‘Speech Bubbles’ was making a difference. An additional unexpected finding was the response of LSAs to their involvement in the programme. They report a renewed sense of confidence and purpose in their role. This is an important finding in the light of the All-Party Parliamentary Group on Speech and Language Difficulties’ recommendation that additional professional development and coaching would benefit schools’ ability to provide richer oral language environments (APPG, 2013).
Dr Barnes’ recommendation for future evaluations was that they should “…include randomised control trials in several SB schools” (Barnes, 2015: 47). The UEL study has conducted research approximating to a randomised control trial.
The UEL Study – Methodology
Ethical conduct
As noted above, the UEL study obtained approval from the University’s Research Ethics Committee. The schools participating in the ‘Speech Bubbles’
research programme selected child participants according to their level of SLC need. Prior to participating, schools wrote to the parents or carers of children selected, explaining the presence of researchers in relation to the ‘Speech Bubbles’
intervention and the purpose of the research. The schools noted that researchers would obtain individual consent from parents, and assent from children. A
‘Frequently Asked Questions’ letter was prepared for parents to accompany the consent form (see Appendix 1). Staff familiar to the children talked to them about the study individually, and then asked children to give their assent on a simple sheet by sticking a sticker onto the sheet and signing their name (see Appendix 2). We obtained demographic data for each child (age, gender, ethnic background and home language). We ensured all data relating to individual children was anonymous. The storage and use of data has been compliant with UEL University Research Ethics Committee’s guidelines.
Screening tools and procedures
To administer the pre- and post-tests, children were withdrawn from class early in the autumn term and at the end of the summer term in 2015-16, and at the end of the summer term in 2016-17. Depending on age at point of testing, they completed one of the Communication Trust’s Speech, Language and Communication Progression Tools (SLCTPTs). These aim to support teaching staff to identify children who may be struggling to develop their speech, language and communication skills, but the tools can also be used to track progression over time
following interventions.In 2015-16 researchers used the tool for 5-6 year olds, and in 2016-17, the tool for 7-8 year olds. The tools were developed by specialists in
speech, language and communication in collaboration with mainstream teachers, teaching assistants, SENCOs and school leadership teams. They can be administered by non-specialists.
UEL students on the B.A. (Hons) Psychosocial Studies with Professional Practice received training in the use of the SLCPT from the lead researcher, Dr Heather Price, a former primary school Special Educational Needs Co-Ordinator. Dr Price also supervised the students in their initial one-to-one screening sessions in school to ensure all student researchers were carrying out the screening and recording the results in the same way. Students were selected if they were competent with the tool and had experience in working in a paid or voluntary capacity with children. The students administered the tool as a ‘quiz’, starting with a warm-up with a soft toy and ending with stickers as rewards. Students did not know who was receiving the intervention that year, and who was not.
Children are used to being withdrawn from class for one-to-one support and screening and this was a fun, short screening process. A member of school staff known to the child was always present. Where children did not want to take the test, or to continue, the screening stopped and school staff supported the child. Children were offered the chance to participate at another time. There was always a point of liaison with school staff for the research.
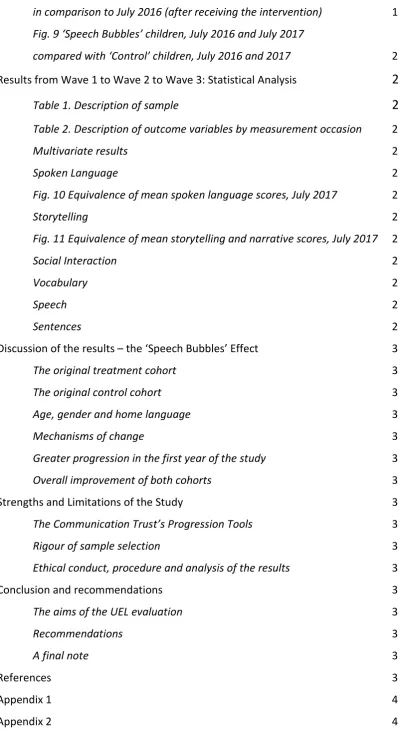
Research design
In 2015-16, the research team compared pupils who took part in ‘Speech Bubbles’ sessions with pupils with similar speech, language and communication needs in the same classes who were not receiving the intervention. Both sets of children were screened at the start and end of the academic year (Wave 1 and Wave 2), and their results compared and analysed statistically. In 2016-17, children who had been part of the ‘comparison’ group the previous year went on to receive the intervention. Both sets of children were screened again at the end of the academic year (Wave 3) and their results compared and analysed statistically.
We compared the test results for the original comparison group post-intervention with their test results at the same test point the previous school year. We also compared the test results of the original ‘‘Speech Bubbles’’ group post-intervention, with their test results at the same point the following year. We wanted to see if the children had maintained any gains attributable to the ‘Speech Bubbles’ intervention once a year had passed.
Fig. 1 – research design
Sept. 2015
Wave 1
July 2016
Wave 2
Sept. 2016 July 2017
Wave 3
‘Speech Bubbles’ (‘SB’) children N = 51 Pre-test (5-6 yr tool)
‘Speech Bubbles’ (‘SB’) children N = 51 Post-test (5-6 yr tool)
‘Speech Bubbles’ (‘SB’) children N = 46
No Speech Bubbles
‘Speech Bubbles’ (‘SB’) children N = 46 2nd post-test
(7-8 yr tool) Control
(‘C’) children N = 38 Pre-test (5-6 yr tool)
No ‘Speech Bubbles’
Control (‘C’) children N = 38 Post-test (5-6 yr tool)
Control (‘C’) children N = 29
Control (‘C’) children N = 29 2nd post-test
(7-8 yr tool)
Research sample
Originally, 51 children across three schools took part in the research
programme and attended ‘Speech Bubbles’ in 2015-16; 38 children from across the three schools acted as a ‘control’ group and did not receive the intervention. 29 of the latter were still available to the research programme to attend ‘Speech Bubbles’ the following year (2016-17). 46 of the 51 children who had originally attended ‘Speech Bubbles’ were still available to the research programme during 2016-17 to act as a ‘control’ comparison group, and to be followed up to see if the benefit of attending ‘Speech Bubbles’ was maintained over time.
There were therefore 89 children in the original sample in 2015-16, of whom 75 were available for the research programme in 2016-17. Children who dropped out between 2015-16 and 2016-17 have been excluded from our final analysis of the children’s performance from wave 1 (2015-16) through to wave 3 (2016-17) on pp. 21-28 below.
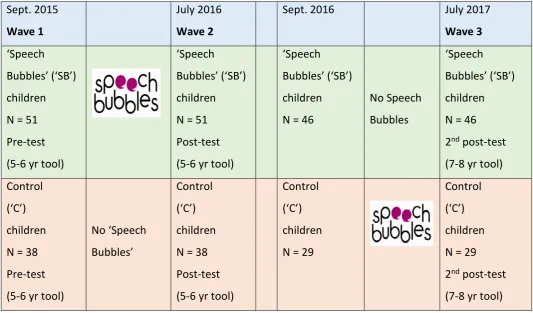
In the final sample, 40% were girls and 60% were boys. There were 16 different ethnic categories represented, and 20 languages spoken at home in
addition to English, although the predominant language spoken at home was English (for 70% of children, compared to 30% speaking another language). The
[image:14.595.88.500.220.456.2]predominant ethnic groups were Black Caribbean, Black African and White UK.
Fig. 2 – ethnicity
In the final sample, the mean age of pupils was six years and a month, with the youngest pupil being five years old and the oldest being seven years and four months old.
The three schools were located in postcodes in SE1 and SE17. Across the three schools, an average of 20.43% of pupils were registered for free school meals compared to the national average of 13.46%, and in all three schools the proportion of children from minority ethnic backgrounds, and from backgrounds where English was not the home language, was higher than the national average.
Ethnicity as recorded by the schools
Black Caribbean 34% Black African 28% White UK 12% Asian 10% Other 9% East European 7%
The Communication Trust’s Speech, Language and Communication Progression Tools
The tools track six different aspects of speech, language and communication: 1. Understanding spoken language 4. Storytelling and Narrative 2. Understanding and using vocabulary 5. Speech
3. Sentences 6. Social interaction
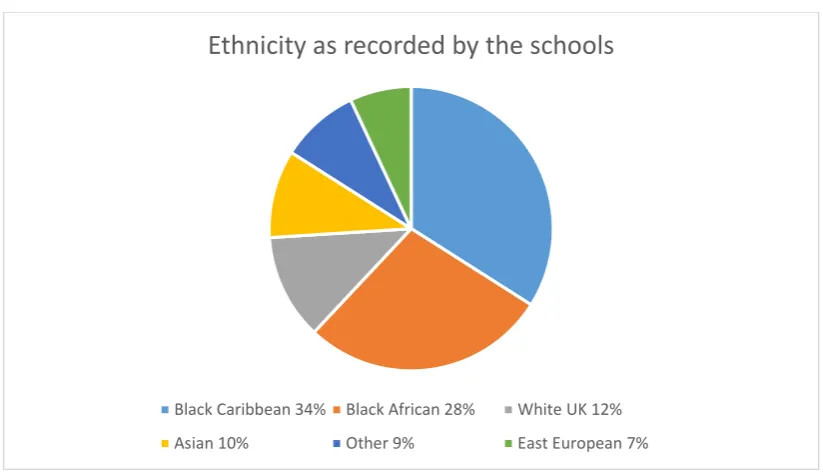
The screening tool for each age group has a ‘questions’ section, where screeners ask the child three questions for each of the six aspects of SLC, and an ‘observations’ section. The UEL research project used the ‘questions’ section only. There is a ‘scoring’ section and researchers followed the detailed guidelines on how to log each answer. It is then possible to plot each child’s scores on each of the SLC areas using a range with 2 point intervals (3 – 15), which is coded according to a ‘RAG’
[image:15.595.96.508.428.651.2](‘red-amber-green’) rating, based on what all children should be able to do by the time they are between, e.g. 5 and 6 years old. ‘Green’ indicates performance at an average expected level and ‘red’, a performance suggesting the need for specialist analysis and intervention.
Fig. 3 SLCPT Profile Chart, modified
Score
Understanding Spoken Language
Understanding and using vocabulary
Sentences Storytelling and
narrative
Speech Social Interaction
15 13 11 9 7 5 3
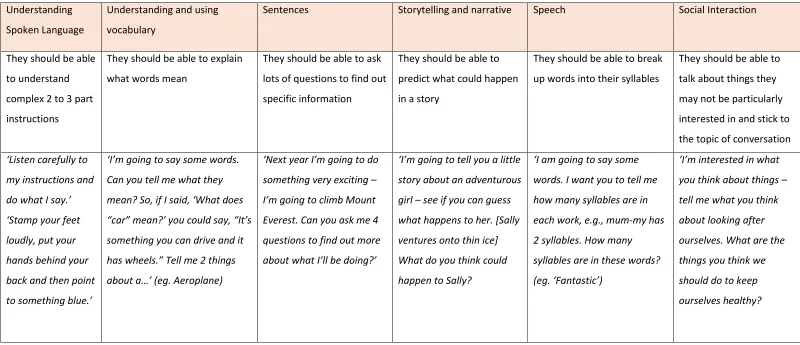
The questions asked vary in complexity depending on the age range tested by the tool. For the purposes of illustration, the tables below show the 3rd question
asked in each of the six aspects of SLC for ages 5 – 6 yrs, used by our student screeners in 2015-16, and ages 7 – 8 yrs, used by our student screeners in 2016-17.
Fig. 4 SLCPT ages 5-6 yrs, 3rd question in each of the six aspects of SLC
Understanding Spoken Language
Understanding and using vocabulary
Sentences Storytelling and narrative
Speech Social Interaction
They should be able to understand ‘how’ or ‘why’ questions
They should be able to name objects, animals and
characters from a description
They should be able to answer ‘What could we do next?’ questions
They should be able to make up their own simple stories
They should be able to work out what sound comes at the beginning of a word
They should be able to give their opinions, and discuss ideas and feelings
“Do you know the story of Cinderella?’ (or similar) “Why did Cinderella do all the cleaning in the house?” (or similar)
“I’m going to describe some things, so listen carefully. See if you can guess what I’m talking about” (eg. ‘It has wheels and handlebars and you pedal it’)
‘I’m going to ask you some questions about what you could do next’ (eg. ‘You’re cold – what could you do next?’)
‘Let’s see if we can make up a story together. I will start us off…’ ‘Once upon a time there was a green, slimy alien who landed on earth. He was hungry so…’
‘I want you to think of what sounds come at the beginning of words. So, for example, ‘cat’ begins with ‘c’. I am going to say some words; which sound comes at the beginning of…?’ (eg. ‘Sun’)
‘I’m interested in what you think about things – tell me 3 thing you like about school. Is there anything you don’t like?’
Understanding Spoken Language
Understanding and using vocabulary
Sentences Storytelling and narrative Speech Social Interaction
They should be able to understand complex 2 to 3 part instructions
They should be able to explain what words mean
They should be able to ask lots of questions to find out specific information
They should be able to predict what could happen in a story
They should be able to break up words into their syllables
They should be able to talk about things they may not be particularly interested in and stick to the topic of conversation ‘Listen carefully to
my instructions and do what I say.’ ‘Stamp your feet loudly, put your hands behind your back and then point to something blue.’
‘I’m going to say some words. Can you tell me what they mean? So, if I said, ‘What does “car” mean?’ you could say, “It’s something you can drive and it has wheels.” Tell me 2 things about a…’ (eg. Aeroplane)
‘Next year I’m going to do something very exciting – I’m going to climb Mount Everest. Can you ask me 4 questions to find out more about what I’ll be doing?’
‘I’m going to tell you a little story about an adventurous girl – see if you can guess what happens to her. [Sally ventures onto thin ice] What do you think could happen to Sally?
‘I am going to say some words. I want you to tell me how many syllables are in each work, e.g., mum-my has 2 syllables. How many syllables are in these words? (eg. ‘Fantastic’)
[image:17.842.21.821.110.455.2]‘I’m interested in what you think about things – tell me what you think about looking after ourselves. What are the things you think we should do to keep ourselves healthy?
Fig. 5 SLCPT ages 7-8 yrs, 3rd question in each of the six aspects of SLC
Logging children’s answers and scoring
As noted, the SLCPT provides a way of determining where a child’s
development is in relation to their age, and is designed to be used by practitioners without any specialised speech and language training. It is not a diagnostic tool and has not been standardised. Student researchers logged the children’s answers but did not score the individual screening papers. The students varied, in that some of the students who screened the children at the start of the year did not screen them at the end of the year. The students did not know who was in the ‘SB’ group and who was in the ‘C’ group. The lead researcher, Dr Price, scored all the individual screening papers. The scorer did not know who was in the SB group and who was in the C group.
Statistical analysis
The study used linear regression with the difference-in-differences (DiD) estimator to model the treatment effect. The process involved estimating the difference between all the outcome measures of interest (that is, spoken language, vocabulary, sentences, storytelling, speech, and social interaction) at baseline and post intervention points for both the ‘SB’ (treatment) and ‘C’ (control) groups and then comparing the difference between the groups. The difference in mean scores of the outcome variables from Wave 1 to Wave 3 was similarly tested.
This statistical approach is one of the most popular tools for applied research in evaluating the effects of interventions and other treatments of interest on some relevant outcome variables (Abadie, 2005). Buckley, Jack & Yi Shang (2003) see the difference-in-differences (DiD) approach as reliable for both applied quantitative education and public policy research. The use of DiD is even more relevant in quasi-experimental studies with observational data where self-selection to treatment may present some challenges.
The UEL Study - Results
Results from Wave 1 to Wave 2: 2015-16
Fig.5 Improvement of ‘‘Speech Bubbles’’ children in comparison to ‘control’ children, 2015-16
In 2015-16, in five out of six of the categories tested using the progression tool (spoken language, vocabulary, sentences, storytelling and narrative, social
interaction) the children receiving the intervention made better progress than the ‘control’ group of children.
0 2 4 6 8 10 12 14 16
Understanding
Spoken Language Understandingand Using Vocabulary
Sentence Building Storytelling and
Narrative Speech Social Interaction Chart 1 - Improvement of ‘‘Speech Bubbles’’ children in comparison
to ‘control’ children, post-intervention July 2016
Speech Bubbles children pre-intervention Control children pre-intervention Speech Bubbles children post-intervention Control children post-intervention
Fig.6 Average point rise in scores: ‘‘Speech Bubbles’’ children in comparison to ‘control’ children, 2015-16
The comparatively better progress made by the children receiving the intervention in 2015-16 was statistically significant in three out of six of the categories tested
(spoken language, storytelling, social interaction). 0
0.5 1 1.5 2 2.5 3 3.5 4
Understanding
Spoken Language Understanding andUsing Vocabulary Sentence Building Storytelling andNarrative Speech Social Interaction Chart 2 – Average point rise in scores: ‘‘Speech Bubbles’’ children in
comparison to ‘control’ children, post-intervention July 2016
Speech Bubbles children Control children
Results from Wave 1 to Wave 2: Statistical Analysis
Spoken Language, 2015-16
A simple linear regression was calculated to predict the change in spoken language based on exposure to the intervention. A statistically significant regression equation was found (F(3,174) =8.64, p< 0.000), with an R2 of 0.130. The results show
that the spoken language skills of treatment participants increased by 2.04 (p=0.01) compared to the control group. This means that the spoken language skills of participants in the treatment group gained an additional unit increase in their respective spoken language skills from participating in the 24 week ‘Speech Bubbles’ programme.
Vocabulary, 2015-16
Another simple linear regression was calculated to predict the change in vocabulary competence based on exposure to the intervention. A significant regression equation was found (F(3,174) =5.10, p< 0.002), with an R2 of 0.081. The
results show that there was, however, no statistically significant increase in the vocabulary competence of treatment participants (b=0.005, p=0.99) compared to the control group. This means that the intervention did not lead to a statistically
significant improvement in the vocabulary competence of the treatment group post-test.
Sentences, 2015-16
A separate simple linear regression was calculated to predict the change in sentence proficiency based on exposure and non-exposure to the 24 week ‘Speech Bubbles’ programme. A non-significant regression equation was found (F (3,174) =2.611, p= 0.05), with an R2 of 0.043. However, results indicate that there was no
statistically significant increase in the sentence proficiency of treatment participants (b=0.28, p=0.74) compared to the control group. This means that the intervention did not lead to a statistically significant improvement in the sentence proficiency of the treatment group post-test.
Storytelling, 2015-16
A simple linear regression was calculated to predict the change in storytelling and narrative ability of participants based on exposure to the intervention. A
significant regression equation was found (F(3,174) =10.19, p< 0.000), with an R2 of
0.149. The results show that there was a statistically significant increase in the storytelling and narrative ability of treatment participants, with an increase of over one unit (b=2.37, p=0.02) compared to the control group. This means that the intervention did lead to a statistically significant improvement in the storytelling and narrative ability of the treatment group post-test.
Speech, 2015-16
Using a simple linear regression we calculated the change in speech capacity based on exposure and non-exposure to the 24 week ‘Speech Bubbles’ programme. A non-significant regression equation was found (F (3,174) = 1.564, p= 0.200), with an R2 of 0.026. The results indicate that there was no statistically significant increase
in the speech capacity of the treatment participants (b=-0.27, p=0.77) compared to the control group. This means that the intervention did not lead to a statistically significant improvement in the speech capacity of the treatment group post-test.
Social interaction, 2015-16
The final simple linear regression was calculated to predict the change in social interaction skills based on exposure and non-exposure to the 24-week drama activities. A significant regression equation was found (F (3,174) =7.26, p< 0.000), with an R2 of 0.111. The results shows that the social interaction skills of treatment
participants increased by 1.85 (p=0.02) compared to the control group. This means that the social interaction skills of participants in the treatment group experienced a level increase in their social interaction skills due to their exposure to the 24 week ‘Speech Bubbles’ programme compared to the control group.
Results from Wave 2 to Wave 3: 2016-17
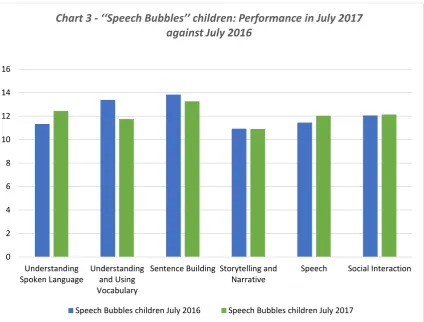
Fig. 7 ‘‘Speech Bubbles’’ children: Performance in July 2017 in comparison to July 2016
In 2016-17, in two out of six of the categories tested using the progression tool (spoken language and speech) the children’s scores one year after receiving the intervention show them improving their progress. In two further categories
(storytelling and narrative, and social interaction) the children have maintained their progress. In the remaining categories (understanding and using vocabulary, and sentences) the children have not made the same level of progress.
0 2 4 6 8 10 12 14 16
Understanding
Spoken Language Understandingand Using Vocabulary
Sentence Building Storytelling and
Narrative Speech Social Interaction
Chart 3 - ‘‘Speech Bubbles’’ children: Performance in July 2017 against July 2016
Speech Bubbles children July 2016 Speech Bubbles children July 2017
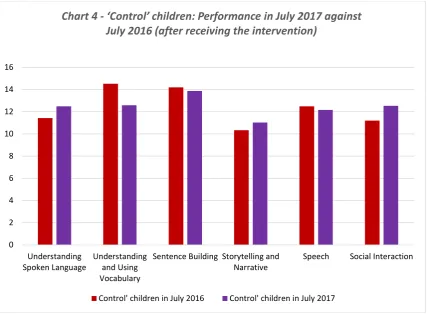
Fig. 8 ‘Control’ children: Performance in July 2017 in comparison to July 2016 (after receiving the intervention)
In 2016-17, in three out of six of the categories tested using the progression tool (understanding spoken language; storytelling and narrative; and social interaction)
the ‘control’ children now receiving the intervention have improved their progress.
In the category, ‘understanding and using vocabulary’, they have not made the same level of progress and in the categories ‘sentences’ and ‘speech’, they have made marginally less progress.
0 2 4 6 8 10 12 14 16
Understanding
Spoken Language Understandingand Using Vocabulary
Sentence Building Storytelling and
Narrative Speech Social Interaction
Chart 4 - ‘Control’ children: Performance in July 2017 against July 2016 (after receiving the intervention)
Control' children in July 2016 Control' children in July 2017
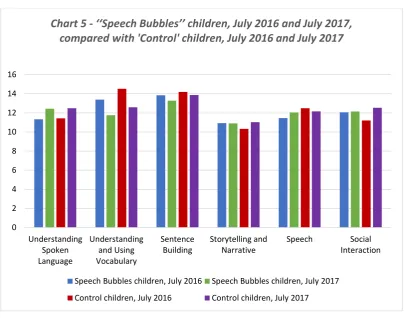
Fig. 9 ‘Speech Bubbles’ children, July 2016 and July 2017, compared with ‘Control’ children, July 2016 and 2017
This chart shows the children’s results at the end of 2015-16 and 2016-17. In the category, ‘spoken language’, the original ‘‘Speech Bubbles’’ treatment group have improved their scores by approximately 1 point. The ‘control’ group, receiving ‘Speech Bubbles’ in 2016-17, have similarly improved their scores. In the category, ‘vocabulary’, the children’s scores in both groups have declined, by approximately 1.5 and 2 points respectively. In the category, ‘sentences’, there has been a slight decline in scores in both groups (less than 1 point). In the category, ‘storytelling’, the original ‘‘Speech Bubbles’’ children have maintained their score, whilst the ‘Control’ group have slightly improved theirs (by nearly 1 point). In the category, ‘speech’, the original ‘‘Speech Bubbles’’ children have again improved their score, by
approximately half a point, but the ‘Control’ children’s score has declined by approximately half a point. Finally, in the category, ‘social interaction’, the ‘Speech Bubbles’ children have again held their gain, whilst the ‘control’ group have
improved theirs by more than 1 point after receiving the intervention.
0 2 4 6 8 10 12 14 16
Understanding Spoken Language
Understanding and Using Vocabulary
Sentence
Building Storytelling andNarrative Speech InteractionSocial
Chart 5 - ‘‘Speech Bubbles’’ children, July 2016 and July 2017, compared with 'Control' children, July 2016 and July 2017
Speech Bubbles children, July 2016 Speech Bubbles children, July 2017 Control children, July 2016 Control children, July 2017
Results from Wave 1 to Wave 2 to Wave 3: Statistical Analysis
The treatment effects of the ‘Speech Bubbles’ programme are most marked in relation to the categories, ‘spoken language’, ‘storytelling’ and ‘social interaction’. The primary outcomes of interest are therefore the scores for these.
We used the Difference in Difference Estimator to test for the difference in mean scores of the outcome variables from wave 1 to wave 3. Before this, a series of multiple linear regression models were calculated to predict the change in spoken language, storytelling and social interaction from wave 1 to wave 2. Because an independent sample t-test revealed that the mean score for the control and treatment groups were not comparable at baseline, the regression models
controlled for participants’ age, gender, home language and school.To confirm the results, two paired samples t-tests were conducted, one with the original (‘SB’) treatment group and the second with the original control group, to assess change from wave 1 to wave 3 after the treatment and control groups were swapped. In these analyses, the children who dropped out between 2015-16 and 2016-17 have been excluded. The descriptive characteristics of the study sample are presented first, followed by the multivariate results from the series of linear regression models addressing the research questions.
Descriptive results
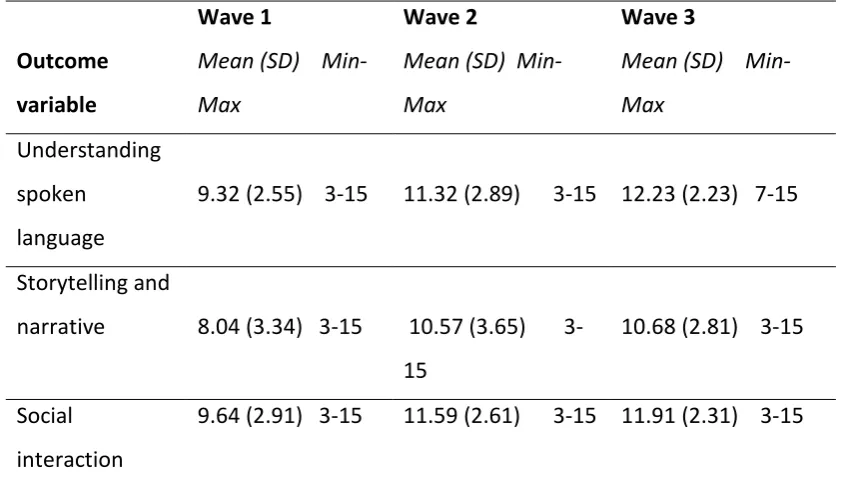
Table 1 presents the descriptive statistics of the dependent, independent, and control variables used in the regression models. To recap, the final sample consisted of 75 primary school children from three schools in the London Borough of Southwark, with 32% from ‘Greenside’ School, 39% from ‘Brownfields’ School and 29% from ‘Redlands’ School. Of these, 40% were girls, and 60% were boys; 70% spoke English as a home language and 30% did not. The mean age of participants was six years and a month with the youngest pupil being five years old and the oldest being seven years and four months old. Table 2 below also indicates the mean scores for the dependent variables. The mean score for ‘Spoken Language’ was 9.32 (SD=2.55) ‘Storytelling’, 8.04 (SD=3.34) and ‘Social interaction’, 9.64 (SD=2.91), all with a minimum score of 3 and a maximum score of 15.
Table 1. Description of sample
Variable Freq. (%) Mean (SD) Min-Max
Sex Male Female 45 (60%) 30 (40%) School Greenside Brownfield Redlands 24 (32.0) 29 (38.7) 22 (29.3) Ethnicity Black Asian White Dual Heritage 50 (66.7) 10(13.3) 11 (14.7) 04 (5.3)
Age 6.1 (0.62) 5 -7.4
Table 2. Description of outcome variables by measurement occasion
Outcome variable
Wave 1
Mean (SD) Min-Max
Wave 2
Mean (SD) Min-Max
Wave 3
Mean (SD) Min-Max
Understanding spoken
language
9.32 (2.55) 3-15 11.32 (2.89) 3-15 12.23 (2.23) 7-15
Storytelling and
narrative 8.04 (3.34) 3-15 10.57 (3.65) 3-15
10.68 (2.81) 3-15
Social interaction
9.64 (2.91) 3-15 11.59 (2.61) 3-15 11.91 (2.31) 3-15
[image:27.595.87.510.491.731.2]Multivariate results
In this section, the results of the change in the mean scores for ‘Spoken Language’, ‘Storytelling ’ and ‘Social Interaction’ after the first intervention are presented. This is followed by the results of the analysis in the overall change at endpoint in the mean score for all the outcome variables.
Spoken language
A multiple linear regression indicated that a statistically significant regression equation was found (F(6,171) =7.63, p < .001), with an R2 of .21. The results show
that the ‘Spoken Language’ skills of the original (‘SB’) treatment participants increased by 2.05 (p = .008) compared to the control group. This means that the spoken language skills of the original (‘SB’) participants in the first treatment group gained an additional unit increase in their respective spoken language skills from participating in the 24-week drama activities. The results show that one of the control variables [Age (b=1.12. p< 0.01)] in the model was statistically significant. Gender and home language, however, were not significant.
Comparing the overall effect of the intervention from baseline (Wave 1) to endpoint (Wave 3), (i.e., after both groups had received the intervention) a statistically significant regression equation was found (F (5,162) = 17.23, p < .001), with an R2 of 0.35. However, the treatment effect was not statistically significant (b =
-1.40, p = .52). This non-significant finding suggests that the ‘Speech Bubbles’ intervention was effective because after both groups received the intervention, there was no statistically significant difference between the means of the ‘Spoken Language’ score for both groups at the end of the intervention. Indeed, a two paired samples t-test on the original (‘SB’) treatment group and the new treatment group (the original ‘C’ group) showed statistical significance. This means that the original (‘SB’) treatment group improved in spoken language due to exposure to the interventions, and the new treatment group also showed improvement in their spoken language proficiency due to exposure to the intervention.
A split plot mean ANOVA analysis showed by the endpoint (2nd
post-intervention) the mean spoken language scores for the new control group (the ‘Speech Bubble’ group, =12.17), and new treatment groups (original control group, =12.26) were equivalent.
Fig. 10 Equivalence of mean spoken language scores, July 2017
Storytelling
Another multiple linear regression was conducted to assess the effect of participation in ‘Speech Bubbles’ on ‘Storytelling and Narrative’ from Wave 1 to Wave 2.
A statistically significant regression equation was found (F (6,171) =11.91, p < .001), with an R2 of .30. The results indicated that the storytelling and narrative skills
of children in the (‘SB’) treatment group increased by 2.40 (p < .05) compared to the control group. This result is an indication that storytelling and narrative abilities of participants in the treatment group gained more than two additional unit increases from participating in the 24-week drama activities. The results show that two of the control variables in the model were statistically significant. These were age (b=1.86.
p < .001) and sex (b = -1.16. p < .05). Home language was not statistically significant.
Holding all other variables in the model constant, each additional increase in age (measured in months) was associated with an 86 percent increase in the storytelling and narrative qualities of participants. Girls scored 1.16 per more than boys in storytelling and narrative abilities holding all variables in the model constant, that is, there was a 16 per cent increase in their scores over and above the increases in scores of the boys.
A comparison of the overall effect of the ‘Speech Bubbles’ intervention from baseline (Wave 1) to endpoint (Wave 3), after both groups had received the
intervention, revealed a statistically significant regression equation (F (6,161) =14.04,
p < .001), with an R2 of .32. However, the treatment effect was not statistically
significant (b = -1.06, p = .22). This non-significance again suggests that the ‘Speech Bubbles’ intervention was effective because after both groups received the
treatment, they scored similarly on storytelling and narrative scores.
However, age (b=1.67, p <.001) and gender (b=1.33, p < .02) were statistically significant. What is meant by this is that a unit (monthly) increase in the age of participants was associated with a 1.67 increase in storytelling and narrative capabilities of participants, and girls scored a 1.33 increase in storytelling and narrative scores over and above the increase of their male counterparts, holding all other variables constant. Again, home language was not statistically significant.
A two paired samples t-test on the original (‘SB’) treatment group and the new (‘C’) treatment group showed statistical significance. This statistical significance implies that both the original treatment group (‘Speech Bubbles’ children) and the original control group (receiving ‘Speech Bubbles in 2016-17) improved in
storytelling and narrative skills as a result of their exposure to the intervention. A split plot mean ANOVA analysis showed that at endpoint (2nd, post-intervention test
[image:30.595.94.347.562.783.2]point, July 2017) the mean storytelling and narrative skills scores for the control (10.86) and treatment groups (10.57) were equivalent.
Fig. 11 Equivalence of mean storytelling and narrative scores, July 2017
Social Interaction
To assess changes in scores in ‘Social Interaction’ after only one group received the intervention, a multiple linear regression was conducted based on data from Wave 1 and 2. The results indicate a statistically significant regression equation was found (F(6,171) =8.43, p < .001), with an R2 of .23. The results show that the
social interaction skills of treatment participants increased by 1.88 (p<0.02)
compared to the control group. The results are an indication that social interaction abilities of participants in the treatment group increased by nearly two units after participating in the ‘Speech Bubbles’ intervention.
The results show that two of the control variables in the model were again statistically significant. These were age (b = 1.22, p < .001) and gender (b = -1.01, p < .05). Home language was not statistically significant. Boys scored 1.01 lower than girls on the social interaction scale and older children were more likely to do better than younger participants irrespective of other variables in the model.
An evaluation of the overall effect of the ‘Speech Bubbles’ intervention from baseline (Wave 1) to endpoint (Wave 3), after both groups had received the
intervention, revealed a statistically significant regression equation (F (6,161) =10.71,
p < .000), with an R2 of .28. For this model, the treatment effect was not statistically
significant (b = -.04, p = .95). This non-significant suggests that the ‘Speech Bubbles’ intervention was effective because after both groups received the treatment, they both scored similarly on the ‘Social Interaction’ scale.
A two paired samples t-test on the original (‘SB’) treatment group and the new (‘C’) treatment group showed statistical significance. This statistical significance implies that the original treatment group improved in ‘Social Interaction’ proficiency as a result of their exposure to the intervention. It also suggests that the new
(originally, ‘C’) treatment group equally showed improvement in their social interaction skills at some point due to exposure to the intervention.
A split plot mean ANOVA analysis showed by the endpoint (2nd
post-intervention test point, July 2017) that the mean social interaction skills scores for the control (original ‘Speech Bubble’ group = 11.65) and new treatment groups (original ‘Control’ group = 12.31) were not statistically different.
Vocabulary
A multiple linear regression indicated that a statistically significant regression equation was found (F(6,171) =8.98, p < .001), with an R2 of .21. The results show
that the treatment effect was not statistically significant (b = 0.03.p = .96). This means that the difference in difference in the mean scores of vocabulary for participants in both the treatment group and control group is not statistically different after participating in the 24-week drama activities. However, the results show that age (b=1.40. p< 0.01) and gender (b= -0.58, p < .02) were statistically significant. Thus older children score 1.40 more than their younger counterparts and females score lower compared to male participants.
Comparing the overall effect of the intervention from baseline (Wave 1) to endpoint (Wave 3), (i.e., after both groups had received the intervention) a statistically significant regression equation was found (F (6,161) = 7.86, p < .001), with an R2 of 0.20. However, the treatment effect was not statistically significant (b =
-.83, p = .84). This non-significant finding suggests that the ‘Speech Bubbles’
intervention was not effective in relation to improving vocabulary because after both groups received the intervention, there was no statistically significant difference between the means of the vocabulary of each at the end of the intervention. Similarly, a two paired samples t-test on the original treatment group (‘Speech Bubbles children) and the new treatment group showed no statistical significance. A close assessment of the means of each group points to a reduction in the mean scores of the participants in relation to vocabulary.
Speech
A multiple linear regression indicated that a statistically significant regression equation was found (F(6,171) = 7.78, p < .001), with an R2 of .19. However, the
results show that the treatment effect was not statistically significant (b = -0.24. p = .78). This means that the difference in difference in the mean scores for the ‘Speech’ category for participants in both the treatment group and control group was not statistically different after the first wave of intervention activities. However, the results show that age (b=1.86. p< 0.01) was statistically significant. Thus older children score 1.86 more than their younger counterparts.
When the overall effect of the intervention was compared from baseline (Wave 1) to endpoint (Wave 3), (i.e., after both groups had received the
intervention) a statistically significant regression equation was found (F (6,161) = 6.19, p < .001), with an R2 of 0.16. However, the treatment effect was not statistically
significant (b = -.55, p = .54). This non-significant finding suggests that the
intervention was not effective because after both groups received the intervention, there was no statistically significant difference between the means of the ‘Speech’ score of both groups at the end of the intervention. In the same way, a two paired samples t-test on both groups indicated no statistical significance. A close
assessment of the means of both the ‘SB’ group and the ‘C’ group pointed to an increase in ‘speech’ mean scores, without statistical significance.
Sentences
Finally, a multiple linear regression showed a statistically significant regression equation; (F(6,171) = 7.11, p < .001), with an R2 of .18. The results
conversely showed that the treatment effect was not statistically significant (b = .29.
p = .71). This suggests that the difference in difference in the mean scores for the
‘Sentences’ category for participants in both the treatment group and control group was not statistically different after the first wave of the ‘Speech Bubble’ intervention activities. However, the results show that age (b=1.73. p< 0.01) was statistically significant. Thus older children scored 1.73 more than their younger counterparts.
An assessment of the overall effect of the intervention was carried out by comparing baseline (Wave 1) to endpoint (Wave 3), (i.e., after both groups had received the intervention). A statistically significant regression equation was found (F (6,161) = 5.45, p < .001), with an R2 of 0.14. However, the treatment effect was not
statistically significant (b = .11, p = .90). This non-significant finding suggests that the intervention was not effective because after both groups received the intervention, there was no statistically significant difference between the means of the sentence building score of both groups at the end of the intervention. A two paired samples t-test on original treatment group (‘Speech Bubbles’ children) and the new treatment group showed no statistical significance. An assessment of the means of both the ‘Speech Bubbles’ group and the ‘Control’ group points to an increase in the mean scores of the sentence structure of participants, but the differences were not statistically significant.
Discussion of the results – the ‘Speech Bubbles’ effect
The original treatment cohort
The results show that children who received ‘Speech Bubbles’ in 2015-16 made better progress in their SLC development than a similar ‘control’ sample. Additionally, this progress was statistically significant in three out of six of the categories tested (spoken language, storytelling and social interaction). We can also note that in spoken language and storytelling, the children receiving the intervention gained at least a unit (2 point) increase in score that was directly attributable to the intervention.
When tested at follow-up, the children had increased or maintained their gains in four out of six of the test categories (spoken language, storytelling, speech, social interaction). Although this group are still achieving scores in these areas in the ‘amber’ range (on the ‘RAG’ system of coding used by the SLCPT - see p. 10), they started from low baseline scores in September 2015. The intervention has therefore given valuable additional impetus to their upwards trajectory towards achieving average (green) scores. However, the children did not maintain their gains in ‘vocabulary’ and ‘sentences’. The intervention appears to have less impact here, as gains in 2015-16 did not reach statistical significance when compared to the control group. We can also note, though, that the children’s baseline scores, and subsequent progress in ‘sentences’ in 2016-17, are on target developmentally (p. 14).
The original control cohort
After receiving the intervention in 2016-17, the original control group also made progress, improving on their previous year's scores in spoken language, storytelling and social interaction – the areas in which ‘Speech Bubbles’ made most impact for the children the year before. Their scores did not reach statistical
significance when compared to the new ‘control’ group, but this was because the original ‘Speech Bubbles’ children held, or improved on, their gains. A two-paired samples t-test did show an improvement in the new treatment group’s scores in spoken language, storytelling and social interaction that was attributable to the intervention.
Age, gender and home language
Our results show that two out of three of other ‘control’ variables – age, gender and home language – have a statistically significant effect on outcomes in certain areas of SLC development. Home language was not a variable that made any statistical difference to outcome. As might be expected, age was statistically
significant in five out of six of the areas (spoken language, storytelling, social
interaction, speech and vocabulary), with slightly older pupils performing better, and benefitting more from the intervention. As might also be expected, gender was also statistically significant in three out of six of the areas, with girls performing better, and gaining more from the intervention, in the areas of storytelling and social interaction. Boys performed better in the area of vocabulary.
Mechanisms of change
We noted in the introduction that the ‘‘Speech Bubbles’’ drama sessions begin with games that emphasise inclusion and pro-social behaviour, and then move on to the group acting out one child’s made up story, told to the drama practitioner and written down verbatim. The closing period is calmer and gentler, with the children sharing their experiences of the session. Whilst this evaluation did not research the ‘‘Speech Bubbles’’ processes that led to change in the children, we would hypothesise that the ‘mechanisms of change’ (Dalkin et al, 2015) are enhancement of spoken language comprehension and use, increased storytelling and narrating skills, and raised confidence in social interaction. ‘Speech Bubbles’ does not appear to have the same notable effect on understanding and using vocabulary, and sentence building.
The greatest effects are in key areas of communication development that support efficacy and emotional well-being, as well as success in literacy (spoken language, storytelling and social interaction – see Muller and Midgley, 2015 and Isbell et al, 2004). Therefore, ‘Speech Bubbles’ has given pupils the targeted boost hoped for by stakeholders.
Greater progression in the first year of the study
It is important to reflect on why the children in the ‘control’ group did not make the same rate of progress as the original ‘‘Speech Bubbles’’ cohort in the first year of the study. This is not explicable in terms of less strong baseline scores. In fact, the original control cohort’s baseline scores were stronger. The original ‘Speech Bubbles’ cohort achieved outcomes that were statistically significantly better and maintained their gains in 2016-17.
The ‘Speech Bubbles’ programme is relatively ‘manualised’ and the same, or similarly experienced, staff delivered it. However, it is designed for use with younger children in the 5 – 8 year age range and some practitioners did observe that the second cohort were marginally less engaged, hypothesising that some of the children found it less suited to their age group.
However, probably or more significance is the change in the progression tool employed at the end of the second year of the study. The Communication Trust’s progression tools do not provide for standardisation of a child’s test scores in relation to their specific age. On p. 9, we noted that the average age of pupils in the final sample group at baseline was 6 years and one month. In 2015-16, we used the 5-6 year progression tool, which is suitable for use until a pupil’s seventh birthday. Therefore, when the children were tested in July 2016, they were at the upper end of the age range for this tool. In July 2017, we used the 7-8 year progression tool, which is suitable for use until a pupil’s ninth birthday. At this point, the children were at the mid-point of the age range for this tool, consistent with them performing slightly less well overall than if they had been at the upper end of the age range, as in the preceding year.
Additionally, in 2015-16, the children were screened twice, generating some familiarity with the questions at Wave 2.
Overall improvement of both cohorts
One could therefore argue that in fact it is testament to the impact of the ‘Speech Bubbles’’ intervention that the original control cohort did as well as they did in July 2017, improving on their scores in the categories of spoken language,
storytelling and social Interaction, despite being tested on a ‘harder’ tool.
Strengths and Limitations of the Study
The Communication Trust’s Progression Tools
The SLCPT was well suited as a measuring tool in this study because of its capacity to capture performance on less formal dimensions of communication development – understanding spoken language, storytelling and narrative and social interaction. These were aspects of SLC development that Dr Jonathan Barnes had argued were of crucial importance for social confidence, emotional well-being and self-esteem (Barnes, 2015). ‘Spoken language’, ‘storytelling’ and ‘social interaction’ were assessed in a less structured way that was also more dialogic and child-centred, giving the children scope to talk at length about topics of interest to them. As noted on p. 11 above, in the 5-6 year tool, in the ‘spoken language’ category, the children were asked to tell a well-known story and to explore a character’s motives. In the ‘storytelling’ category, they were asked about their weekend and their favourite stories. They were then invited to make up a ‘Slimy Green Alien’ story from an opening sentence. In the ‘social interaction’ category, children could comment on the games they liked to play, and their likes and dislikes at school. In the 7-8 year tool, children had similar scope in these three categories. In this respect, therefore, the Communication Trust’s progression tool was the right screening tool for
capturing areas of SLC development targeted by the ‘‘Speech Bubbles’’ programme.
Arguably, formal aspects of speech, vocabulary and sentence building receive more attention through the English language curriculum in the early years. They are also easier to codify for measurement. Screeners found it easier to record and score these aspects of performance on the SLCPT than understanding spoken language, storytelling and narrative and social interaction, and the scorer found them easier to score. However, the same screeners recorded results for both cohorts in 2015-16, and then in 2016-17, at each school, so this did not influence the results.
Finally, as noted on p. 32, the Communication Trust’s SLCPTs do not provide for standardisation of a child’s test scores in relation to their specific age. This was a disadvantage in a design where the pupils on average as a cohort fell in the middle of the age range for the 5-6 year tool at wave 1, and were therefore still only in the middle of the age range for the 7-8 year tool at wave 3.
Rigour of sample selection
The UEL study approximates to the randomised control trial that Dr Barnes recommended in 2015. The children were reasonably randomly distributed between conditions after meeting the criteria for participating in ‘‘Speech Bubbles’’, although some school staff understandably put children in greater need forward first for the intervention, despite being asked to allocate randomly. This is reflected in the lower baseline scores for the original ‘Speech Bubbles’ cohort in wave 1.
It would be possible to match children on their baseline scores and on other variables such as gender, age, ethnicity and home language, and then allocate matched pairs to each condition. In this study, the researchers obtained the
demographic data from the schools. The rigour of the data obtained about ethnicity and language spoken at home could be increased by speaking directly with parents and carers at the point of commencement of the study. However, ‘ethnicity’ and ‘language spoken at home’ are also less clearly defined categories than gender and age and it is possible that some parents and carers might be reluctant to state that a language other than English was spoken at home. One cannot therefore conclude much about the lack of statistical significance found in relation to home language. Finally, this is a randomised control trial conducted ‘in the field’, and there are limits to what is possible or desirable in relation to rigorous matching.
Ethical conduct, procedure and analysis of the results
As noted on p. 6, the study obtained approval from the University’s Research Ethics Committee and obtained fully informed consent from both parents and carers, and children. Throughout the screening, the research students were friendly and relaxed and had procedures for pacing or stopping the screening should children become reluctant or distressed. In fact, no children became distressed and only two children refused to continue with screening or to attend on another occasion. Children were screened before and after the intervention in a reasonably standardized way, using the same progression tool. Screening and scoring were conducted ‘blind’. With regards to analysis of the results, we noted on p. 13 that the statistical approach used in this study is one particularly suited for ‘field’-based design, where rigorous sample selection for each condition may present some challenges.
Conclusion and recommendations
The Aims of the UEL Evaluation
The UEL study asked:
• Does taking part in ‘Speech Bubbles’ make a positive difference to children’s speech, language and communication development?
• If so, is this difference statistically significant? That is, can it be reliably attributed to the effect of the ‘Speech Bubbles’ intervention alone?
The UEL study was commissioned to address the recommendation of the All-Party Parliamentary Group on Speech and Language Difficulties (APPG, 2013) that interventions designed for disadvantaged pupils with SLCN be underpinned by robust evidence of their effectiveness. The London Bubble Theatre Company aims to
achieve validation for the ‘Speech Bubbles’ programme at ‘Standard of Evidence 3’, as assessed by the Project Oracle Children and Youth Evidence Hub. Standard 3 requires that a project:
“…has undertaken evaluation that draws a consistent link between the project and the change in outcomes, indicating that the project has caused the observed changes… There has been at least one rigorous evaluation using a comparison group or other appropriate comparison data, ideally with long term follow up.1”
The UEL evaluation of the effectiveness of the ‘‘Speech Bubbles’’ Drama Intervention Programme has demonstrated that taking part in ‘Speech Bubbles’ does
make a positive difference to children’s speech, language and communication development. Our study has shown that ‘Speech Bubbles’ has a particular proven, statistically significant impact on children’s spoken language, storytelling and social interaction, giving children a marked boost in these areas of SLC competence.
1(www.project-oracle.com/support/validation/standard-3/, Accessed on
29/11/17)
It is in the three areas of ‘Understanding Spoken Language’, ‘Storytelling and Narrative’, and ‘Social Interaction’ that ‘Speech Bubbles’ really assists children to shine. The original cohort of ‘SB’ children outstripped the ‘control’ children in these areas even though they started each time from a lower baseline. Their lively
approach to these questions in July 2016, as much as the scores they obtained, was suggestive of a change in the way they viewed themselves. They appeared as more competent storytelling subjects, with a more confident perspective on their personal worlds.
We can therefore conclude that ‘Speech Bubbles’ is a highly valuable intervention with proven impact.
Recommendations
In many respects, this study has been a pilot, designed to test the feasibility of undertaking further research into the effectiveness of ‘Speech Bubbles’, using a design that approximates as near as possible to a randomised control trial. In relation to future research commissioned by the London Bubble Theatre Company, we would recommend the following:
• That the design incorporate longer-term follow-up of the children who have participated in the programme, to see if children maintain the gains made, beyond the end of the first year after the programme.
• That the London Bubble Theatre Company commissions a cost-benefit analysis of the impact of the ‘Speech Bubbles’ programme.
A final note
We would finally like to note that many of the pupils participating in the ‘Speech Bubbles’ programme are made vulnerable by a range of psychosocial factors associated with poorer outcomes in speech, language and communication
development. These include poverty, associated links to ethnicity, and, to a certain extent, gender. Although the children’s scores have improved markedly, the mean scores are only just approaching the ‘green’ (