Accepted Manuscript
Towards Energy-efficient Retrofit of Council Housing in London:
Assessing the Impact of Occupancy and Energy-Use Patterns on
Building Performance
Sahar Zahiri , Heba Elsharkawy
PII:
S0378-7788(18)30622-4
DOI:
10.1016/j.enbuild.2018.07.010
Reference:
ENB 8679
To appear in:
Energy & Buildings
Received date:
24 February 2018
Revised date:
29 May 2018
Accepted date:
3 July 2018
Please cite this article as: Sahar Zahiri , Heba Elsharkawy , Towards Energy-efficient Retrofit of
Coun-cil Housing in London: Assessing the Impact of Occupancy and Energy-Use Patterns on Building
Performance,
Energy & Buildings
(2018), doi:
10.1016/j.enbuild.2018.07.010
ACCEPTED MANUSCRIPT
1
Highlights
Evaluating council housing building performance and occupants’ energy use behaviour
Effects of occupants’ energy use behaviour on building’s energy efficiency
The impact of indoor environmental conditions on thermal comfort and energy use
Importance of energy and occupancy patterns in feasible energy use predictions
ACCEPTED MANUSCRIPT
2
Towards Energy-efficient Retrofit of Council Housing in London: Assessing the Impact of
Occupancy and Energy-Use Patterns on Building Performance
Sahar Zahiri¹* and Heba Elsharkawy¹
School of Architecture, Computing and Engineering, University of East London, University Way, London, UK, E16 2RD *[email protected], [email protected]
Abstract
This study investigates an energy-inefficient council housing tower block in London, due for retrofit, by exploring the correlations between occupancy and energy consumption patterns, thermal comfort and building energy performance in the winter. The aim of this study is to evaluate the building performance and develop a reliable building simulation model to be employed in the second phase of the study for developing an energy-efficient and cost-effective retrofit strategy to support the council’s plans. The research seeks to demonstrate the significance of using dominant occupancy and energy use profiles as opposed to relying on standardised profiles when calculating building energy consumption using building simulation software. The paper reports on the results from the first phase of the study where a quantitative methodology; including a questionnaire, structured interviews, indoor monitoring, and building simulation modelling was adopted. The results provide evidence that occupants’ socio-demographic characteristics have a considerable impact on household energy consumption and fuel bills. The results also show that indoor environmental issues experienced in many flats are partly attributed to the thermally inefficient building envelope and partly due to occupants’ patterns of operating their homes with evidence of excessive heating energy use in attempts to alleviate the indoor issues experienced.
Keywords: Building performance, retrofit, energy efficiency, energy use behaviour, thermal comfort, social housing
1.
Introduction and research context
Improving energy efficiency of buildings is one of the UK government’s targets to mitigate greenhouse gas
(GHG) emissions informed by the United Nations Intergovernmental Panel on Climate Change (IPCC) and the
International Energy Agency (IEA) [1]. Energy efficiency in the domestic sector has also been the focus of much
research in recent years due to its significant impact on carbon emissions [2]. Energy consumption in the UK housing
sector accounts for 29% of the total Carbon Dioxide (C ) emissions production [3], where two thirds of this energy is
used for space heating. Enhancing the energy performance of residential buildings can significantly contribute to
achieving the UK government plans in carbon emissions reduction of 80% by 2050 [4]. It has been asserted that a steady
rate of improvement in energy efficiency of the domestic stock has been achieved nationally between 1996 and 2012,
hence the average Standard Assessment Procedure (SAP) rating of dwellings increased by 14 SAP points from 45 to 59
[5] . This is mainly due to the multiple retrofit programmes delivered by the UK government’s Department of Energy and
Climate Change (DECC) – now the Department of Business, Energy and Industrial Strategy (BEIS) – to improve the
ACCEPTED MANUSCRIPT
3 The UK policies aiming at improving energy efficiency and reducing C emissions from the domestic sector
have undergone significant changes in recent years including programmes that have been run by local authorities and at
community levels [6, 7]. One of the successful programmes delivered is RE:NEW programme, introduced in 2009 to
reduce carbon emissions and energy bills of London’s domestic sector [8]. The main approach of RE:NEW programme
is to find ways to cut energy bills by improving the building performance of the domestic sector to tackle fuel poverty [9]
(households spending more than 10% of their income on heating energy services are considered to be in fuel poverty
[10]). Based on the UK BEIS [11], 11 % of households in England were in fuel poverty In 2017, at around 2.5 million.
This is a significant number as occupants struggle to keep their homes warm whilst not achieving indoor thermal comfort
during the cold winters, which may exacerbate the quality of life and cause health issues. RE:NEW scheme supports
London boroughs and housing associations to develop and complete retrofit projects to help mitigate fuel poverty and
achieve carbon emissions reduction targets [8]. So far, at least 127,000 residential buildings in London have been
improved, which in turn, contributes to saving 46,000 tonnes C Emissions annually [8]. Retrofit schemes have a
significant impact on reducing domestic energy use hence achieving economic benefits from the reduced energy costs
[12, 13]. However, retrofit programmes also require wider engagement to generate positive and effective uptake and
delivery for both, providers and end users, which can be achieved if programmes are adequately promoted. A survey of
500 households in Kirklees Warm Zone (KWZ) scheme in England confirms that promoting retrofit schemes effectively
particularly by a trusted provider, may enable wider participation and uptake [6].
In addition, retrofitting domestic buildings helps improve health and comfort of occupants besides meeting the
energy and fuel poverty reduction targets [6]. As a result of the thermal and economic benefits of retrofits, energy loads
for space heating and thermal comfort levels in cold seasons have been the focus of research in the UK [14]. However,
many studies have found that the benefits from retrofitting can be compromised through shortfalls in the building
performance where achieved benefits may not necessarily resonate with the expected outcomes of the interventions [15,
16]. One of the challenges for retrofit is adopting the most appropriate retrofit approach, which ensures the optimum
thermal comfort of occupants and improved energy performance for particular building prototype [17]. The extent of
energy required to achieve the satisfactory level of comfort also varies from one building to another across various
building typologies [18, 19] and consequently might be different to the national average [7]. This is partly due to the
physical characteristics of a building as well as occupants’ energy consumption behaviours and occupancy patterns,
which play an important role in building energy load [20].
Energy consumption of buildings may not be significantly reduced by energy upgrade alone, particularly in areas
ACCEPTED MANUSCRIPT
4 [21]. Studies assert that occupants’ energy consumption behaviour and socio-demographic factors may have a significant
impact on the intensity of energy used in buildings [22].The intensity ofenergy consumption is highly associated with
the energy use patterns related to occupants’ presence within the buildings [23] and one of the main factors of uncertainty
in predicting the building performance is occupancy and energy use schedules associated with energy consumption [22–
25]
.
According to Song et al. [26], there are a few barriers to predicting the building energy performance usingoccupants’ energy use data. These include occupants’ diverse demographic and socio-economic characteristics as well as
the different energy consumption patterns adopted either to achieve comfortable indoor environments or to reduce the
intensity of indoor environment issues such as damp and mould. Taking account of occupancy and energy use profiles in
energy simulation supports realistic building energy performance calculations. However, there is a lack of consensus
regarding approved methodologies of occupants’ energy use patterns to be incorporated into building simulation tools
[27, 28]. Another study [29] investigated the effect of occupancy schedules and users’ behaviour on the energy
consumption of a building in order to define an approach for building simulation. In this study, the occupancy patterns of
more than 3400 Belgian households studying the detailed activities of around 6500 occupants where seven occupancy
profiles, with three states, were defined to be used in the simulation tools. These states are; “home and awake”,
“sleeping” and “absent”. However, it was found that these schedules were quite general and far too simplistic to be
applied to the simulation modelling and that there is a lack of information regarding the interaction between the
occupants and the internal spaces during specific periods not included in the three defined states. Ahmed et al. [23] also
investigated the occupancy profiles, and schedules for lighting and appliances and inputs data to building energy
simulation to develop new energy calculation methods. The identified profiles were applied to 10 different building
typologies, which include one to three space categories, including weekdays and weekends that are then applied to the
simulation tools. The space categories were used to group the similar rooms to a larger zone, where possible, for a
quicker simulation analysis. The hourly occupancy, appliances and lighting patterns were also presented to study the
effect of occupants’ behaviour on cooling and heating energy use. The study showed that using the actual average hourly
patterns in the simulation tool increased the peak energy loads of the buildings between 12% and 30%, which is realistic,
and highlights the importance of realistic hourly schedules for different building typologies. Song et al. [26] also
examined how occupancy-related behaviours have significant impact on the prediction of building energy performance.
A prediction model was created to adopt the building thermal behaviour and to apply representative end-user groups. The
model provided more insight into the daily peak energy demand, daily energy use, as well as general energy use patterns
which showed that the occupants’ energy-related behaviours provide more accurate predictions of building energy
ACCEPTED MANUSCRIPT
5 The current study evaluates the building performance of one of the typical social housing tower blocks in London
Borough of Newham (LBN), which is planned for retrofit in the short term. In LBN, there is a high rate of fuel poverty at
13.8%, with 13,372 households suffering, which is among the highest rates in the UK [30]. Hence, LBN Council has set
a plan to significantly reduce the number of tenants affected by fuel poverty whilst achieving minimum energy
efficiency standards (SAP) of B and C by 2030 for the social and private housing [10]. Improving the energy efficiency
of these buildings in the borough has proven to significantly cut energy bills in the domestic sector for both council and
private stock [5, 30]. Concerning the research case study, initial field surveys conducted by LBN’s Community and
Infrastructure team in 2016 highlighted significant damp and mould issues in at least one quarter of the tower block flats
which affected the occupants’ thermal comfort and caused an increase in heating energy demands in the winter months
[31]. This study investigates the interactions between the building performance, occupants’ energy consumption
behaviour, and thermal comfort in the winter months, and occupants’ socio-demographic characteristics. The aim is to
explore feasible occupancy and energy consumption profiles to be applied to the building simulation model that will help
explore energy-efficient and cost-effective retrofit strategies for this particular building and similar prototypes in the
second phase of the study. Considering realistic and dominant occupancy and energy use patterns in building energy
simulation analysis may yield reliable outputs for retrofit interventions [32] and may help reduce the gap between the
predicted and the actual building energy performance [33].
2.
Research methodology
The research project is undertaken over two phases; the first phase of the project, the focus of this paper, is the
building performance evaluation to identify the current energy performance of the building and develop a reliable
building simulation model for the second phase. This includes understanding the underlying causes of the issues reported
from occupants; mainly high energy bills and issues with indoor thermal comfort. The study adopts a quantitative
research design based on a survey questionnaire, structured interviews, indoor monitoring, and dynamic simulation
modelling. The questionnaire seeks to understand the correlations between the occupants’ energy use patterns, the indoor
environment issues experienced and the heating energy use in the winter season to identify the dominant occupancy and
heating energy use profiles that can be adopted in the building simulation model. Exploratory sample flats are identified
from the questionnaire results, as well as from the water ingress survey undertaken by LBN, as representative flats with
dominant occupancy and heating energy use schedules for the subsequent indoor environmental monitoring and
structured interviews. The monitoring of indoor air temperature and relative humidity (RH) levels of the case studies
provides an in-depth investigation of the indoor environment conditions and validates the questionnaire results and
ACCEPTED MANUSCRIPT
6 interviewed to gain more insight into their occupancy and energy use patterns. This detailed information is then used in
the dynamic simulation modelling using DesignBuilder (DB) software to provide in-depth understanding of the impact of
different energy use and occupancy profiles on building energy performance and how this should be considered for
appropriate retrofit delivery.
2.1. Research case study
The research case study is a 22-storey tower block in London Borough of Newham constructed in 1966 and
consists of 108 one-bedroom and two-bedroom flats [31]. The building construction is in-situ reinforced concrete frame
with floor slabs spanning between shear walls, and pre-cast concrete panels covering the flank wall. The building
envelope is externally fitted with asbestos cement over-cladding panels of 9 mm thickness with a 80 mm air gap between
the cladding and the external wall. The external walls are composed of 200 mm pre-cast concrete panels and 20 mm
internal wall insulation boards and plaster finishes. Internal floors are composed of 150 mm reinforced concrete slabs,
whilst internal partition walls are formed of concrete blocks of 100 mm thickness. Internal walls and ceilings are plaster
finished with no thermal insulation. All flats have double-glazed windows with un-plasticized polyvinyl chloride (UPVC)
frames. Natural gas-fired boilers facilitate heating in the properties by wall mounted radiators. It should be noted that
many of the tenants had reported to the council significant issues within their properties, hence, a water ingress survey of
the tower block was conducted by Newham Council in 2016. It was found that around 50% of the surveyed properties
experienced damp, mould and condensation, where 84% of the affected properties experienced these issues in the master
bedrooms while the remaining flats have some problems in the living rooms. The occupants of these properties also
complained about the noticeable increase in their heating energy bills since they started noticing those issues [34]. The
initial studies found that as the external over-cladded facades were jet-washed in 2012, this may have damaged the
external building envelope [31]. As a result of this damage, the moisture may have transferred through gaps and cracks
within the building envelope and caused damp and mould problems within the flats [35]. In order to tackle the problems
and improve the energy efficiency of the building, Newham Council had planned to retrofit the tower block in the short
term.
2.2. Field studies
A questionnaire-based survey, structured interviews and indoor environmental monitoring were performed in the
case study during autumn 2016. The questionnaire form consisted of questions related to the occupants’ energy use and
occupancy patterns, quarterly energy bills, indoor issues (such as damp, mould, cold, etc) and the socio-demographic and
economic characteristics of the households (Table 1). Overall, 108 questionnaires were distributed to occupants of all
flats. A door-to-door approach was employed during the data collection period to maximise the response rate. The results
ACCEPTED MANUSCRIPT
7 two exploratory sample flats which are characterised by having the (highest and lowest) dominant occupancy profiles,
both had relatively high energy bills, and experienced similar issues with their indoor environment.
Table 1. Questionnaire sections and questions
Section Question areas
Section 1
General household information
number and type of rooms,
main and secondary heating systems,
type of glazing and doors,
number and type of electric appliances owned
Section 2
Home energy use and performance
heating trends, heating controls available and frequency of use
problems experienced (draught, cold, etc),
utility bills paid
whether they received energy advice Section 3
Lifestyle and behaviour lifestyle pattern environmental actions
Section 4
Socio-demographic information
demographics of the household
education
employment activity
income
health status
The structured interviews were then conducted with the occupants of the sample flats in autumn 2016 [36]. The aim
of the structured interviews was to seek further details specific to the sample flats including the occupants’ experience
with their indoor thermal environment, the occupancy and energy consumption patterns for each room as well as their
lifestyles.The questionnaire, water ingress survey and interview results indicated that the problems regarding thermal
comfort and indoor environment issues mainly occurred in the master bedrooms and in some cases the living rooms. The
indoor air temperature and RH levels of the representative flats (in this case named flat A and flat B) were monitored
during winter 2016-2017 using data loggers to evaluate the indoor environmental conditions. Both flats are located in the
[image:8.595.115.488.139.282.2]middle floors of the south-east corner of the tower block and have identical floor plans (Figure 1).
Figure 1. Typical floor plan of the tower block and floor plan of the sample south-east flats including the location of data loggers in the measured rooms [37] (colour print)
It was found that although the occupants’ energy consumption behaviours and lifestyles are different, both flats
had the same problems with the building envelope in the same zones where the occupants expressed concerns about
potential health implications associated with these issues. The physical monitoring provides a feasible means for
[image:8.595.61.418.469.638.2]ACCEPTED MANUSCRIPT
8 validating occupants’ experience by collecting indoor environmental data to highlight issues regarding the indoor thermal
comfort in the sample flats. The data loggers were placed in the problematic master bedrooms and non-problematic
second bedrooms to compare the measured data in two different locations. It should be noted that the monitored data
were also used to calibrate and validate the accuracy of the building simulation model. The calibration method focused
on comparing the measured and the simulated indoor air temperature and RH levels on the hourly basis in the winter
season. Highly sensitive data loggers were fitted in each bedroom with the logging intervals of 15 minutes to collect the
indoor environment data via its integrated sensors. The data loggers were located away from any internal heat sources
(i.e. radiators, televisions, etc.) and direct solar radiation to record indoor environmental data. The air temperature
sensor’s accuracy is ±0.21°C while the relative humidity sensor’s accuracy is between ±2.5% and ±3.5%.
Furthermore, the household heating energy demands of the flats were obtained from the energy bills covering the
monitored period (December 2016 - March 2017) to help assess the energy demand and estimate the overall energy
consumption of the flats during the winter season. The occupancy and energy consumption patterns of these flats are then
each applied to the building simulation model to calculate the maximum and minimum energy use of the tower block
with the dominant and representative high and low occupancy patterns of the whole tower block. Applying the dominant
energy use and occupancy profiles in the building simulation modelling is used to calibrate the building performance
prediction and help provide a feasible retrofit proposal in the subsequent phase of the study.
2.3.Building simulation modelling
In addition to the indoor monitoring, the energy performance of the sample properties (flats A and B) was
studied using dynamic simulation modelling, Design Builder software (DB). This has been applied as a data triangulation
method alongside the other forms of data collected to provide more in-depth understanding of the correlation between the
heating energy use of the building and the occupants’ lifestyle and energy consumption patterns. The specifications of the
construction materials of typical 1960s council housing tower blocks in London and in the UK were matched to the
research case study and adopted to develop a feasible simulation model as there has not been detailed specifications
available concerning the building materials of this particular tower block. The typical U-values for this type of building
in the 1950s/1960s have been used in the dynamic thermal modelling of the building. Those are 0.78 W/ for external
walls, 1.82 W/ for internal floors, 0.28 W/ for roof, 2.67 W/ for glazing, 2.82 W/ for internal doors
and 2.93 W/ for internal partitions [38– 40]. To validate the building simulation results, the outdoor weather data
obtained from the UK Meteorological Office (Met Office) for Gravesend weather station (nearest weather station to the
building location) have been incorporated in the hourly weather file of the DB model, along the actual schedules for
ACCEPTED MANUSCRIPT
9 calibrated against the physical monitoring data collected from the flats. In this case, the focus is on the coldest week of
the winter season in 2016-2017, from 17 to 23 January 2017.
The actual schedule for heating, ventilation, lighting, DHW and occupancy patterns of the flats as two dominant
low and high occupancy profiles with relatively high energy use schedules (Flat A and Flat B respectively) were applied
to the DB model to produce feasible estimates of the building energy consumption during the winter season. In this study,
the building performance using the dominant occupancy and energy use profiles was also compared against the building
performance using CIBSE technical memorandum 59 (TM59) occupancy patterns and Standard Assessment Procedure
(SAP 2012) energy use patterns. CIBSE TM 59 is a newly developed guideline for the assessment of overheating risk in
new and refurbished dwellings [41] while SAP 2012 is the UK government’s procedure developed for the energy rating
of dwellings [39]. Those patterns were applied to the DB model to examine the impact of the different profiles on
building performance evaluation results. As the subsequent phase of this study is to determine an energy-efficient retrofit
strategy, overheating risk will form one of the main concerns of the study.
3.
Results and discussion
The following sections discuss the results and analysis of the data collected from; the survey questionnaire,
interviews, indoor monitoring, and dynamic simulation modelling.
3.1. Questionnaire-based survey
Out of the 108 questionnaire forms distributed to all the tower block flats; 32 completed forms were collected for
data input and analysis via the Statistical Package for the Social Sciences (SPSS). The response rate is 30% which is an
acceptable rate and can produce representative results [42]. It has been recommended that in order to run valid Pearson,
Kendall and Spearman correlation tests, the sample set needs to be equal or superior to 25 [43–45]. The questionnaire
explored the issues affecting home energy performance such as housing conditions, energy use patterns, energy use
behaviour and the occupants’ socio-demographic background. The socio-demographic status of the occupants indicate
that 31% of the properties are occupied by a single occupant (low occupancy), while 31% of the properties are occupied
by four to seven people (moderate to high occupancy) and the remaining properties are occupied by two or three people,
22% and 16% respectively. One of the main reasons for the council’s energy retrofit plan of this particular case study is
the occupants’ economic status that has also been confirmed by the questionnaire. Around 34% of the respondents are
part-time employed or unemployed and the income level of 58% of the total households is below £12K per annum while
only 10% of the households income is more than £20K [46]. Figure 2 shows the quarterly electricity and gas bills of the
ACCEPTED MANUSCRIPT
10 in the winter months for gas while 67% pay the same amount for electricity. Based on the survey results and correlations,
more than half of the households find themselves paying more than 10% of their annual income on energy bills that can
lead them to fuel poverty.
Figure 2: Quarterly gas and electricity bills of the properties in the winter season from Dec 2016 until March 2017
In addition, the questionnaire focused on the heating energy consumption behaviour of the occupants in the winter
months. Table 2 presents several relevant correlations from the survey. The results demonstrate that there is a correlation
between the age of the occupants and the heating energy use in the surveyed properties. It can be seen that as the age
band of the occupants increases, less heating energy is used in the winter season. However, there is a strong correlation
between the members of the households with children and the number of hours that heating is on (r = 0.412, p <0.01).
The households with children also tend to spend more on energy bills, while the households with 65 years and above tend
to spend less on their bills. The value of gas bills also moderately correlates with the economic status of the family
members (r = 0.306, p <0.05) but strongly with the number of occupants per flat (r = 0.306, p <0.01). According to the
survey results, 47% of the respondents thought they paid more on energy bills to provide a comfortable indoor
environment whereas 22% mentioned they used more heating energy to provide a comfortable indoor environment for
their children, while 22% used more heating energy to reduce the housing issues such as damp, mould and condensation.
Table 2: Correlations between the age, number of occupants, damp and mould issues and energy use
12
22
37
13
3
13
19 22
29
12
9 13
£ 5 0 - £ 9 9 £ 1 0 0 - £ 1 4 9 £ 1 5 0 - £ 1 9 9 £ 2 0 0 - £ 2 4 9 £ 2 5 0 - £ 2 9 9 £ 3 0 0 A N D M O R E
Electricity Gas
Quarterly Bills
%
Quarterly Gas Bill Payments Correlation Coefficient Members of household with children .359*
Members of household 65yrs or over -.276*
Number of occupants .306**
Economic status of each family member .306*
Experiencing damp Correlation Coefficient
Gas bills .626**
Experiencing Condensation Correlation Coefficient
Gas bills .379*
Hours heaters on Correlation Coefficient Members of households with children .412**
ACCEPTED MANUSCRIPT
11 There appeared to be a strong and positive correlation between the issue of damp and the heating energy bills (r=0.626,
p<0.01), while a moderate correlation between condensation and heating energy bills (r= 0.0379, p< 0.05) which are also
confirmed by the occupants of both sample flats (Table 2).
3.2. Structured interviews
According to the questionnaire-based survey undertaken in this study and water ingress survey by LBN, flat A and
flat B have been selected as representative sample flats with significant indoor issues, high energy use profiles, and
represent the dominant lowest and highest occupancy patterns within the tower block. Flat A is occupied by a single
elderly occupant, while flat B is occupied by a young family of five including three children. As explained in section 3.1,
around one third of the surveyed properties are occupied by a single occupant, while one third of the flats are occupied by
young families with children. Both flat occupants also felt they tended to use more heating energy to reduce thermal
discomfort caused by damp, mould and condensation. Structured interviews were conducted with the occupants of both
sample flats in order to gain further details concerning the energy use and occupancy patterns of each room within the
flats as well as the occupants’ lifestyles concerning energy use. This information is then applied to the building
simulation model for evaluating the building performance. Interviews with the occupants demonstrated that they each
have different lifestyles, schedules for ventilation, heating, lighting and DHW usage, which subsequently has a direct
impact on the indoor air temperature and RH levels, as well as the energy consumption of each property. According to
the interviews, as demonstrated in Table 3, flat A occupant, an elderly person, keeps the heating off in both bedrooms
whilst keeping the heating on from 8:00 am until 10:00 pm in all other zones of the flat with the thermostat set at 19 °C.
The occupant also never opens any windows during the winter season for ventilation purposes. On the other hand, flat B,
occupied by a family of two adults and three children, always turn the heating on from 8:00 pm until 7:00 am in both
bedrooms with the thermostat temperature at 25°C, whilst heating is turned off in all other zones in the flat during a
typical winter day. Both bedrooms are usually naturally ventilated for at least one hour every day during the winter
season. Flat B occupants also stated that due to the indoor air temperature in their flats not being within their comfort
level, they felt they had to keep the heating system switched on overnight to help reduce the impact of the cold, mould
and condensation. Table 3 summarises the actual occupancy and energy use patterns of the flats that are obtained from
the interview and applied to the building simulation model.
To determine the heating energy use of these flats in the winter season, the quarterly energy bills of the properties
ACCEPTED MANUSCRIPT
12 B is 79 kWh which is 60% higher than flat A at 29 kWh. Based on the survey questionnaire, this can partly be due to the
number of the children in the family (three children) that may require more heating energy to sustain a comfortable
indoor environment, compared to one occupant in flat A, who tended to use less heating energy (Table 3). The following
section discusses the inferences from the results obtained from indoor monitoring.
Table 3. Patterns of occupancy, ventilation and energy use for flats A and B
3.3. Indoor environmental monitoring
The indoor air temperature and RH levels of the master bedroom and the second bedroom of flats A and B were
monitored between December 2016 and March 2017 with data loggers. The data loggers were located in the problematic
and non-problematic bedrooms in order to measure, assess and compare the climatic data in two different locations in
each flat. The monitored data were obtained to help understand the reasons for the indoor environmental issues
experienced as well as the impact on thermal comfort and energy bills. It is recommended that the indoor air temperature
[image:13.595.82.490.185.575.2]of dwellings should be between 17 °C and 19°C in bedrooms in winter accounting for clothing insulation of 2.5 clo [35].
Figure 3 presents the weekly indoor air temperature and RH levels in the master and second bedrooms of both monitored
Room type Flat A Flat B
Master bedroom
Windows Closed 7am to 8am
Door Closed Open
Heating Off 6:00 pm to 8:00am On for extra hours from 12pm or 1pm for 3 h in winter. Occupancy No occupancy 7pm to 7am
Second bedroom
Windows Close 7am to 8am
Door Open Open (when the windows are opened it might be closed).
Heating Off 6:00pm to 8:00am On for extra hours from 12pm or 1pm for 3 h in winter.
Occupancy 10pm to 8am 7pm to 7am
Kitchen
Windows Close Small window is always open. Door Open Open (during cooking might be closed)
Heating 8am to 10pm Off
Occupancy 1/2h at 8am, at 12:30pm and at 5:00pm 1h at 6:30am, at 12:30pm and at 6:00pm
Washing Machine Every day- Using liner or dryer to dry the clothes 3-4 times a week normally weekends- Using dryer or radiator to dry the clothes Extractor fan On when required On when required
Living room
Windows Close Close
Door Close when heating is on Open
Heating 8am to 10pm. Off
Occupancy 8am to 10pm 8am to 10pm
Bathroom
Windows N/A N/A
Door Open for one hour after taking shower Open for 1h after taking shower
Heating 8am to 10pm Off
Occupancy
ACCEPTED MANUSCRIPT
13 flats. In flat A, the monitored air temperature of the master bedroom was usually below the comfort range, due to the
room not being occupied (the occupant used the second bedroom instead). However, although the heating was normally
switched off, the indoor air temperature was found to be within the comfort band in the second bedroom (east facing). In
addition, the monitored results of the indoor air temperature in the bedrooms of flat B were usually within or above the
acceptable comfort level in the winter occasionally reaching 25°C, the maximum comfort band with summer clothing
value of 1 clo [35]. This is because the heating was normally turned on in this flat daily from 6pm for around 13 hours as
well as three hours during the middle of the day from 12 noon in the cold season in an attempt to reduce the effect of
condensation and dampness and keep the indoor air temperature within the acceptable comfort range. As for the RH
levels, it was found that the RH in all bedrooms was within the comfort range between 40% and 70%, which is
acceptable for sedentary occupancy [47]. The results confirm that for both flats, the indoor thermal environment in the
winter has been consistently kept within the thermal comfort range albeit, at the expense of high energy bills. The
subsequent section discusses the results from the building modelling and simulation.
Figure 3. Weekly mean indoor air temperature (left) and indoor RH levels (right) against outdoor climatic variables in the master and second bedrooms in flats A & B (colour print)
3.4. Building Simulation Analysis
3.4.1. Evaluating the building performance of the sample flats
Building energy and thermal modelling and simulation have been undertaken using DesignBuilder software (DB)
to validate the monitored data against the simulation results. The aim is to develop a viable model to be adopted for the
second phase of the study concerning building performance optimisation by energy-efficient retrofit. DB is an advanced
building simulation tool that has been validated for dynamic thermal modelling of large and complex buildings [48]. The
software uses EnergyPlus dynamic simulation engine for the simulation analysis. The focus of the study at this stage is
on the coldest week in the winter season (17-23 January 2017) to predict the maximum heating energy use. The tower
block was modelled in DB using the building materials of typical concrete tower blocks built in the UK in the 1960s (as
0 2 4 6 8 10 12 14 16 18 20 22 24 26 28 30 2 D ec -8 D ec 9 D ec -15 D ec 16 D ec - 22 D ec 23 D ec -29-D ec 30 D ec - 5 Ja n 6 Ja n- 12 Ja n 13 Ja n- 19 Ja n 20 Ja n- 26 Ja n 27 Ja n- 2 Fe b 3 fe b- 9 Fe b 10 F eb - 1 6 Fe b 17 F eb - 2 3 Fe b 24 Fe b-2 M arc h 3 M arc h- 9 M arc h 10 M arc h- 16 M arc h 17 M arc h- 23 M arc h A ir Te m pe ra tur e °C
Flat B- Small bedroom Flat A- Small bedroom Flat B- Master bedroom Flat A- Master bedroom Outdoor air temperature Min Comfort Max Comfort Weeks 0 10 20 30 40 50 60 70 80 90 100 2 De c-8 D ec 9 D ec -15 D ec 16 D ec - 22 D ec 23 D ec -29-D ec 30 D ec - 5 Ja n 6 Ja n- 12 Ja n 13 Ja 1 9 Ja n 20 Ja 2 6 Ja n 27 Ja n- 2 Fe b 3 fe b- 9 Fe b 10 Fe 16 Fe b 17 Fe 23 Fe b 24 Fe b-2 M arc h 3 M arc h- 9 M arc h 10 M arc h- 16 M arc h 17 M arc h- 23 M arc h R el at iv e Hum id ity L ev el s %
Flat B- Small bedroom Flat A- Small bedroom Flat B- Master bedroom Flat A- Master bedroom Outdoor RH Min Comfort Max Comfort
ACCEPTED MANUSCRIPT
14 described in section 2.3). The actual heating, ventilation and occupancy patterns of the sample flats A and B were each
incorporated into the model. The Met Office outdoor environmental data for Gravesend weather station (nearest weather
station to the building location) was used as the climatic weather file in DB, in order to create a feasible model with
realtime outdoor climatic data [41]. In order to calibrate the building performance, as well as the building materials and
components adopted in the model, the measured indoor environment data were scrutinised in conjunction with DB
simulation results. Figure 4 illustrates the monitored indoor air temperature and RH levels against DB simulation results
during the coldest week of the winter season. It can be seen that the percentage variation in indoor air temperature is
between 5% and 15% which has been asserted as acceptable variation [49]. However, the monitored indoor RH levels
appeared generally higher in all bedrooms compared to DB results and exceeded the recommended percentage of
variation at times (Figure 4). This may be associated with the occupants’ lifestyles besides the hygrothermal issues
observed in the master bedrooms. As flat B is occupied by five occupants including three children where the bathroom
and kitchen are used more often throughout the day, this may have resulted in increased RH levels in all rooms as the
doors are usually left open (kitchen door closed only when cooking). In flat A, the bathroom and washing machine were
used regularly during the day, which may also explain the slight increase in the monitored RH data compared to DB
results. It should be noted that these activities cannot be controlled in the energy model, hence may have an impact on the
simulation results.
Figure 4. Indoor monitored air temperature (left) and RH levels (right) against DB simulation of flats A and B bedrooms
(colour print)
Studies show that consistent damp leads to mould growth on the internal building surfaces and reduces the
effectiveness of thermal insulation [50] which appears to be the case in this study. Occupants’ lifestyles also add to the
complexity of maintaining indoor comfort levels. For example, showering a few times a day in flat B while the shower is
only used once a day in flat A, using the washing machine and sometimes using the radiators to dry the washing every 10 15 20 25 30 01/ 17/ 17 12: 00 A M 01/ 17/ 17 05: 00 A M 01/ 17/ 17 10: 00 A M 01/ 17/ 17 03: 00 PM 01/ 17/ 17 08: 00 PM 01/ 18/ 17 01: 00 A M 01/ 18/ 17 06: 00 A M 01/ 18/ 17 11: 00 A M 01/ 18/ 17 04: 00 PM 01/ 18/ 17 09: 00 PM 01/ 19/ 17 02: 00 A M 01/ 19/ 17 07: 00 A M 01/ 19/ 17 12: 00 PM 01/ 19/ 17 05: 00 PM 01/ 19/ 17 10: 00 PM 01/ 20/ 17 03: 00 A M 01/ 20/ 17 08: 00 A M 01/ 20/ 17 01: 00 PM 01/ 20/ 17 06: 00 PM 01/ 20/ 17 11: 00 PM 01/ 21/ 17 04: 00 A M 01/ 21/ 17 09: 00 A M 01/ 21/ 17 02: 00 PM 01/ 21/ 17 07: 00 PM 01/ 22/ 17 12: 00 A M 01/ 22/ 17 05: 00 A M 01/ 22/ 17 10: 00 A M 01/ 22/ 17 03: 00 PM 01/ 22/ 17 08: 00 PM 01/ 23/ 17 01: 00 A M 01/ 23/ 17 06: 00 A M 01/ 23/ 17 11: 00 A M 01/ 23/ 17 04: 00 PM 01/ 23/ 17 09: 00 PM
Flat B- Small bedroom- Monitored Flat A-Small bedroom-Monitored Flat B- Small bedroom-DB Flat A- Small bedroom-DB Flat B- Master bedroom-Monitored Flat A- Master bedroom-Monitored Flat B- Master bedroom-DB Flat A- Master bedroom-DB
Min Comfort Max Comfort
Te m p e ra tu re ° C 30 50 70 90 01/ 17/ 17 12: 00 A M 01/ 17/ 17 05: 00 A M 01/ 17/ 17 10: 00 A M 01/ 17/ 17 03: 00 PM 01/ 17/ 17 08: 00 PM 01/ 18/ 17 01: 00 A M 01/ 18/ 17 06: 00 A M 01/ 18/ 17 11: 00 A M 01/ 18/ 17 04: 00 PM 01/ 18/ 17 09: 00 PM 01/ 19/ 17 02: 00 A M 01/ 19/ 17 07: 00 A M 01/ 19/ 17 12: 00 PM 01/ 19/ 17 05: 00 PM 01/ 19/ 17 10: 00 PM 01/ 20/ 17 03: 00 A M 01/ 20/ 17 08: 00 A M 01/ 20/ 17 01: 00 PM 01/ 20/ 17 06: 00 PM 01/ 20/ 17 11: 00 PM 01/ 21/ 17 04: 00 A M 01/ 21/ 17 09: 00 A M 01/ 21/ 17 02: 00 PM 01/ 21/ 17 07: 00 PM 01/ 22/ 17 12: 00 A M 01/ 22/ 17 05: 00 A M 01/ 22/ 17 10: 00 A M 01/ 22/ 17 03: 00 PM 01/ 22/ 17 08: 00 PM 01/ 23/ 17 01: 00 A M 01/ 23/ 17 06: 00 A M 01/ 23/ 17 11: 00 A M 01/ 23/ 17 04: 00 PM 01/ 23/ 17 09: 00 PM
Flat B- Small bedroom- Monitored Flat A-Small bedroom- Monitored Flat A- Small bedroom- DB Flat A- Small bedroom- DB2 Flat B- Master bedroom- Monitored Flat A- Master bedroom- Monitored Flat B- Master bedroom- DB Flat A- Master bedroom- DB
Min Comfort Max Comfort
ACCEPTED MANUSCRIPT
15 day in flat B, and the regular cooking throughout the day in flat B increase the indoor moisture levels. Although the
bedrooms in flat B are ventilated for at least one hour every day whilst flat A does not normally ventilate, the RH level in
flat B is still significantly higher than flat A. This is also attributed to the number of occupants; where flat B is usually
occupied by at least two occupants at any one time during the day whilst flat A is always occupied by one occupant.
Ultimately, the simulation demonstrated that the DB model could be used as a reliable model for the next stage of this
study concerning energy retrofit strategies.
3.4.2. Energy performance of the tower block using dominant and standardised occupancy and heating profiles
Following the in-depth exploratory study of the two sample flats, and calibrating DB simulation results against
monitored data, the heat balance and energy consumption of the tower block were calculated for the first, middle and top
floors and consequently the whole tower block during the coldest week of winter. It is worth noting the ground floor has
not been analysed as it includes the entrance lobby, caretaker office, storage space, refuse room and other auxiliary rooms
as well as private garages. To carry out building energy simulation, the occupancy and energy-use patterns are the
important parameters to be set in the simulation model for feasible calculations. Occupants’ energy consumption
behaviour and lifestyle can increase or decrease the building total energy use and can cause significant variations in
energy consumption. According to Steemers and Ben [51], the household energy-use scenario (e.g. SAP 2012) can vary
between two and three times compared to the actual energy use, due to different behavioural patterns of occupants and
calculation assumptions. Although there is a strong focus on building performance and thermal characteristics to design
and deliver low-energy buildings, there are not many studies concerning standardised UK domestic occupancy and
heating patterns accounting for different lifestyles and energy use behaviours. An extensive study conducted on
occupancy and heating patterns shows there is a lack of information available on the UK’s domestic occupancy and
heating patterns to generalise a set of categories to apply to the building simulation for each building type considering the
various lifestyles and the energy-use behaviours [24].
To ensure feasible building simulation calculations for energy efficiency and thermal performance, it is crucial to
apply and test the most dominant schedules for heating and occupancy, which can be used to represent the dominant
socio-demographic profiles of a case study. In the current study, to consider the impact of the occupants’ energy
consumption behaviour on energy loads of the sample flats, three specific schedules have been applied to the simulation
model concerning energy and occupancy patterns; CIBSE TM 59 and SAP 2012 (Table 4), flat A, and flat B scenarios
ACCEPTED MANUSCRIPT
[image:17.595.79.494.94.167.2]16 Table 4. The occupancy and heating patterns of TM 59 and SAP 2012 as the standardised patterns
Scenarios Occupancy Patterns (TM 59) Heating Patterns (SAP 2012)
TM 59 & SAP 2012
Living room 75% occupancy from 9am to 10pm Weekdays: Heating on from 7am-9am and 4pm-11pm Weekends: Heating on in all rooms from 07:00-23:00 Bedroom 70% occupancy from 11pm to 8am
Full occupancy from 8am to 11pm Weekdays: Heating on from 7am-9am and 4pm-11pm Weekends: Heating on in all rooms from 07:00-23:00 All other
rooms 25% occupancy from 9am to 10pm Weekdays: Heating on from 7am-9am and 4pm-11pm Weekends: Heating on in all rooms from 07:00-23:00
CIBSE TM 59 occupancy profile along with the SAP 2012 heating patterns were applied as one of the standardised
scenarios to compare the building performance prediction using a standardised occupancy and heating patterns against
the high and low dominant patterns of the case study in DB. Flat A scenario is a typical occupancy and heating patterns
of a single occupant whereas flat B patterns is a typical scenario for moderate to high occupancy and heating of a family
with children in the case study tower block.
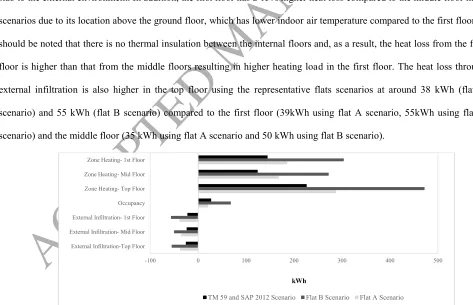
Figure 5 illustrates the predicted heat gain and heat loss in the first, middle and top floor of the tower block using
the three scenarios in the coldest week of the measured period (17-23 January 2017). As illustrated, the simulated heating
load of the top floor is around 40% higher than that of the middle floor in all scenarios as more heat is lost from the roof
slab to the external environment. In addition, the first floor has a 15% higher heat loss compared to the middle floor in all
scenarios due to its location above the ground floor, which has lower indoor air temperature compared to the first floor. It
should be noted that there is no thermal insulation between the internal floors and, as a result, the heat loss from the first
floor is higher than that from the middle floors resulting in higher heating load in the first floor. The heat loss through
external infiltration is also higher in the top floor using the representative flats scenarios at around 38 kWh (flat A
scenario) and 55 kWh (flat B scenario) compared to the first floor (39kWh using flat A scenario, 55kWh using flat B
[image:17.595.43.516.380.685.2]scenario) and the middle floor (35 kWh using flat A scenario and 50 kWh using flat B scenario).
Figure 5. The predicted heat balance of the first floor, middle floor and the top floor of the tower block using the representative patterns of flats A and B vs. TM59 and SAP 2012 in the coldest winter week (17-23 January 17)
-100 0 100 200 300 400 500
External Infiltration-Top Floor External Infiltration- Mid Floor External Infiltration- 1st Floor Occupancy Zone Heating- Top Floor Zone Heating- Mid Floor Zone Heating- 1st Floor
TM 59 and SAP 2012 Scenario Flat B Scenario Flat A Scenario
[image:17.595.69.497.518.687.2]ACCEPTED MANUSCRIPT
17 The TM 59 and SAP 2012 scenario also achieved comparable variances but the heat loss is around 50% less than for flat
B schedule where the properties are set to be ventilated for one hour per day (the actual natural ventilation pattern for flat
B). However, in TM59 and SAP 2012 scenario only the extractor fans are set to be used for ventilation. The heat loss
through the top floor is still significantly higher than that from the other floors which causes the lower indoor air
temperature in the top floor spaces which results in higher heating load compared to the typical floors below. It should be
noted that internal heat gains from occupants also increases the zone heat gain during the winter period (Figure 5).
Comparing the heat gain and heat loss in the three representative floors using three occupancy and energy use scenarios
demonstrates that, although the heat loss through infiltration is not significant, the zone heating is considerably higher in
the top floor using the flat B scenario (472 kWh), flat A scenario (287 kWh) and the TM and SAP scenario (226 kWh)
due to the significant heat loss to the external environment. This is mainly due to the roof being exposed to the outside
environment whilst the first floor is located above garages, and storage and auxiliary rooms which are unheated. The
result demonstrates that thermal insulation in roof and ground/first floor slabs need to be addressed during retrofit to
reduce the heat loss to the minimum. However, the significant heat loss, in turn, increases the zone heating load of the top
floor to provide a comfortable indoor environment. In addition, the results show that the zone heating load in the three
simulated floors are significantly higher using flat B scenario compared to flat A and TM and SAP scenarios. The zone
heating value in all floors is around 53% higher using flat B scenario compared to TM and SAP scenario, while it is
around 39% higher than when using flat A scenario. Building simulation analysis undertaken for the whole tower block
represents the same variation between the heat loss and gain where the results show that the overall zone heating of the
tower block using flat B scenario is around 50% more than when using the other two scenarios. In general, the heat
balance shows that, apart from occupancy profiles and energy consumption patterns, the building envelope should be
upgraded to reduce the heat loss from the indoor environment to the outdoor environment and as a result reduce the total
heating demand of the tower block.
The quarterly energy bills of the monitored flats in the winter season were also compared against the simulation
results using TM and SAP scenario. The energy bills demonstrated that the average daily gas usage in flat A is 29 kWh
while in Flat B it was 79 kWh. However, the average predicted daily heating energy consumption of these flats using TM
59 and SAP 2012 scenario in DB was 27.5 kWh almost 60% less than flat B but close to flat A’s daily energy use. This
shows that the applied standard patterns (TM 59 and SAP 2012) provide comparable results to flat A which represents
the low occupancy pattern. This also indicates that with the application of the standard patterns, it is only possible to
predict the energy consumption of the building with low occupancy. However, it is found that one third of the properties
ACCEPTED MANUSCRIPT
18 use patterns which altogether will have significant impact on the actual total energy use of the building, and subsequently
on the performance of the retrofit strategy.
4.
Conclusion
This study investigates the building performance of a social housing tower block in LBN in relation to occupants’
energy use patterns. The study is undertaken over two phases; building performance evaluation of the tower block as a
dominant social housing prototype in the borough, which is the focus of this paper, followed by the second phase to
develop an evidence-based retrofit strategy to support Newham Council’s retrofit plans. In the current phase of the study,
a questionnaire-based survey of the whole tower block, structured interviews with sample properties, indoor
environmental monitoring and building simulation modelling were undertaken to assess the building performance and the
impact of occupants’ energy use and occupancy profiles on the energy performance of the building. This study sought to
develop a calibrated building simulation model of the case study to facilitate the investigation of energy efficient and cost
effective retrofit of this building prototype.
The results of the questionnaire indicated that the occupants’ energy use patterns and their socio-demographic
characteristics including the number of occupants and age groups have considerable effects on the building energy
performance. The study shows that the number of the occupants, the economic status of the family members, and the
number of young children in the households have a positive and strong correlation with the heating energy use. The
dominant income level of the households also highlighted the fuel poverty issue and the necessity for energy-efficient
retrofit to reduce energy bills. Based on the questionnaire results, combined with Newham Council’s water ingress
survey results, two representative flats were identified as exploratory samples with two dominant scenarios for heating
energy use and occupancy patterns for the subsequent stage of building performance modelling and simulation; flat A
with low occupancy patterns and flat B with high occupancy patterns. The indoor air temperature and relative humidity
levels of the flats were also monitored during the winter season, and the results correlated to occupants’ thermal comfort,
occupancy and heating energy use patterns, energy bills and issues experienced within their homes. The analysed results
have been used to calibrate the dynamic thermal and energy modelling and simulation undertaken for the sample flats
and the whole tower block.
The field monitoring results showed that the measured indoor air temperature and RH levels were usually within
the acceptable comfort ranges in both bedrooms of each flat – master and second bedrooms. The study also showed that
flat B has a higher energy consumption level compared to flat A due to the occupancy and heating patterns. However,
from the interviews, it has been found that the occupants of both flats were not satisfied with the indoor thermal
ACCEPTED MANUSCRIPT
19 that the problems may be partly due to the deteriorated building envelope in addition to the occupants’ lifestyles and
energy consumption behaviour (e.g. heating, washing, cooking, and showering), where such issues are exacerbated in the
winter season.
Building modelling and energy simulation using DB was ran for the coldest week of the winter to evaluate the
building performance and to calibrate the building model. A comparative analysis between the monitored data and the
thermal modelling and simulation results validated the model in preparation for the subsequent phase of the study as the
variances between the predicted indoor air temperature and the measured data were deemed acceptable (between 5% and
15%). Furthermore, the occupancy and heating profiles of the sample flats were applied to the DB model, and the
calculated building performance results compared to the TM 59 and SAP 2012 occupancy and heating profile results. As
the building simulation tools do not provide a standardised approach to evaluate the variances in occupants’ lifestyles and
energy use patterns [52], real, dominant scenarios of occupancy and energy use patterns were adopted for the modelling;
flat A (low occupancy) and flat B (high occupancy). The building performance using these scenarios was compared to
the standardised pattern in order to understand and identify representative profiles to predict feasible building energy
performance. The comparison between the predicted energy use of the tower block using flats A and B scenarios against
the estimated energy consumption of the building using TM59 and SAP 2012 patterns shows that the mean heating
balance of the tower block in all floors is at its highest level when using flat B scenario (60% more than the other
scenarios). In addition, when applying flat A scenario to the simulation model, the energy use of the tower block is
comparable to the TM and SAP scenario results. As around 31% of the tower block has an almost identical flat A profile
and 31 % has almost identical flat B profile, it is important to use both scenarios in the energy simulation to predict
feasible building energy performance values considering the low and high profiles rather than solely rely on standardised
patterns. In this study, it was also found that one of the reasons for the more intensive heating patterns in the case study
flats is due to the deteriorated building envelope. The other reasons are socio-demographic characteristics of the
occupants, which have a direct impact on occupancy and heating patterns of the building.
This study shows that it is necessary to consider dominant profiles in simulation modelling to predict more
reliable building energy performance for more effective retrofit strategies. The values also imply that the lifestyle and
energy consumption behaviour of the households have a direct influence on the level of energy use in the properties
although the occupants usually followed a regular heating and occupancy pattern in the winter. However, occupants
thought they used more heating energy in winter where they believed that raising the indoor air temperature and keeping
the heating on for longer may reduce the effect of damp, mould and condensation. The study also showed that the
ACCEPTED MANUSCRIPT
20 Raising awareness and educating occupants concerning energy use behaviour can reduce the issues experienced over the
short term. However, the more effective solution for the case study is deep energy retrofit, which can significantly reduce
the energy consumption of the block, mitigate fuel poverty whilst providing comfortable indoor environments. This is
currently being considered by LBN and forms the focus of the second phase of the study [54].
Acknowledgments
The British Council under the Newton Institutional Links project fund [grant number 2015EGY01] has funded this
research project. The authors would like to acknowledge the support of Newham Council in London for facilitating the
survey and monitoring of the case study and Mr Wei Shi for undertaking the survey questionnaire.
References
[1] J. S. Bourelle, “Zero energy buildings and the rebound effect: A solution to the paradox of energy efficiency?,” Energy Build. 84 (2014) 633–640.
[2] S. Vardoulakis et al., “Impact of climate change on the domestic indoor environment and associated health risks in the UK,” Environ. Int. 85 (2015) 299–313.
[3] BEIS, “Energy Consumption in the UK,” Department for Business, Energy and Industrial Strategy, 2017. [4] DECC, “International aviation and shipping emissions and the UK’s carbon budgets and 2050 target.” The
Department of Energy and Climate Change, London, 2012.
[5] S. Walker, R. Ballington, and Newham Council, “Domestic Energy Efficiency in Newham Annual Report 2013-4,” London, 2015.
[6] T. B. Long, W. Young, P. Webber, A. Gouldson, and H. Harwatt, “The impact of domestic energy efficiency retrofit schemes on householder attitudes and behaviours,” Environ. Plan. Manag. 58 (2015) 1853–1876.
[7] C. Liddell, C. Morris, and S. Lagdon, “Kirklees Warm Zone: The project and its impacts on well-being,” University of Ulster, 2011.
[8] London-Assembley, “RE:NEW- Helping to make London’s homes more energy efficient.” Greater London Authority, London, 2017.
[9] A. Owen, A., Mitchell, G., Gouldson, “Unseen influence - The role of low carbon retrofit advisers and installers in the adoption and use of domestic energy technology,” Energy Policy (2014) 73169–179.
[10] K. Bromley-Dery and Newham Council, “Home Energy Conservation Act (HECA) Return,” London, 2015. [11] BEIS, “Annual Fuel Poverty Statistics Report, 2017 (2015 DATA),” London, 2017.
[12] R. Galvin and M. Sunikka-Blank, “Economic viability in thermal retrofit policies: Learning from ten years of experience in Germany,” Energy Policy 54 (2013) 343–351.
[13] A. Grimes et al., “Warming Up New Zealand: Impacts of the New Zealand Insulation Fund on Metered Household Energy Use,” Ministry of Economic Development, Wellington, 2011.
[14] V. R. Jones, A. Fuertes, C. Boomsma, and S. Pahl, “Space heating preferences in UK social housing: A socio-technical household survey combined with building audits,” Energy Build.127 (2016) 382–398.
[15] M. Chitnis, S. Sorrell, A. Druckman, S. Firth, and T. Jackson, “Turning lights into flights: estimating direct and indirect rebound effects for UK households,” Energy and Policy 55 (2013) 234–250.
ACCEPTED MANUSCRIPT
21 [17] A. O’Donovan, P. D. O’Sullivan, and M. D. Murphy, “A field study of thermal comfort performance for a slotted
louvre ventilation system in a low energy retrofit,” Energy Build. 135 (2017) 312–323.
[18] G. Walker, N. Simcock, and R. Day, “Necessary energy uses and a minimum standard of living in the United Kingdom: Energy justice or escalating expectations?,” Energy Res. Soc. Sci. 18 (2016) 129–138.
[19] C. Snell, M. Bevan, and H. Thomson, “Justice, fuel poverty and disabled people in England,” Energy Res. Soc. Sci. 10 (2015) 123–132.
[20] E. P. Judson and C. Maller, “Housing renovations and energy efficiency: insights from homeowners’ practices,” Build. Res. Inf. 42 (2014) 501–511.
[21] A. Vilches, A. Barrios Padura, and M. Molina Huelva, “Retrofitting of homes for people in fuel poverty: Approach based on household thermal comfort,” Energy Policy 100 (2017) 283–291.
[22] F. Stazi, F. Naspi, and M. D’Orazio, “A literature review on driving factors and contextual events influencing occupants’ behaviour in buildings,” Build. Environ. 118 (2017) 40–66.
[23] K. Ahmed, A. Akhondzada, J. Kurnitski, and B. Olesen, “Occupancy schedules for energy simulation in new prEN16798-1 and ISO/FDIS 17772-1 standard,” Sustain. Cities Soc. 35 (2017)134–144, 2017.
[24] University of Southampton, “Occupancy Patterns Scoping Review Project,” Southampton, 2016.
[25] W. Chang and T. Hong, “Statistical analysis and modeling of occupancy patterns in open-plan offices using measured lighting-switch data,” Build. Simul. 6 (2013) 23–32.
[26] K. Song, N. Kwon, K. Anderson, M. Park, and H. Lee, “Predicting hourly energy consumption in buildings using occupancy-related characteristics of end-user groups,” Energy Build. 156 (2017) 121–133.
[27] EBC, “Definition and Simulation of Occupant Behavior in Buildings- Annex 66,” Energy in Buildings and Communities Programme, 2016.
[28] D. Yan, T. Hong, B. Dong, A. Mahdavi, and S. D’Oca, “IEA EBC Annex 66: Definition and simulation of occupant behavior in buildings,” Energy Build. 156 (2017) 258–270.
[29] D. Aerts, J. Minnen, I. Glorieux, I. Wouters, and F. Descamps, “A method for the identification and modelling of realistic domestic occupancy sequences for building energy demand simulation and peer comparision,” Build. Environ. 75 (2014) 67–78.
[30] S. Walker, R. Ballington, and N. Council, “London Borough of Newham Annual Fuel Poverty Report 2013-14,” London, 2015.
[31] J. Medhurst, C. Turnham, and J. R. and Partners, “Damp Survey for London Borough of Newham,” London, 2016.
[32] H. Ben and K. Steemers, “Tailoring domestic retrofit by incorporating occupant behaviour,” in Energy Procedia, 2017, vol. 122, pp. 427–432.
[33] K. U. Ahn, D. W. Kim, C. S. Park, and P. de Wilde, “Predictability of occupant presence and performance gap in building energy simulation,” Appl. Energy 208 (2017) 1639–1652.
[34] Newham Council, “Water Penetration Survey,” London, 2016.
[35] CIBSE, “Environmental Design, CIBSE Guide A.” Chartered Institution of Building Services Engineers, London, UK, 2016.
[36] S. Zahiri and H. Elsharkawy, “Building Performance Evaluation for the Retrofit of Council Housing in the UK: A case study of a tower block in London,” PLEA 2017, Passive Low Energy Architecture- Designto Thrive, vol. 1. NCEUB 2017, Edinburgh, pp. 941–947, 2017.
[37] Newham Council, “Typical Floors Plans of a Tower Block in London Borough of Newham.” London Borough of Newham, London, 2007.
ACCEPTED MANUSCRIPT
22 Environment, University of West England, 2005.
[39] H. W. Harrison and R. C. De Vekey, BRE Building Elements: Walls, Windows and Doors. London, UK: BRE Press, 1998.
[40] R. J. Cole and R. Lorch, Buildings, Culture and Environment: Informing Local and Global Practices. Wiley-Blackwell, 2003.
[41] CIBSE, “TM59: Design methodology for the assessment of overheating risk in homes.” The Chartered Institution of Building Services Engineers, London, 2017.
[42] A. N. Oppenheim, Questionnaire Design, Interviewing and Attitude Measurement, New. London & New York: Continuum International Publishing Group Ltd, 1992.
[43] D. G. Bonett and T. A. Wright, “Sample size requirements for estimating Pearson, Kendall and Spearman correlations,” Psychometrika 65 (2000) pp. 23–28.
[44] A. Field, Discovering Statistics Using SPSS, Sage Publication, 2009.
[45] J. Pajula and J. Tohka, “How Many Is Enough? Effect of Sample Size in Inter-Subject Correlation Analysis of fMRI,” Comput. Intell. Neurosci. 2016 (2016).
[46] W. Shi, H. Elsharkawy, and H. Abdallah, “An Innovative Energy Efficiency Application Development Through the Occupants’ Behavioural Issues and its Impact on Domestic Energy Consumption in the UK,” International Conference for Sustainable Design of the Built Environment (SDBE 2017), University of East London, London, 2017.
[47] J. Hopper, “Evaluating the Installation of Retrofitted External Wall Insulation - CIAT Student Award, Technical Report,” CIAT, London, UK, 2012.
[48] DesignBuilder Ltd., “DesignBuilder Simulation Software,” 2018. [Online]. Available: https://www.designbuilder.co.uk/software/product-overview. [Accessed: 17-May-2018].
[49] FEMP, “M&V Guidelines: Measurement and Verification for Performance-Based Contracts Version 4.0,” 2015. [50] P. Trotman, C. Sanders, and H. Harrison, Understanding Dampness. Watford: BRE Bookshop, 2004.
[51] K. Steemers and H. Ben, “Energy retrofit and occupant behaviour in protected housing: A case study of the Brunswick Centre in London,” Energy Build. 80 (2014) 120–130.
[52] V. Martinaitis, E. K. Zavadskas, V. Motuziene, and T. Vilutiene, “Importance of occupancy information when simulating energy demand of energy efficient house: A case study,” Energy Build. 101 (2015) 64–75.
[53] H. Elsharkawy and P. Rutherford, “Retrofitting social housing in the UK: Home energy use andperformance in a pre-Community Energy Saving Programme (CESP),” Energy Build. 88, (2015) 25–33.