University of Huddersfield Repository
Muhamedsalih, Hussam, Jiang, Xiang and Gao, F.
Comparison of fast Fourier transform and convolution in wavelength scanning interferometry
Original Citation
Muhamedsalih, Hussam, Jiang, Xiang and Gao, F. (2011) Comparison of fast Fourier transform and
convolution in wavelength scanning interferometry. In: Proceedings of SPIE Volume 8082. SPIE
Optical Metrology, 80820Q80820Q.
This version is available at http://eprints.hud.ac.uk/id/eprint/10794/
The University Repository is a digital collection of the research output of the
University, available on Open Access. Copyright and Moral Rights for the items
on this site are retained by the individual author and/or other copyright owners.
Users may access full items free of charge; copies of full text items generally
can be reproduced, displayed or performed and given to third parties in any
format or medium for personal research or study, educational or notforprofit
purposes without prior permission or charge, provided:
•
The authors, title and full bibliographic details is credited in any copy;
•
A hyperlink and/or URL is included for the original metadata page; and
•
The content is not changed in any way.
For more information, including our policy and submission procedure, please
contact the Repository Team at: [email protected].
Comparison of Fast Fourier Transform and Convolution in
Wavelength Scanning Interferometry
H. Muhamedsalih*
a, X. Jiang
a, F. Gao
aa
Centre for Precision Technologies, University of Huddersfield, HD1 3DH , The U.K
Corresponding author: Email: [email protected] (Hussam Muhamedsalih)ABSTRACT
The assessment of surface finish has become increasingly important in the field of precision engineering. Optical interferometry has been widely used for surface measurement due to the advantages of non-contact and high accuracy interrogation. In spite of the 2π phase ambiguity that can limit the measurement scale in monochromatic interferometry, other optical interferomtry have succeeded to overcome this problem and to measure both rough and smooth surfaces such as white light interferometry and wavelength scanning interferometry (WSI). The WSI can be used to measure large discontinuous surface profiles by producing phase shifts without any mechanical scanning process. Where the WSI produces the phase shifts by altering the wavelength of a broadband light source and capturing the produced interferograms by a CCD. This paper introduces an optical setup and operation principle of a WSI that used a halogen white light as a broadband illumination source and an acousto-optic tunable filter (AOTF) as a wavelength scanning device. This setup can provide a wide scan range in the visible region. The scanned range is being operated from 682.8 nm to 552.8nm and the number of captured frames is 128. Furthermore, the obtained interferograms from a Linnik interferometer have been analyzed by two methods, Fast Fourier Transform and Convolution. A mathematical description of both methods is presented then a comparison in results accuracy is made between them. The Areal measurement of a standard 4.707µm step height sample shows that FFT and convolution methods could provide a nanometer measurement resolution for the surface finish inspection.
Keywords: Wavelength Scanning Interferometry, Convolution, FFT, Interferograms, Interference fringes, AOTF
1.
INTRODUCTION
In developed economies the manufacture of high added value critical components is rapidly shifting to the design and fabrication of micro and nano structured and freeform surfaces1,2. The highly polished and ultra-precision structured surfaces are widely used in industry such as silicon wafers, hard disk drives, MEMS/NEMS and micro-moulding industries. However, many of these manufactured items suffer from scrap rates reach to 50-70%3. Therefore, a demand of inspection ultra precision surfaces is vastly emerged. Optical interferometry has been widely explored for surface measurement due to the advantages of non-contact, high measurement resolution and high throughput inspection. Various interferometry methods of surface inspection have been developed for different applications such as phase shift interferometry, white light interferometry and wavelength scanning interferometry (WSI)4. The phase shift interferometry is typically used for two dimensional profiles, areal topographies, and for measurements that requires high resolution and throughput. The main limitation of this type of interferometry is the phase ambiguity that occurs when measuring discontinuous surfaces with heights exceed a half of the illumination wavelength. Therefore, the application of this kind of interferomtry is limited to non rough and highly polished surfaces inspections5. This limitation was overcome by developing a white light interferometry. Measuring the coherence of white light is used to indicate the zero optical path difference position (i.e OPD=0) for each measurement point6. Typically, the coherence measurement is measured by performing mechanical scanning using a piezo-electric transducer. Nevertheless, the need to perform a mechanical scanning of a heavy probe head or the specimen stage limits the measurement speed. In addition, the mechanical scanning might cause measurement error due to some of piezo-mechanical performance such as hysteresis and creep. An alternative method of measuring large discontinuous surfaces, without mechanical scanning, was developed by using wavelength scanning technique.
wavelength of the illumination source. Thus, the absolute optical path difference can be measured without 2π phase ambiguity. In this paper the WSI system is used to measure a large discontinuous step sample. The scanning of wavelength is achieved by using acousto optic tunable filter (AOTF) placed after a broadband light. Two methods are used to evaluate the obtained interferograms, which are the Fourier Transform and convolution. Analyzing the captured data with Fourier Transform is based on extracting the slop of the phase shifts from the intensity pattern of each pixel. The convolution analysis is based on determining peaks of the obtained sinusoidal interferograms with respect to the scanned wavelength range. Areal measurements of 4.707µm step height sample are demonstrated in this paper.
2.
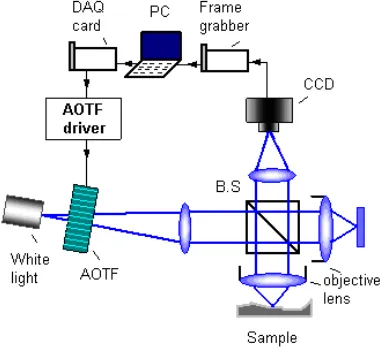
WAVELENGTH SCANNING INTERFEROMETRY SYSTEM
The interferometry system, shown in figure 1, is composed of a Linnik interferometer illuminated by a halogen white light source, acousto-optic tunable filtering and interface cards (i.e. DAQ and frame grabber). The interface cards are used to communicate the PC with the optical environment. The AOTF is key feature of this experimental setup. It is placed after a halogen white to select a specific wavelength and pass to a Linnik interferometer. The wavelength selection depends on the AOTF driving frequency. Thus by changing the driving frequency, wavelength scanning process is achieved. In this experiment, the wavelength is scanned from 682.8nm to 552.8nm with less than 1.5nm bandwidth resolution for each wavelength.
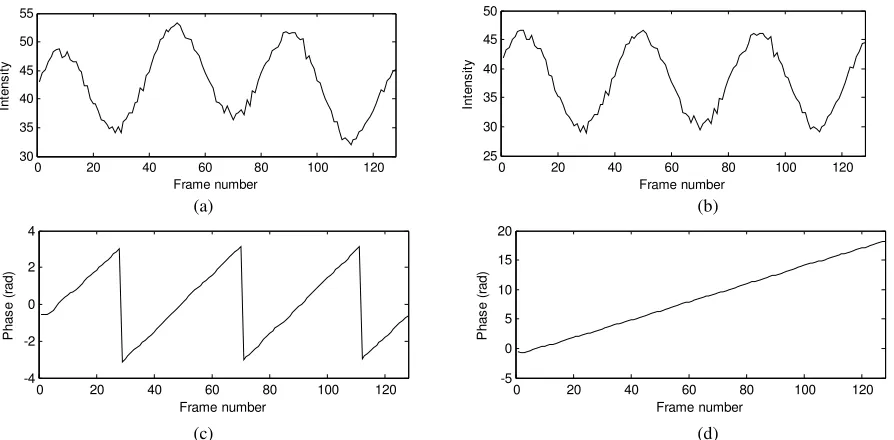
Different wavelengths of light pass through the AOTF in sequence so that a series of interferograms are detected by the CCD. The absolute optical path difference can be calculated through analyzing these interferograms. During wavelength scanning process, 128 frames are captured by a CCD hence each frame has a specific wavelength. Every pixel in a frame represents a specific point upon the surface of a measured sample. Thus by gathering the pixels of a specific sample point, a sinusoidal intensity distribution is obtained as shown in figure 2.a. Each point in this distribution has it own scanned wavelength. Equation 1 describes the mathematical expression of the intensity distribution8.
(i)) xy cos( xy b xy a (i) xy
I = + ϕ (1)
I is an intensity value captured by a CCD pixel. i is the iteration of the frame number (1,2,..,n). x and y are the pixel numbers in horizontal and vertical directions of the CCD respectively. a and b are constant values depend on the light intensity values that reflect from interferometer arms. φ is the phase shift caused by altering wavelength of the broadband light. The phase of the intensity distribution depends on the wavelength and the optical path difference (i.e. height of the measured sample), as described in equation 2.
h * 2 2 (i)
i
λ π
ϕ =
(2) [image:3.595.201.393.508.684.2]
λi is the scanning wavelength and h is the sample step height. A 4.707µm step height calibrated sample is measured by the proposed system to verify the analysis methods. Convolution and FFT algorithms have been used to extract the point elevation from the intensity distribution.
3.
MATHEMATICAL DESCRIPTION
3.1 3.1 Fourier Transform Analysis Method
The captured frames obtained from WSI, are analyzed using FFT algorithm. The intensity values of each pixel need to be gathered and analyzed individually from other pixels. The interference intensity pattern of one pixel during the wavelength scanning process is shown in figure 2.a. The sinusoidal pattern in this figure suffers from slow change in the intensity average value. This change might be caused by the CCD response to the scanned wavelength range. The variation in the average intensity needs to be compensated before FFT take place as stated by Takeda in 19829. The compensation is achieved by dividing the interference intensity pattern over the background intensity distribution along the scanned wavelength range. The compensation result is shown in figure 2.b.
The mathematical expression of figure 2.b can be rewritten in form of equation 3 instead of equation 1 for the convenience of explanation.
(i) xy j e xy b 2 1 (i) xy j e xy b 2 1 (i) xy a (i) xy I ϕ ϕ − − + = (3)
Equation 3 can be simplified by considering the following notations.
ϕ j e b 2 1
c= and * be jϕ 2 1 c = −
Then, Ixy(i)=a+c+c* (4)
FFT is applied to equation 4 to find the spectrum of the intensity distribution. The spectrum of the FFT output contains three main terms as stated in equation 5. The first term is constant amplitude that relates to the light intensity in each interferometer arm, the second and third terms are related to the fringe frequency recorded by the pixel. The purpose of FFT is to distinguish between the useful information which is represented by the phase change (i.e. c or c* term) and the unwanted information of constant amplitude (i.e. A). The fo is a spatial frequency corresponding to the wavelength scanning and it is function of the optical path difference.
) f (f C ) f C(f A(f) ] FFT[I o * o
xy = + − + + (5)
The unwanted spectrum A and C* are filtered out and the inverse FFT is applied to equation 5 to reconstruct the c value in equation 4. Then, natural logarithm is applied to separate the phase φ from the unwanted amplitude variation b, as illustrated in equation 6.
ϕ ϕ i B] 2 1 [ ln ] i e 2 1
ln[B = + (6)
The phase, shown in figure 2.c, is extracted from the imaginary part of equation 11. Since the calculated phase is limited to range of –π to π, the phase distribution is suffers from discontinuities. These discontinuities are corrected by adding 2π
at the discontinuous parts as shown in figure 2.d. Finally, the optical path difference (OPD) is calculated from the slop of phase distribution using equation 7.
− = n λ 1 m λ 1 2π ∆
OPD ϕ (7)
0 20 40 60 80 100 120 30 35 40 45 50 55 Frame number In te n s it y
0 20 40 60 80 100 120
25 30 35 40 45 50 Frame number In te n s it y
(a) (b)
0 20 40 60 80 100 120
-4 -2 0 2 4 Frame number P h a s e ( ra d )
0 20 40 60 80 100 120
-5 0 5 10 15 20 Frame number P h a s e ( ra d )
[image:5.595.66.513.74.294.2](c) (d)
Figure 2 Inference intensity Analysis (a) Interference intensity distribution (b) Corrected Interference intensity distribution (c) Phase distribution with discontinuities (d) Corrected phase distribution.
3.2 Convolution Analysis Method
The principle of convolution method is based on determining the positions of peaks or valleys obtained from the sinusoidal intensity values captured by one of the CCD pixels that shown in figure 2.a. The positions of peaks or valleys are determined with respect to the scanned wavelength range. In this paper, the determinations of peaks positions are considered to obtain the optical path difference. Applying convolution analysis to the intensity distribution is equivalent to calculate the first derivate of the distribution and band pass filtering of the constant component, slow variation of the background intensity and high frequency noise contained in the distribution. The convolution process can be described by equation 8.
∫ −
= 2B
0 I(x τ)f(τ)dτ f(t)
*
I(x) (8)
Where I(x) is the interference intensity distribution, T is the convolution shift parameter and f(T) is a function is set with a square criteria to achieve the convolution purposes. The f(t) criteria is explained in equation 9.
< < < < − = 2B t B 1 B t 0 1
f(t)
(
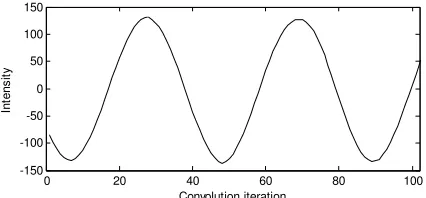
9)The 2B value is the width of the function f(t) which is approximately about 74% of the intensity distribution period as described by Snyder in 198010. The convolution process produces a sinusoidal wave which intersects the propagation axis at the same peaks and valleys positions of the convolved intensity pattern as shown in figure 3. Thus, by monitoring the change in the sign of the produced convolution wave, the peaks positions can be determined when the intensity distribution is changed from negative to positive value.
Mathematically, the phase change between two successive peaks is 2π. Hence by subtracting phases at two specific peaks, the optical path difference can be obtained as declared in equation 10.
) σ (σ * 2π 2π * 1) peaks of (number OPD 2 1− −
= (10)
0 20 40 60 80 100 -150 -100 -50 0 50 100 150 Convolution iteration In te n s it y
more precisely by using linear interpolation method as stated in equation 11 and the optical path difference calculation, can be optimized by using least –squares fitting approach, hence equation 12 is obtained.
(r) ' I 1) (r ' I (r) ' I r ' r + + +
= (11)
Where r’ is the actual position of a peak, I’(r) is a negative sign magnitude of convolution output that followed by positive sign value, I’(r+1) is a positive sign magnitude of convolution output that led by negative sign value. Equation 7 can be used to calculate the sample optical path difference.
∑ = ∑ + + − − + = n 1 j n 1 j j σ 1) (n j jσ 2 6 1) 1)(n n(n OPD (12)
[image:6.595.185.398.285.384.2]Where j is the iteration of peaks or valleys (i.e. 0, 1, 2, 3,…,n),n is the number of peaks and σj=1/λj is the wave number and λj are the wavelengths of the corresponding peak.
Figure 3 The convolution output of figure 2.a and filter of equation 9
4.
RESULT AND D ISCUSSION
[image:7.595.76.535.78.281.2]
(a) (b)
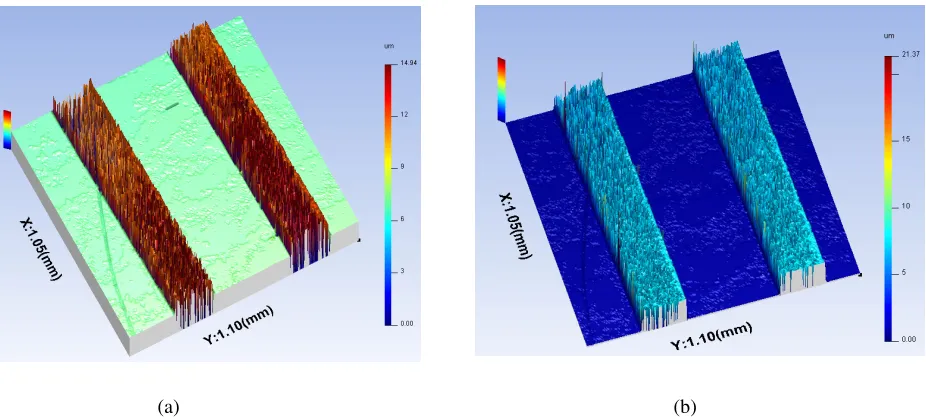
Figure 4 Areal measurement of 4.707µm sample (a) using FFT (b) using convolution
(a)
(b)
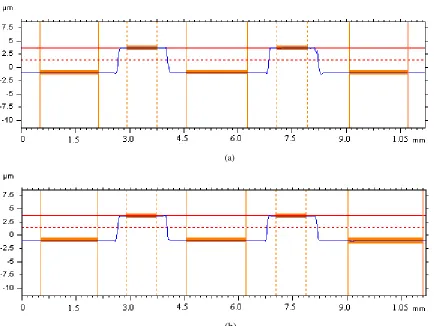
[image:7.595.82.516.299.625.2](a) (b)
Figure 6 Convolution Result for different filters width (a) filter width=62% of the interference period (b) filter width=85% of the interference period
5.
CONCLUSION
The WSI system can be used for areal measurements of discontinues profiles surfaces without phase ambiguity. The AOTF provides a fast wavelength scanning technique to produce phase shift information. The produced phase shift can be evaluated by the FFT or convolution methods. Both of methods provide results with nanometer resolution. The FFT method is susceptible to errors that produced form background intensity variation while the convolution is susceptible to errors that produced form false presentation of convolution filter criteria.
ACKNOWLEDGEMENT
The authors gratefully acknowledge the Engineering and Physical Sciences Research Council (EPSRC) UK for supporting this research work under its IKC programme. The author X. Jiang gratefully acknowledges the Royal Society under a Wolfson-Royal Society Research Merit Award and the European Research Council under its programme ERC-2008-AdG 228117-Surfund.
REFERENCES
[1] K. W. Lyons, “Integration, Interoperability, and Information Management: What are the key issues for Nano-manufacturing? “, Proc. of SPIE Vol. 6648, 66480D (2007).
[2] Deutsche Agenda Optische Technologien fur das 21. Jarhundert, “Lenkungskreis Optische Technologien fur des 21. Jarhundert“, A. Siegel, G. Liftin (ed.), (2000).
[3] Nexus Workshop Report, “Metrology and characterization for micro and nano technology”, Design-for-purpose metrology expert Workshop, Loughborough-UK, (2008).
[4] Jiang X. et al., “Fast Surface Measurement Using Wavelength Scanning Interferometry with Compensation of Environmental Noise”, Applied Optics, Vol. 49, No. 15, (2010)
[5] Caber P., “Interferometric profiler for rough surfaces”, Applied Optics, Vol. 32, No. 19, (1993).
[6] Schwider J. and Zhou L., "Dispersive Interferometric Profilometer", Optics Letters, Vol.19, No.13, 995-997 (1994).
[8] Hariharan P. [Optical Interferometry], Elsevier, San Diego-USA, 2nd edition, pp.11 (2003).
[9] Takeda M., Ina H. and Kobayashi S., "Fourier-Transform Method of Fringe Pattern Analysis for Computer based Topography and Interferometry", Optical Society of America, Vol.72, No.1, 156-160 (1982).