2016 International Conference on Computational Modeling, Simulation and Applied Mathematics (CMSAM 2016) ISBN: 978-1-60595-385-4
Prediction of Driver Deceleration Intent in Vehicle Platoon System
Hironori SUZUKI
1,*and Takaya ISHIKURA
21
Nippon Institute of Technology, 4-1 Gakuendai, Miyashiro, Saitama 3458501, Japan
2
Graduate School of Nippon Institute of Technology, 4-1 Gakuendai, Miyashiro, Saitama 3458501, Japan
*Corresponding author
Keywords: Prediction, State Estimation, Unscented Kalman Filter, Driver Intent, Car-Following, Platoon.
Abstract. This paper proposed the unscented Kalman filter (UKF) in which the state equations are defined by trend, car-following and artificial neural network models to estimate the headway and velocity of platooning vehicles. Based on the estimates, the authors then attempt to predict the driver deceleration intent using a conventional car-following model. The UKF integrated with the car-following model is the best among the other models, but it still needs some improvement to maximize the prediction accuracy.
Introduction
Rear-end collisions in longitudinal car-following situations occasionally cause severe multiple collision accidents, especially in high-density and high-speed traffic. Use of the autonomous collision avoidance system (ACAS), which is one of the active safety measures of the Advanced Driver Assistance System (ADAS), may provide a solution to this problem. Instead of the direct vehicle control provided by an ACAS, an estimation or prediction of driver intentions can also provide a useful key to accident avoidance. For example, if a driver’s intended braking and lane changing actions can be inferred in advance, appropriate measures may be applied to prevent accidents from ensuing.
To date, numerous studies aimed at finding ways to infer a driver’s intent in terms of active safety have been conducted. The most popular research aims at inferring lane changing intent based on some mathematical approaches including sparse Bayesian learning (SBL), support vector machine (SVM) and particle filter (PF) [1-6]. The intention inference is extended to the problem of judging the stop or go decision making at signalized intersections using machine learning techniques such as SVM-Bayesian filter (SVM-BF), hidden Markov model (HMM), Bayesian network (BN), and linear regression analyses (LRA) [7-9]. Another interesting research investigates the inference of turning behavior at intersections [10, 11]. By measuring the vehicle velocity and position, the driver’s intention was predicted regardless of turning signal activation.
With the exception of the study by Saito et al. [12], significantly less attention has been paid to the estimation and prediction of driver’s longitudinal behavior, even though it has considerable potential for application to the rear-end collision avoidance problem as seen in the researches on the development of enhanced brake lighting system [13-14]. In their study, the authors developed a system that detects when a driver places his/her foot on the brake pedal (cover BP) and reports this action to the driver of the following car by illuminating an amber light indicator placed near the high-mount stop lamp. Since the following driver is able to recognize the potential braking intent of the preceding car earlier, and thus react much faster when brake light actually appears, the risk of rear-end collision can be decreased. However, the proposed algorithm is quite primitive because the system measures only the cover BP. Additionally, according to the results of a field test using a test car, only 80% of cover BP actions lead to actual brake pedal operation.
precision of the proposed model is evaluated using the car-following data collected through a driving simulator experiment.
Problem Formulation
Vehicle Platoon
Consider multiple vehicles traveling along a corridor as shown in Figure 1. Let vi and di denote the velocity and headway of i-th vehicle, respectively. Assuming that the 2nd vehicle is equipped with the sensors to measure d2, d3 and v2, the estimation problem is then to calculate the velocity and headway of all three preceding cars; v1, v2, v3, d2 and d3 by the UKF feedback process. If all these variables are identified in real-time, the acceleration rate of the 3rd vehicle, a3, that is expected to occur a few seconds later, can be predicted in advance using the car-following model which is well known as the Gazis-Herman-Rothery (GHR) model.
If the predicted a3 is reported to the following 4th vehicle earlier than the 3rd-car brake pedal operation, the following driver thus reacts much faster when brake light actually appears, the risk of rear-end collision can be decreased. As the platoon lengthens, the reduction of collision risk is amplified and propagated along the platoon in order to make the traffic safer and more stable.
( ) 1 v k ( ) 2 v k ( ) 3 v k ( ) 3
a k+T
( ) 2 d k ( ) 3 d k
Report to the 4thvehicle driver
Figure 1. Vehicle platoon.
The Model to Update Velocity and Headway
The velocity is updated by a simple trend model, whereas the headway is computed through a conservation equation as:
( )
(
1) (
1, 2, 3)
i i
v k =v k− i=
, (1)
( )
(
1)
1(
1)
(
1)
(
2, 3)
i i i i
d k =d k− +v− k− −v k− ∆t i=
. (2)
Eq. 1 is well known as the trend model. In order to improve the estimation accuracy, however, we introduce the GHR car-following model for describing the velocity and rewrite Eq.1 to Eq.3:
( )
(
)
(
)
(
)
(
1(
)
(
)
)
(
)
1 2, 3
n i
i i m i i
i
v k T
v k v k v k T v k T t i
d k T
α −
−
= − + − − − ∆ =
−
. (3)
Here, ∆t is the discrete time step for simulation, and α, m, n are the parameters for the GHR model.
T is the reaction time of a vehicle (T > 0). But the trend model should be still used for v1, i.e. v1(k)=
v1(k-1) because we assume there is no vehicle ahead of the 1st car. Since Eq.3 is highly nonlinear, we alternatively utilize a fundamental artificial neural network (ANN) model to describe Eq.3 as:
( )
(
1)
1(
)
,(
)
,(
)
(
2, 3)
i i i i i
v k =v k− + f v − k−T v k−T d k−T ∆t i=
, (4)
where, f is the three-layered ANN model to compute the acceleration rate of i-th vehicle ai(k) by
penetrating vi-1(k-T), v i(k-T) and d i(k-T). Thus, the number of neurons in input, hidden and output
Unscented Kalman Filter
The problem is to estimate the state variables x(k)=[v2, d2, v3, d3, v1]T(k) from the measurements y(k)=[ d2, v2, d3] T(k). Then, the state and measurement equations in the vector-matrix form are:
( )
(
) (
)
(
)
( )
( ) ( )
( )
1 , 1 1
,
k k k k
k k k k
= − − + −
= +
x F x u v
y H x u n
, (5)
where, u(k) is a known exogeneous input, v(k) and n(k) are process and measurement noises, respectively. The function F could be a trend model, the GHR model or an ANN model.
The UKF is a member of the family of derivative-free Kalman filters, which require no calculation of partial derivative of state and measurement equations [15]. The conventional extended Kalman filter (EKF) provides the first-order approximation to the optimal estimates, whereas the UKF captures the posterior mean and covariance accurately to their second-order Taylor expansions using a minimal set of carefully chosen sample points called sigma points [15].
The UKF employed in this research is to estimate x(k) from the measurements y(k). Since no partial derivative is required to compute the Kalman gain, the function F is not necessary to have analytical formulae and therefore could be an ANN model. Due to the limitaion of the pages, please refer [15] for more details about the UKF.
Prediction Model of Deceleration Intent
After the state variables x(k) are estimated through the feedback process of the UKF, the predicted acceleration rate ai(k+T) that is expected to occur T seconds later is given by the GHR model as:
(
)
( )
( )
(
1( )
( )
)
(
2, 3)
n i
i m i i
i
v k
a k T v k v k i
d k
α −
+ = − = . (6)
Numerical Example
Car-Following Data Collection through Driving Simulator (DS) Experiment
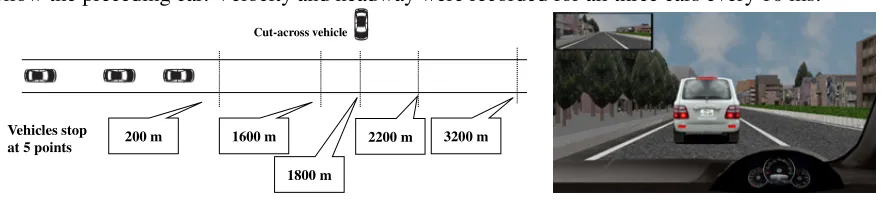
A DS experiment was carried out to collect the car-following data. The host vehicle followed the preceding and pre-preceding cars, which travelled at 20 m/s, forming a three-vehicle platoon on a two-lane road, as shown in Figure 2(a). The pre-preceding vehicle made five complete stops, including a sudden high deceleration due to a roadside vehicle cutting in. Here, the pre-preceding car is completely invisible from the driver seat of the host vehicle, as depicted in Figure 2(b).
In our study, three participants were requested to maintain the velocity constant at 20 m/s and to follow the preceding car. Velocity and headway were recorded for all three cars every 10 ms.
200 m 1600 m
1800 m
2200 m 3200 m
Cut-across vehicle
Vehicles stop at 5 points
[image:3.612.87.530.568.668.2]
Figure 2. Scenario of DS experiment and front view from the host vehicle.
Simulation and Evaluation
We selected the intermediate three deceleration and stop (1, 2 and 3) out of five complete stops for each participant (A, B and C) to prepare total nine scenarios, A1 to C3. The parameters of the GHR model are set to α=m=n=1 and ∆t=0.1 s. The reaction time of a driver T is assumed to be 1.3 s based on the car-following data analysis. The variance of noises v(k) and n(k) are to be 0.1 and 0.3, respectively.
Since v3 is not observed and is the key value to predict the deceleration intent, the performance of the UKF estimator is evaluated by comparing the v3 among the true value and the three estimates in which the trend, GHR and ANN models are used in the state equation. The predicted acceleration is then assessed by computing the root mean square errors (RMSE).
Estimation of Velocity and Headway
Figure 3(a) illustrates the estimates of v3 for the scenario B1. The trend model has a large delay in the speed deterioration when compared to the true data whereas the ANN model yields the under-estimation during most of the simulation interval. This under-estimation was frequently observed in most of the scenarios. The estimator in which the GHR model is used seems to give more accurate estimate than another models. In the total nine scenarios, the mean RMSEs of the trend, GHR and ANN models were 2.45, 1.51 and 1.11 m/s, respectively.
The mean RMSEs for another velocity and headway estimates including v2, d2, d3 are ranging between 0.300 and 0.400 m/s or m. Because of the use of trend model, however, the estimates of v1 has a large error around 2.00 m/s.
Prediction of Deceleration Intent
Figure 3(b) depicts the comparison between the predicted a3 and its true value. The a3 is given as the moving average during five time step interval. The trend model predicted significantly larger maximum deceleration rate because of the delay in speed deterioration. The ANN model gives the over-prediction of a3 since the velocity of the 3rd vehicle is underestimated during whole simulation interval. Only the UKF integrated with the GHR model was succeeded in predicting the a3 accurately. These findings are obvious when comparing the RMSE of total nine scenarios. The mean errors of a3 in the trend, GHR and ANN models were 3.25, 1.80 and 2.30 m/s/s, respectively.
0 5 10 15 20
0 10 20 30 40 50 60 70 80 90 100
v3
(m
/s
)
time (x 10ms)
trend TRUE GHR ANN
-12 -10 -8 -6 -4 -2 0 2
4 14 24 34 44 54 64 74 84 94 104
a3
(m
/s
2)
time (x 10ms)
trend TRUE GHR ANN
Figure 3. Estimation and prediction of v3 and a3 in scenario B1.
Conclusion
We proposed the UKF-based estimators in which the state equations are defined by trend, GHR and ANN models to estimate the headway and velocity of platooning vehicle. Based on the estimates, we then attempt to predict the driver deceleration intent using a conventional car-following model. The UKF integrated with the GHR model is the best among the other models, but it still needs some improvement to maximize the prediction accuracy. Further study is addressed to install this system to
[image:4.612.89.533.475.615.2]a DS experiment and try to evaluate how much the prior report of the predicted driver intent could reduce the risk of rear-end collision.
Acknowledgement
This work was supported by JSPS KAKENHI Grant Number 15K01230.
References
[1] J.C. McCall, D.P. Wipf, M.M. Trivedi, and B.D. Rao, “Lane Change Intent Analysis Using Robust Operators and Sparse Bayesian Learning”, IEEE Trans. on Intelligent Transportation Systems, vol. 8, no. 3, pp. 431–440, 2007.
[2] A. Doshi, and M. Trivedi, “A Comparative Exploration of Eye Gaze and Head Motion Cues for Lane Change Intent Prediction”, 2008 IEEE Intelligent Vehicles Symposium, pp. 49–54, 2008.
[3] A. Doshi, and M. Trivedi, “On the Roles of Eye Gaze and Head Dynamics in Predicting Driver’s Intent to Change Lanes”, IEEE transactions on Intelligent Transportation Systems, vol. 10, no. 3, pp. 453–462, 2009.
[4] A. Doshi, and M. Trivedi, “Investigating the Relationships Between Gaze Patterns”, Dynamic Vehicle Surround Analysis, and Driver Intentions, Intelligent Vehicles Symposium, pp. 887–892, 2009.
[5] D. D. Salvucci, “Inferring Driver Intent: A Case Study in Lane-Change Detection”, Proceedings of the Human Factors Ergonomics Society 48th Annual Meeting, 2004.
[6] J. Gunnarsson, L. Svensson, E. Bengtsson, and L. Danielsson, “Joint Driver Intention Classification and Tracking of Vehicles”, Nonlinear Statistical Signal Processing Workshop, 2006 IEEE, pp.95–98, 2006.
[7] G. S. Aoude, V. R. Desaraju, L. H. Stephens, and J. P. How, “Driver Behavior Classification at Intersections and Validation on Large Naturalistic Data Set”, IEEE Trans. on Intelligent Transport Systems, vol. 13, no.2, pp.724–736, 2012.
[8] T. Kumagai, and T. Akamatsu, “Prediction of Human Driving Behavior Using Dynamic Bayesian Network”, IEICE Trans. of Inf. & Syst., vol. E89-D, No. 2, pp. 857–860, 2006.
[9] R. Mabuchi, and K. Yamada, “Prediction of Driver’s Stop or Go at Yellow Traffic Signal from Vehicle Behavior”, 2013 IEEE Intelligent Vehicles Symposium (IV), pp. 1161–1166, 2013.
[10] M. Liebner, M. Baumann, F. Klanner, and C. Stiller, “Velocity-Based Driver Intent Inference at Urban Intersections in the Presence of Preceding Vehicles”, Intelligent Transportation Systems Magazine Summer 2013, pp.10–21, 2013
[11] K. Lidstrom, and T. Larsson, “Model-based Estimation of Driver Intentions Using Particle Filtering”, 11th International IEEE Conference on Intelligent Transportation Systems, pp. 1177–1182, 2008.
[12] Y. Saito, N. Hashimoto, S. Tsugawa, and S. Kato, “Development of Deceleration Intention Indicating System of Forward Vehicle: Effect of the System”, 15th International IEEE Conference on Intelligent Transportation Systems, pp. 852–857, 2012.
[14] W. A. Schaudt, D. S. Bowman, S. Baker, R. J. Hanowski, and C. Flanigan, “Field Evaluation of an Enhanced Rear Signalling System for Heavy Trucks”, IET Intelligent Transport Systems, Vol. 7, Issue 3, pp. 345-350, 2013.