2017 2nd International Conference on Wireless Communication and Network Engineering (WCNE 2017) ISBN: 978-1-60595-531-5
Design and Analysis of a Six-Dimensional Force Sensor
Guang-yuan LIU
*, Ming-ming DONG, Yu ZHANG
and Chen-chen HE
Beijing Institute of Technology, Beijing
*Corresponding author
Keywords:Six - dimensional force sensor, Finite element method, Elastic body.
Abstract. In order to obtain the force of the foot of a multi-foot robot, a new type of structure based on the sliding axis is proposed. [1] This structure is improved based on the traditional cross beam six-dimensional force sensor. The structural characteristics of the sensor and the principle of force measurement are analyzed. Static and dynamic simulation of the elastic body is carried out by using the finite element method. The deformed cloud, strain cloud, mode shape and natural frequency of the elastic element are obtained.According to the result of finite element analysis, the position of the patch is simulated in the three-dimensional model, and the elastic element of the sensor is decoupled and linearity analyzed. Finally, the calibration matrix of the sensor is obtained.
Introduction
In the sensor used by multi-foot robots, the force sensor is the most basic kind.[2]The six-dimensional force sensor located at the ankle of the multi-foot robot transforms the foot force information into electrical signals and transmits them to the robot's control system to control the servo of each joint so as to realize the multi-foot robot attitude control. Considering the structure and working environment of multi-foot robot, the sensor has the advantages of small size, light weight, high sensitivity and strong anti-interference ability.
At present, the six dimensional force sensors can be divided into two types, one is the parallel mechanism, which is composed of two platforms and the middle of the two platforms. The advantages are that the linear precision and the bearing capacity are better, but the structure is complex and the weight is larger, so it is used in humanoid robot and industrial robot. Another is a delegate with traditional cross beam type monolithic structure, it has the advantage of simple structure and small volume, the disadvantage is that coupling between two dimension is serious, need to be decoupled analysis. Based on the sliding - axis type of cross beam structure, it can eliminate the interdimensional coupling from the principle. Therefore, this paper designs a kind of six-dimensional force sensor based on sliding axis type. The finite element analysis shows that the sensor has the advantages of linear precision and small dimension coupling. [3]
Structure and Working Principle of Six-dimensional Force Sensor
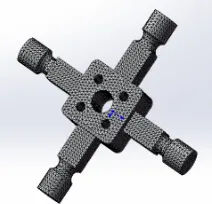
The traditional crossbeam six-dimensional force sensor elastomer includes a main beam and a floating beam, the main beam is a cross-strain elastic elastomer, and the floating beam is an isolating strain plate structure. The main beam is very sensitive to the structure of the floating beam, and the coupling of this structure is serious. The sliding axis is to remove the floating beam of the traditional structure, and by adding the slide structure to the main beam, it can remove the interference from the floating beam. According to the requirements of sensor size and range, the final design structure of this paper is shown in Figure 1.
Figure 1. Sensor structure.
The hole between the sliding axis and the upper and lower base constitutes a moving pair, which can move and rotate along the hole axis. Take Fx as an example, When the sensor receives the force in the x direction, the two elastic beams in the x direction will slide along the x direction, the beams in the y direction will be deformed, and the tensile stress generated by friction will be far less than the bending stress generated by the deformation, so this structure will be better in decoupling performance.[4]The flexible hinge structure can make the deformation position of the deformation beam concentrate to the center station, so as to determine the position of the patch of the sensor. In order to meet the lightweight requirements, the sensor material is made of hard aluminum alloy 2A12
Finite Element Analysis of Sensor Elastomer
In order to obtain the deformation of elastomers under stress, three-dimensional modeling was performedin SolidWorks and the model was imported into SolidWorks Simulation to add load and constraint, and the static analysis and modal analysis were carried out.
Establish Finite Element Model
The unit model adopts the grid of Simulation automatic identification, the precision is high precision, and the number of nodes is 34816 and the unit number is 22158. The finite element model from the grid is shown in Figure 2.
Figure 2. Finite element model of elastomer.
Impose Constraints and Loads
A cylindrical constraint is set on the cylindrical surface of the sliding axis, and the radial displacement is 0. It is loaded according to the maximum value of the sensor range.[5] Considering that the elastic body is symmetric about the X-axis and Y-axis, the force in the six directions of the sensor can be reduced to the following four types:
[image:2.612.253.359.459.561.2]Static Analysis
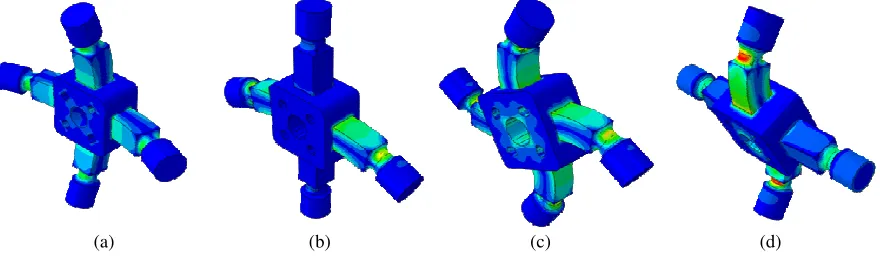
Solve the model and get the strain cloud under four typical conditions.[6] In order to see the strain distribution of the deformable beam, 12 points with uniform distance were taken on the main deforming surface of the deformable beam. Figure 3 shows the deformation of the elastic body under four typical conditions. The maximum stress of the elastic body under the four typical conditions are respectively 658644N m2
⋅ ,31149064N m⋅ 2,32352360N m⋅ 2 and 151557376N m⋅ 2, which are far less than the yield strength of the material, indicating in the full scale load case, the sensor elastomer can work safely.
It can be seen from Figure 3a that under the action of Fz, all four beams produce the same deformation, and the value of Fz can be measured by the deformation of four beams. It can be seen from Figure 3b that under the action of Fy, the two beams in the x direction are deformed and the two beams in the y direction have only a slight amount of slip, which verifies the previous theoretical assumption. The value of Fy can be measured by the deformation of two beams in the x-direction. It can be seen from Figure 3c that under the action of MZ , the four beams produce the same deformation, and the value of MZ can be measured by the deformation of the four beams. It can be seen from Figure 3d that under the action of Mx, the two beams in the y direction are deformed, and the value of Mx can be measured by measuring two beams in the y direction.
It can be seen from the strain value of 12 points on the beam that the closer to the center table, the greater the strain. So the best patch is in the center of the elastic beam near the center.
(a) (b) (c) (d) Figure 3. Elastic body deformation cloud.
Modal Analysis
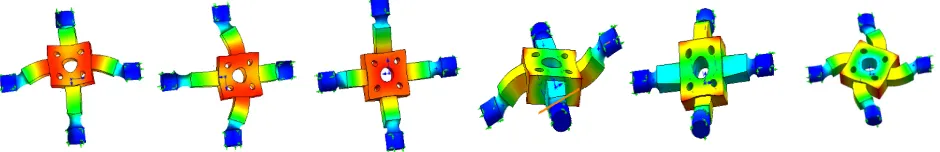
The modal analysis of the elastomer is performed using the same constraints as in the static analysis. The order of the frequencies is chosen to be order 6, and the first six modal and natural frequencies of the elastomer are obtained from the run analysis.The natural frequency is shown in Table 1, and the vibration mode is shown in Figure 4. As can be seen from Table 1 and Figure 4, the first two order natural frequency of elastomer is similar, and the pattern is similar too.The elastic body has a higher natural frequency, the six-dimensional force sensor is a low-pass type sensor, and the two thirds of the natural frequency of the first order is generally used as the working bandwidth.[7]Therefore, the working bandwidth of the sensor is 6583.5Hz, which can meet the demand of robot dynamic test
[image:3.612.87.527.360.491.2]force.
Table 1. Natural frequency of the sixth order of elastomer.
Order 1 2 3 4 5 6
Natural Frequency
Figure 4. Elastomer 6-step formation.
Bridge Scheme
The electric bridge scheme of the resistance strain sensor mainly includes single arm bridge, differential bridge, and full bridge.[8] Because the full bridge has the highest sensitivity, and the elastomer can provide enough strain gauge to paste the dots, the whole bridge is adopted in this design. The circuit diagram of the whole bridge is shown in Figure 5. The principle is as shown in Equation 1.
0
1 2 3 4
1
( )
4 S
U
K
U = ε −ε +ε −ε (1)
In the formula, U0 is the output voltage, and Uis the input voltage, 1
ε
~ε
4 is the change value of the four resistance strain gauge in the bridge, KS is the coefficient.To facilitate the simulation and follow-up analysis, the 16 planes of the four beams were numbered. The specific number is shown in Figure 6. [9] Define a sensor in SolidWorks Simulation, select the corresponding node on each surface, simulate the patch of the sensor, and record the serial number of each node.
[image:4.612.353.479.405.538.2]
Figure 5. The whole bridge circuit. Figure 6. Patch sketch map.
According to the result of finite element analysis, the corresponding deformed face is selected to form the bridge, and the final strain output matrix is obtained. Taking Fy as an example, when the elastomer is only subjected to Fy, the beams I and III are deformed, of which 2,14 are pulled and 4 and 10 are compressed. Connect the four strain gauges into the four arms of the bridge, and set the tensile stress to be positive and the compressive stress to be negative. The two strain gauges with the same symbol are connected to the opposite arms. Let Sf ydenote the strain produced when the elastomer is subjected to Fy, then
4 2 1 0 1 2
f y
S =ε −ε +ε −ε (2)
6 8 14 16
4 2 12 10
1 5 9 13 3 7 11 15
7 5 15 13
3 1 11 9
4 8 12 16 2 6 10 14
fx fy fz Mx My Mz S S S S S S S
ε ε ε ε
ε ε ε ε
ε ε ε ε ε ε ε ε
ε ε ε ε
ε ε ε ε
ε ε ε ε ε ε ε ε
− − + − − + + + + − − − − = = − − + − − + + + + − − − − (3)
Decoupling Calculation Based on Finite Element Method
At present, most of the sensor calibration method is to place the sensor body on a high-precision experimental loading stage, and obtain the voltage value by loading the sensor.[10] After that, the calibration matrix is obtained according to the relationship between voltage and input force to achieve the purpose of calibration and decoupling. In this paper, we establish the relationship between the input force matrix and the strain matrix by applying force in the finite element software, which provides a reference for the calibration of the subsequent loading platform.[11] Based on the assumption that the sensor has a linear operating range, the input and output of the sensor are strictly linear. For six-dimensional force sensors, the input has six components, the output also has six components. The linear relationship is shown in Equation 4.
F =CV (4) Where F represents the matrix of input, C is the calibration matrix, and V is the output matrix. According to the principle of the bridge,
'
=
F C K S⋅ ⋅ =C S (5)
Equation 5 shows the relationship between the input force and the output strain. In this paper, the finite element method is used to find the matrix, which provides a reference for the calibration of the sensor.
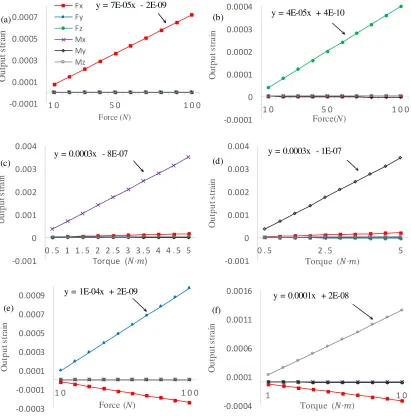
In SolidWorks Simulation, the elastomer is loaded from 0 to full range. After each load, the strain value of 16 measurement points is obtained. After the analysis of the strain output matrix, the output strain value of the bridge is obtained.[12] Use this data to plot points and solve the least-squares curve as the calibration curve of the sensor. As shown in Figure 7.
Finite element analysis shows that the linearity of the sensor is good and can be decoupled based on the Kramer's rule. The full-scale force and strain output matrices can be brought into Equation 5 to obtain the calibration matrix. As shown in Equation 6.
'
1394.8 350 0.2 61.8 83.5 359.9
2.1 1025.6 1 6.6 2.8 0.8
0.8 1 2502.6 1.9 37.6 8.4
1.2 0.3 1.3 286.2 0.1 0.3
0.1 0.2 3.7 0.1 288.7 0.7
0.8 0.1 1.7 0.1 4.4 779.1
C − − − − − − − − = − − − − − − − − (6)
-0.0001 0 0.0001 0.0002 0.0003 0.0004
1 0 5 0 1 0 0
O u tp u t s tr a in
Force(N)
(b) y = 4E-05x + 4E-10
-0.001 0 0.001 0.002 0.003 0.004
0 . 5 1 1 . 5 2 2 . 5 3 3 . 5 4 4 . 5 5
O u tp u t s tr a in
Torque (ܰ∙݉) (c)
y = 0.0003x - 8E-07 -0.0001
0.0001 0.0003 0.0005 0.0007
1 0 5 0 1 0 0
O u tp u t st ra in
Force (N)
Fx Fy Fz Mx My Mz (a)
y = 7E-05x - 2E-09
-0.001 0 0.001 0.002 0.003 0.004
0 . 5 2 . 5 5
O u tp u t s tr a in
Torque (ܰ·݉) (d)
y = 0.0003x - 1E-07
-0.0003 -0.0001 0.0001 0.0003 0.0005 0.0007 0.0009
1 0 1 0 0
O u tp u t s tr a in
Force (N)
(e)
y = 1E-04x + 2E-09
-0.0004 0.0001 0.0006 0.0011 0.0016
1 1 0
O u tp u t s tr a in
Torque (ܰ·݉) (f)
[image:6.612.101.512.81.500.2]y = 0.0001x + 2E-08
Figure 7. Calibration curve.
Conclusion
Based on the six-dimensional force sensor with traditional cross-beam structure, this paper designs a six-axis force sensor based on the slide axis. After the finite element simulation analysis found that this type of sensor has good linearity and high first-order natural frequency, and greatly reduces the traditional cross-beam structure of the coupling problem.
References
[1] Gao Jun, Feng Hua-shan, Design of Four-legged Bionic Robot Six-dimensional Force Sensor, Design and Research, 2010(2):21-24.
[2] Liu Zheng-shi, Wang Yong, Structure Design of Multiaxial Sensor for Underwater, China Mechanical Engineering, 2007(20):2481-2485.
[4] Antoine J F, Visa C, Sauvey C, et al. Approximate Analytical Model for Hertzian Elliptical Contact Problems[J]. ASME Journal of Tribology , 2006,128: 660-664.
[5] Willner K. Elasto-plastic Normal Contact of Three-dimensional Fractal Surfaces Using Half-space Theory [J]. ASME Journal of Tribology, 2004, 126: 28-33.
[6] B. Shimano. On Force sensing information and its use in controlling Manipulators [A].Proc. Of the 8th Int. Symposium on Industrial Robots, 1979.
[7] G. Folchi, G.Shelton, S. Wang. Six Degree of Freedom Force Transducer for a Manipulator System [J]. International Business Machines Corporation, 1975: 591-998.
[8] P. Watson, S. Drake. Pedestal wrist force sensors for industrial assembly[C].The 5th International Symposium on industrial robots, 1975: 501-511.
[9] Williams J A. The Influence of Repeated Loading Residual Stresses and Shakedown on the Behaviour of Tribological Contacts [J]. Tribology International, 2005, 38: 786-797.
[10] Masaaki Minakawa, Jun Nakahara, Jiro Ninomiya. etc. Method for measuring force transmitted from road surface to tires and its applications. JSAE Review, 1999, 20: 479~485.
[11] Walter Meiblen, Haus Kockelmann, Hans Burkard. Evaluation of Different Designs of wheel Force Transducers (part II). SAE paper [J/OL]. 1999-01-1037.