2017 2nd International Conference on Communications, Information Management and Network Security (CIMNS 2017) ISBN: 978-1-60595-498-1
The Evaluation System of the Image Quality with Subjective
and Objective Uniformity
Bo-han NIU
1,*and Tian-chang YANG
21School of Information and Communication Engineering, Beijing University of Posts and Telecommunications, Beijing, China
2
Beijing Key Lab of Intelligent Telecommunication Software and Multimedia, School of Computer Science, Beijing University of Posts and Telecommunications, Beijing, China
*Corresponding author
Keywords: Image quality evaluation, Subjective assessment, Objective criteria.
Abstract. Image quality evaluation standard mainly relied on the traditional standard like peak signal to noise ratio (PSNR), but PSNR does not meet people’s subjective assessment. To obtain more accurate evaluation with subjective and objective uniformity, the multi-indexes are considered. Our evaluation system includes three parts: (1) grade evaluation; (2) auxiliary evaluation; (3) reference evaluation. The value of grade evaluation is mainly determined by the grade evaluation, and minor modifications are made by the auxiliary evaluation. The reference evaluation provides the traditional objective standards so as to comparative analysis. The results of actual operation show that it is comprehensive and effective.
Introduction
People can easily produce a large number of digital images with the help of the camera or smart mobile phone. However, for some special purposes, such as watermarking, the digital photos need to be appropriately modified. Watermarking algorithm, which can also be called information disguise technology, means that information is embedded to the images without being noticed by human’s visual sense. The designer seeks an algorithm with a high embedding rate as well as a low distortion factor. But how to evaluate the quality of watermarking algorithms is a challenging problem, and the image processing is also facing the same problem.
Image quality evaluation is usually divided into subjective assessment and objective calculation. ITU-R BT.500-11 RECOMMENDATION Methodology for the subjective assessment of the quality of pictures is adopted as subjective assessment. The most common objective method to evaluate the quality of an image is using Peak Signal to Noise Ratio (PSNR) [1]. It is commonly believed that a larger PSNR implies better quality. But it is obvious that there is a big difference between PSNR and the supervisor’s evaluation by simple calculation. For example, if the same modification of an image is selected in human sensitive and non-sensitive parts of the image respectively, the difference of PSNR will be very small, while the difference of evaluations given by human viewers will be relatively large [2].
masking can be obtained literatures [5]. In [6], we built the corresponding relation between subjective evaluation criteria and objective assessment by JND model.
However, with the objective measures of SHSIM and JND, we can also note that the deviation of the subjective value and objective value. We recognize that the single objective evaluation index is difficult to reflect the image quality overall accurately. Therefore, a variety of objective indicators will be considered in the evaluation system with subjective and objective uniformity.
The rest of the paper is organized as follows. Section II introduces the related objective criteria. The design of the evaluation system is proposed in Section III. The performance of evaluation system has been demonstrated in Section IV, and Section V concludes the paper.
The Related Objective Criteria
The objective quality measurements are save time more than subjective quality measurement. A traditional way to judge the quality of an image uses peak signal to noise ratio (PSNR). Similar indicators besides PSNR, as well as mean squared error (MSE), signal-to-noise ratio (SNR), mean absolute difference (MAD), Laplacian Mean Square Error (LMSE), Normalized Cross Correlation (NCC) and etc. [1]
In statistics, the mean squared error (MSE) or mean squared deviation (MSD) measures the average of the squares of the errors or deviations—that is, the difference between the estimator and what is estimated. SNR is defined as the ratio of signal power to the noise power, often expressed in decibels. The mean absolute difference (MAD) is a measure of statistical dispersion equal to the average absolute difference of two independent values drawn from a probability distribution. Laplacian Mean Square Error (LMSE) is based on the importance of edges measurement. The small value of Laplacian Mean Square Error (LMSE) means that image is in a good quality. In signal processing, Normalized Cross Correlation (NCC) is a measure of similarity of two series as a function of the displacement of one relative to the other. If the numerical value is closer to 1, the similarity is the better between the two images.
PSNR and the other objective quality measurements above are good distortion indicators for random errors but not for structured or correlated errors, and not consistent with SHSIM and JND. PSNR and the other objective quality measurements above are not suitable subjective scales to evaluate the image quality.
JND index can be used to image quality evaluation based on HVS, but it cannot give the cause of image quality damage. SHSIM index can give the better evaluation as well as the cause of damage in terms of structure and hue similarity. In order to reveal more causes of image damage, the following indicators are introduced:
Pixel Histogram Distribution. The watermarking algorithm with good performance do not modify the frequency distribution of the pixel values of the image largely, which results in significant differences in the frequency distribution of the pixel values. If the estimated image is compared with the original image, the frequency of a pixel has changed a lot, and “the singular point” of the frequency distribution occurs [7].
Image Regional Characteristics. Because of the modification for the original image is different, it will make the changes of the regional characteristics, and the ratio of the number of regional changes in the block characteristics to the total number of blocks will be as an objective measure for modification of image characteristics.
Image Edge Contour. The changes of the edge contour image are adopted as an objective index to describe the extent to which an image is modified [8].
Difference Image Density Uniformity. The objective measure of the difference image density uniformity includes three parts: the extraction of the edge contour of the difference image, the calculation of the density of the block and the gradient change between the blocks.
In order to implement the image quality evaluation with subjective and objective uniformity accurately, all objective measurements above are considered.
The Design of the Evaluation System
According to the performance of indicators, the indicators above were divided into three groups: grade evaluation group (including SHSIM and JND), auxiliary evaluation group (including pixel histogram distribution, image regional characteristics, image edge contour, difference image density uniformity, and image distortion measurement) and reference evaluation group (including PSNR, MSE, SNR, MAD, LMSE, and NCC).
Since objective index of structure and hue similarity can reflect the human visual system on image quality changes and it can also distinguish the visual observation and capture the difference between images well, we have set up the corresponding relation between ITU-R quality and impairment scales model and objective assessment based on SHSIM from these three aspects as structure, color space and human visual system [2]. The empirical mapping between ITU-R quality and impairment scales model and SHSIM objective assessment for gray image quality evaluation is listed below.
2 2
2
3.263808 0 0.89
( ) 49.2210548 76.768456 31.929512 0.89 0.99
8399.999999 166631.999999 8236.999999 0.99 1
ssim ssim
g ssim ssim ssim ssim
ssim ssim ssim
(1)
where ssim is the index value calculated by SSIM model [3], g(ssim) is the corresponding score of subjective assessment by the above empirical mapping function.
The empirical mapping for color image quality evaluation is established as follows:
2
2
2
1.070620 2.664690 0 0.89
( ) 63.351801 105.797507 47.198432 0.89 0.99
1499.999999 2939.999999 1444.999999 0.99 1
shsim shsim ssim
g shsim shsim shsim ssim
shsim shsim ssim
(2)
where shsim is the index value calculated by SHSIM model [3], g(shsim) is the corresponding score of subjective assessment by the above empirical mapping function.
In order to improve the accuracy of the image quality evaluation model with subjective and objective uniformity, Watson Just Noticeable Difference (JND) model is introduced, the corresponding relation between ITU-R quality and impairment scales model and objective assessment by JND model is built [6]. The following empirical mapping is the function between the JND objective index and the evaluation grade for the case of gray image.
2
2
2
0.001659019 0.0 30.33
0.002152782 0.337039562 8.191728494 30.33 53.79
( )
0.000760448 0.144485047 1.863039754 53.79 95.00
5.0
jnd jnd
jnd jnd jnd
g jnd
jnd jnd jnd
95.00 jnd (3) The empirical mapping for color image quality evaluation is established as follows:
2 2
2
0.002158895 0.0 23.16
0.001721206 0.264646129 5.155974445 23.16 62.89 ( )
0.000743879 0.124995901 0.238847784 62.89 80.00 5.0
jnd jnd
jnd jnd jnd
g jnd
jnd jnd jnd
where jnd is the index value calculated by JND model [5], g(jnd) is the corresponding score of subjective assessment grade given by the above empirical mapping function.
Although the indicators of the auxiliary evaluation group are not consistent with the human’s visual judgment, we still set up the empirical mapping function between grade quality evaluation and these objective assessments so that people can find the causes of impairment scales damaged by image modifications.
The comprehensive value of grade quality evaluation is mainly determined by the weighted sum of JND and SSIM grade, but the auxiliary evaluations also make adjustments to fine-tune the grade value to better agreement with the human’s visual judgment.
The empirical mapping between grade quality evaluation and pixel histogram distribution objective assessment is established as follows:
2
6.25 1.25
score corrObj corrObj (5) Where scoreis the grade quality evaluation value , corrObj is the image pixel number frequency objective measurement.
Similarly, the corresponding relation amoung ITU-R quality and image regional characteristics, image edge contour, difference image density uniformity and image distortion measurement also can be given by the empirical mapping respectively. But the corresponding relation for gray image and color image should be given separately.
In synthesizing the factor, the value of grade evaluation mainly determined by the grade evaluation group and minor modifications made by the auxiliary evaluation group are the main framework of system software design. The auxiliary evaluation will point out the causes of impairment scales, and the reference evaluation is so as to comparative analysis.
The Performance of the Evaluation System
Our system is programmed by C++. The evaluation report is composed by three parts: grade evaluation, auxiliary evaluation and reference evaluation.
The running results given below verified the performance of the system. First, input the following two images Figure1(a) and (b).
(a) The original image (b) The estimated image (c) SHSIM index map Figure 1. The input images and index map
The SHSIM grade value is 4.1727, and the SHSIM index map is given by Figure 1(c). The JND grade value is 4.3384.
The auxiliary evaluations are the following:
(a) The blue component (b) The green component (c) The red component
Figure 2. Image pixel number frequency.
The image regional characteristics grade value is 4.2169, the region characteristics and changes of the blue component of the image are shown as Figure 3. The region characteristics images of the other color components can be given similarly.
[image:5.595.140.457.68.186.2]
(a)The original (b) The estimated (c) The variety of characteristics Figure 3. Image blue component regional characteristics.
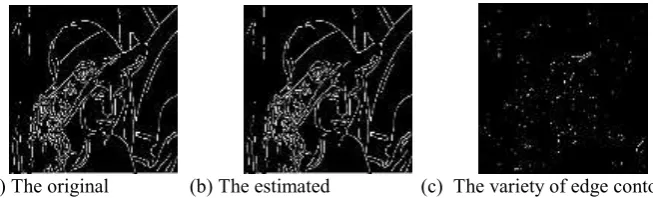
The image edge contour grade value is 4.6867, the edge contour image and changes of the green component of the image are shown as Figure 4. The edge contour images of the other color components can be obtained similarly.
[image:5.595.94.471.253.356.2]
(a) The original (b) The estimated (c) The variety of edge contour Figure 4. Image green component edge contour.
The difference image density uniformity grade value is 2.8706, the difference image and edge contour of the red component of the image are shown as Figure 5. Similarly, the edge contour images of the other color components feature graphs can be drawn.
(a) The difference image (b) Edge contour Figure 5. difference image and edge contour.
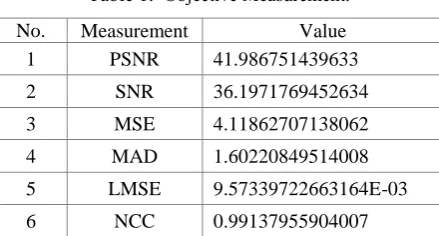
[image:5.595.133.460.435.534.2]Table 1. Objective Measurement.
No. Measurement Value
1 PSNR 41.986751439633
2 SNR 36.1971769452634
3 MSE 4.11862707138062
4 MAD 1.60220849514008
5 LMSE 9.57339722663164E-03
6 NCC 0.99137955904007
The total grade value is obtained as 4.210013, belong to 4-good. By the above evaluation, the factors that affect the performance of the evaluated image are as follows: (1) histogram distribution; (2) image regional characteristics; (3) difference image density uniformity.
The evaluation system we implemented is timesaving, laborsaving and more accurate than the manual. Compared with our earlier research work, it offers a more accurate and comprehensive evaluation.
Summary
The evaluation system of the image quality with subjective and objective uniformity includes three parts: (1) grade evaluation; (2) auxiliary evaluation; (3) reference evaluation. The value of grade evaluation is mainly determined by the grade evaluation group, but minor modifications are made by the auxiliary evaluation group. At the same time, the causes of damage to the estimated image are pointed out at pixel histogram distribution, image regional characteristics, image edge contour, difference image density uniformity, and image distortion measurement. The traditional objective standards are provided by reference evaluation group so as to comparative analysis.
Our evaluation system is easy to calculate, and can be carried out at any time. The results of actual operation show that it is comprehensive and effective.
Acknowledgement
This research was supported by Beijing Key Lab of Intelligent Telecommunication Software and Multimedia, Beijing University of Posts and Telecommunications.
References
[1] Ratchakit Sakuldee, and Somkait Udomhunsakul. Objective Performance of Compressed Image Quality Assessments Proceedings of World Academy of Science, Engineering and Technology Vol. 26, Dec. 2007 ISSN 1307-6884.
[2] Niu, Bohan; Yang, Zhenghong. An image subjective quality evaluation model based on structural similarity, Proceedings of 2015 IEEE 16th International Conference on Communication Technology, ICCT 2015, Hangzhou, China, October 18-20, 2015.
[3] Yunyu Shi, Youdong Ding, Ranran Zhang, Jun Li. Structure and Hue Similarity for Color Image Quality Assessment. 2009 International Conference on Electronic Computer Technology. 2009 IEEE.
[4] Watson, A. B., Borthwick, R., Taylor, M.: Image Quality and Entropy Masking. Proceedings of SPIE - The International Society for Optical Engineering, vol. 3016, pp. 2-12 (1997).
[5] Zhang, X.H., Lin, W.S., Xue, P.: Just-noticeable Difference Estimation with Pixels in Images. Journal of Visual Communication & Image Representation, vol. 19, pp. 30-41 (2008).
[6] Bohan Niu. An Improvement Image Subjective Quality Evaluation Model Based on Just Noticeable Difference. Advances in Intelligent Watermarking and Multimedia Signal Processing, Proceeding of the Twelfth International Conference on Intelligent Watermarking and Multimedia Signal Processing, Volume 2, pp93-100, November, 21-23, 2016, Kaohsiung, Taiwan.