London School of Economics and Political
Science
Aspects of Multinational
Enterprises in the Global
Economy:
Location, Organisation and
Impact
Andrea Ascani
2
Declaration
I certify that the thesis I have presented for examination for the MPhil/PhD degree of the London School of Economics and Political Science is solely my own work other than where I have clearly indicated that it is the work of others (in which case the extent of any work carried out jointly by me and any other person is clearly identified in it).
The copyright of this thesis rests with the author. Quotation from it is permitted, provided that full acknowledgement is made. This thesis may not be reproduced without my prior written consent.
I warrant that this authorisation does not, to the best of my belief, infringe the rights of any third party.
I declare that my thesis consists of 51,901 words.
Statement of conjoint work
I confirm that Chapters 1, 2 and 3 were jointly co-authored with Professor Iammarino and Dr Crescenzi. I contributed 50% of the work in Chapters 1 and 2, and 66% in Chapter 3.
I also confirm that Chapter 5 was jointly co-authored with Dr Gagliardi and I contributed to 50% of this work.
London, 15th July 2015
3
Abstract
The role played by Multinational Enterprises (MNEs) in the global economy is becoming increasingly relevant as they shape sectorial, regional and national trajectories of economic development through their cross-border activities and behaviour. This thesis investigates how the characteristics of MNEs, their activities and location-specific attributes interact with each other and shape both behaviour and choices of MNEs and the impact of foreign direct investment (FDI). The thesis is structured into a general Introduction, aimed at guiding the reader throughout the thesis and providing a broad conceptual framework, and three analytical Parts focusing on (i) MNE greenfield investment location strategies, (ii) MNE selection decisions in cross-border acquisitions and (iii) impact of MNE operations on host regions.
4
neighbouring countries in recent years. Subsequently, in Chapter 3, particular attention is devoted to the empirical analysis of the spatial distribution of MNE activities in relation to differences in terms of economic institutions of the host locations. This specific line of research is based on an innovative quantitative approach to the study of MNE location strategies in terms of greenfield FDI in the sample of neighbouring countries of the EU. In particular, Chapter 3 focuses on the heterogeneous location strategies of MNEs with respect to location attributes. Overall, the main findings of Part I of the thesis not only suggest that the traditional drivers of FDI emphasised in the existing literature, such as market access and cost-saving factors, still represent relevant elements for MNE behaviour, but it is also highlighted that MNE specificities are crucial to understand investment choices and that industry-wide differences can influence both entry modes and the location decisions of MNEs. The most innovative contribution of Part I, however, is related to Chapter 3, where the quantitative analysis of MNE location behaviour by means of Mixed Logit models suggests that MNEs have heterogeneous preferences with respect to location characteristics, especially economic institutions. This indicates that MNE strategies are highly diverse and the previous quantitative literature may have underestimated the complexity of the interaction between MNEs characteristics and location attributes.
5
under analysis in the period 1997-2013, the latter motivation tends to be more relevant. This is in line with market access motives operating at the firm level, differently from other studies on FDI and acquisitions focusing on the industry- or country-wide level of analysis. Evidence in favour of strategic-asset seeking strategies of MNEs acquiring European firms, instead, remains weak. Therefore, this Chapter highlights that domestic firms engaging in the generation of successful business linkages within or across national markets can represent a valuable target for MNE cross-border acquisition decisions.
Finally, building on the previous sections on the determinants of location choices and selection patterns in cross-border takeovers, Part III of the thesis focuses on the impact of FDI on recipient areas in terms of their innovation potential. Chapter 5 is developed as a quantitative analysis with the specific objective of isolating the causal effect of MNE operations on the innovative performance of host regions. This is investigated by employing NUTS-3 level data on Italy for the period 2001-2006. The empirical analysis is supported by the implementation of an Instrumental Variable (IV) strategy in order to tackle potential endogeneity bias in the estimation of FDI-induced spillovers. This Chapter contributes to the existing debate by focusing on the geographical level of FDI externalities, whereas the great majority of past studies mainly investigate industry-wide effects. Results suggest that the presence of FDI in a location contributes to fostering the innovative performance of the local economy. Therefore, MNEs can be seen as carriers of superior knowledge and new organisational practices that spill over space to the benefit of domestic firms. In a policy-making perspective, this provides a clear rationale for the attraction of FDI as an international channel for knowledge sourcing.
6
7
Contents
Contents... 7
List of Tables ... 10
List of figures ... 12
Acknowledgements ... 13
Introduction ... 15
I. Overview ... 15
II. Broad conceptual framework ... 16
III. Aim and structure of the thesis ... 20
Part I - MNE location strategies ... 21
Part II – Selection patterns in cross-border acquisitions ... 23
Part III – The impact of FDI on recipient economies ... 23
IV. Concluding remarks ... 24
Part I: MNE Location Strategies ... 27
Chapter 1 - The geography of foreign investments in the EU Neighbourhood ... 28
1.1 Introduction ... 28
1.2 Literature background: the drivers of FDI into the EU neighbourhood ... 30
1.3 Stylised facts on FDI in the EU neighbourhood ... 33
1.4 FDI in the EU neighbourhood: methodology ... 36
1.5 Results ... 39
1.6 Conclusions ... 44
Appendix A... 53
Chapter 2 – What drives European multinationals to the EU neighbouring countries? A mixed methods analysis of Italian investment strategies ... 54
2.1 Introduction ... 54
2.2 Italian Foreign Investments in EU New Member States and Neighbouring Countries ... 58
2.3 Quantitative analysis ... 62
8
2.4 Results and discussion ... 66
2.5 Qualitative analysis ... 69
2.5.1 MNEs profiles ... 69
2.5.2 Analysis of the interviews with executives ... 72
2.6 Conclusions ... 78
Appendix B ... 86
Chapter 3 – Economic Institutions and the Location Strategies of European Multinationals in their Geographical Neighbourhood ... 88
3.1 Introduction ... 88
3.2 MNEs location strategies, host economy advantages and institutional conditions ... 91
3.2.1 MNEs and host economy advantages ... 91
3.2.2 Economic institutions and MNEs investments ... 94
3.3 Data ... 99
3.3.1 MNE Investment ... 99
3.3.2 Institutional Conditions ...101
3.3.3 Other location drivers ...103
3.4 Methodology ...106
3.4.1 Capturing MNEs heterogeneous preferences for economic institutions: Mixed Logit Models ...106
3.5 Empirical Results ...109
3.5.1 Baseline results ...109
3.5.2 Preference heterogeneity ...111
3.6 Conclusions ...118
Appendix C ...131
Part II: Selection Patterns in Cross-border Acquisitions ...134
Chapter 4 – Cross-border acquisitions and patterns of selection: Productivity vs. profitability ...135
4.1 Introduction ...135
4.2 Related literature...138
4.2.1 Acquisitions to access foreign productive assets ...139
4.2.2 Acquisitions to access foreign markets ...142
4.2.3 Hypotheses development ...143
4.3 Data ...144
9
4.3.2 Variables construction ...146
4.4 Empirical strategy ...149
4.5 Results ...152
4.5.1 Probability of foreign acquisition: baseline estimates ...152
4.5.2 Evidence from alternative measures of profitability and productivity...155
4.5.3 Non-linearity in within-firm probability of foreign acquisition ...158
4.5.4 Foreign acquisitions and technology ...160
4.5.5 Completed and majority foreign acquisitions ...162
4.5.6 Evidence from acquisition targets only...163
4.6 Conclusions ...164
Part III: The Impact of FDI on Recipient Economies ...178
Chapter 5 – Inward FDI and Local Innovative Performance. An empirical investigation on Italian provinces ...179
5.1 Introduction ...179
5.2 Conceptual background and literature review ...181
5.3 Data ...184
5.4 Methodology ...187
5.5 Results and discussion ...191
5.6 Robustness Checks ...195
5.7 Conclusion ...197
10
List of Tables
Table 1.1: FDI into the EU neighbourhood ... 47
Table 1.2: FDI into the EU neighbourhood by business function ... 48
Table 1.3: FDI into the EU neighbourhood by macro-sector ... 49
Table 1.4: FDI determinants into the EU neighbourhood ... 50
Table 1.5: FDI determinants in the EU neighbourhood by business function ... 51
Table 1.6: FDI determinants in the EU neighbourhood by macro-sector 52 Table 2.1: Italian new foreign operations in the EU NMs and NCs ... 81
Table 2.2: Italian new foreign operations in the EU NMs and NCs by business activity... 82
Table 2.3: Italian new foreign operations in the EU NMS and NCs by sector ... 83
Table 2.4: Poisson regression results ... 84
Table 2.5: Summary Table of Case Studies ... 85
Table 3.1: EU-15 investment projects and quality of economic institutions, 2003-2008. ...122
Table 3.2: Conditional Logit estimation of EU15 MNEs location behaviour ...123
Table 3.3: Mixed Logit estimation of MNEs location behaviour ...124
Table 3.4: MXL estimation of EU-15 MNEs location behaviour by sector ...126
Table 3.5: MXL estimation of EU-15 MNEs location behaviour by business function ...128
Table 3.6: Summary Table of the Results on MNEs heterogeneous preferences for Economic Institutions ...130
Table 4.1: Firms and acquisitions by country, 1997-2013 ...168
11
Table 4.3: Descriptive statistics ...170
Table 4.4: Probability of foreign acquisition...171
Table 4.5: Alternative measures for profitability and labour productivity ...172
Table 4.6: Foreign acquisitions and total factor productivity ...173
Table 4.7: Interaction effect between firm profitability and labour productivity ...174
Table 4.8: Probability of foreign acquisition by technological class ...175
Table 4.9: Completed and majority acquisitions ...176
Table 4.10: Restricted sample ...177
Table 5.1: Variables List ...202
Table 5.2: Inward FDI and Local Innovative Performance ...203
Table 5.3: First Stage Regression ...204
Table 5.4: First Stage Statistics ...204
Table 5.5: Model Specification ...205
Table 5.6: Reduced Form Equation ...206
Table 5.7: Market Exit ...206
12
List of figures
Figure 1: Growth of FDI, trade and GDP in the world, 1970-2010 ... 26 Figure 3.1: Probability Density Functions for economic institutions
exhibiting significant standard deviation in Table 3 ...125 Figure 3.2: Probability Density Functions for economic institutions
exhibiting significant standard deviation in Table 4 ...127 Figure 3.3: Probability Density Functions for economic institutions
13
Acknowledgements
I would like to thank to Simona Iammarino and Riccardo Crescenzi for outstanding supervision and encouragement, and all members of my family for unconditional love and tireless support.
Thanks to Giulia Faggio, Luisa Gagliardi, Steve Gibbons, Neil Lee, Henry Overman, Olmo Silva and Michael Storper for help, advice and ideas along the way.
I also would like to thank Davide Castellani and Xiaming Liu for their feedback and suggestions.
Thanks also to Chinchih Chen, Marco Di Cataldo, Mara Giua, Alex Jaax, Davide Luca, Paolo Lucchino, Paula Prenzel, Alessandra Scandura, Teresa Schlueter, Alessandro Sforza, Maria Sanchez-Vidal and Stefanie Vollmer for friendship and support.
Previous versions of the chapters of this thesis were presented at the following conferences and seminars: 2nd SEARCH meeting, University of Cagliari & CRENoS (September, 2012); Workshop on Innovation,
Productivity and Growth in Italy, University of Calabria (March 2013); XIV
April International Academic Conference on Economic and Social
Development, Moscow Higher School of Economics (April, 2013); XI Triple
Helix Conference, Birkbeck College, London (July, 2013); 53rd ERSA
14
University of Rome ‘La Sapienza’ (September, 2013); Regional Studies
Association Winter Conference, London (November, 2014); Academy of
International Business Conference, Bangalore (June, 2015); 62nd Annual
North American Meeting of the Regional Science Association International; various PhD Work-in-Progress seminars in Economic Geography, London School of Economics. Thanks to participants and discussants for helpful feedback.
The research leading to the results of the first three chapters has received funding from the Project “Sharing KnowledgE Assets: InteRregionally Cohesive NeigHborhoods” (SEARCH) within the 7th European Community Framework Programme FP7-SSH - 2010.2.2-1 (266834) European Commission.
This PhD thesis was also supported by funding from the doctoral studentship of the UK Economic and Social Research Council (ESRC).
15
Introduction
I. Overview
This thesis explores how Multinational Enterprises (MNEs) shape the international organisation of economic activity through Foreign Direct Investment (FDI), by focusing on a number of relevant aspects that are – to different extents – still partially addressed by existing studies, or subject to mixed and inconclusive empirical evidence. This thesis aims at filling some of the research gaps that characterise the literature, albeit this being vast and well-established. The thesis’ structure consists of the present introductory section and five empirical chapters divided into three conceptual parts associated with different aspects of MNE activity. Each chapter of the thesis includes an introduction, a scrutiny of the literature with a presentation of the hypotheses, a description of data and methodology, a discussion of results and a final section devoted to concluding remarks, limitations and future research directions.
The relevance of MNEs in the global economy has dramatically increased in the last decades, as evidenced by the astonishing spur in the global growth rate of FDI since the mid-1980s and the consequent outpacing of world exports and nominal GDP growth rates. Figure 1 illustrates this noticeable trend employing data from the United Nations Conference on Trade and Development (UNCTAD), the well-known international organisation that, in response to the unprecedented role played by MNEs in the world economy, inaugurated in 1991 a series of yearly studies to debate the characteristics, drivers and trends of FDI, and currently publishing the 25th edition of the World Investment Report.
16
company located in the country of origin, while the firm receiving the FDI is defined as foreign affiliate or subsidiary and it is located in the destination country1. At the simplest level, FDI modes can be classified
into greenfield investment and cross-border mergers and acquisitions (M&A). The former encompasses the establishment a completely new plant in a foreign location, whereas the latter entails the acquisition of a certain stake of ownership in a pre-existing company abroad.
The objective of this introductory section is to provide a general background framework for the thesis, describe its motivation, explain the research aims and illustrate the structure and main content of the various chapters. In particular, the next section discusses the basic ideas that underpin the conceptualisation of MNEs in academic research. Subsequently, the structure of the thesis is described and a summary of each chapter’s objective, results and original contribution is offered. Finally, a concluding section summarises the inner logic of the thesis, its novelty and outlines some directions for future research.
[Figure 1 here]
II. Broad conceptual framework
The existence and importance of MNEs has received the attention of scholars for decades, even before the enormous global increase in multinational activity. A plethora of conceptual explanations, drawing on diverse theoretical traditions, has been provided over the years to understand and analyse the behaviour and strategies of MNEs. A fundamental theoretical and empirical puzzle that academic research has attempted to solve is associated to the existence of firms that decide to become multinational. The tentative explanations of this aspect have
1 For the purpose of this thesis we use the notions of foreign affiliate and foreign subsidiary
17
been underpinned by numerous hypotheses formulated over time. The aim of this section is to review the main conceptual contributions to this debate in order to provide a general framework for the various chapters of the thesis, where more detailed aspects of MNEs will be analysed. Therefore, this section will clarify the conceptual factors that have been hypothesised by scholars as crucial for MNEs to exist, while the specific conceptual frameworks associated to the distinct aspects investigated in this thesis are developed in dedicated sections within the various chapters.
The seminal work of Hymer (1976/1960) and Kindleberger (1969) provides the starting point for a conceptualisation that explains consistently why some firms engage in cross-border activities. Their basic insight is that domestic firms tend to have specific advantages over foreign firms when serving their domestic market. These advantages are embodied in the domestic nature of local firms and range from better information about the local economy and customers’ tastes to greater familiarity with the political and legal system. Hence, foreign firms that wish to operate in foreign markets have to offset their disadvantages over domestic actors by increasing their efficiency. This is possible through the acquisition of firm-specific advantages, which may vary from economies of scale and product differentiation, to technological advantages and access to cheaper factors of production. While insightful, this conceptualisation does not help to explain why firms decide to locate in a foreign country. In fact, even if foreign firms have specific advantages over domestic firms, they may prefer to serve distant markets by exports.
18
(normally a developed country). In the second stage, the product becomes mature and it is exported. In this phase, demand grows in foreign markets and the firm may decide to invest abroad to serve those markets locally: thus, in this stage production gradually moves to foreign countries (mainly other developed economies). Third, the product is standardised and more firms are able to produce it. As a consequence, price competition leads firms to invest in locations that make a reduction in production costs possible (mainly developing countries). While this theory provides an insightful conceptualisation of MNEs in innovative industries, it does not offer a strong explanation for FDI in lower technology sectors. Furthermore, this theory entails a simplistic and reductive view of the innovation process, overlooking the complexity of MNE innovative activities (Iammarino and McCann, 2013)
The occurrence of FDI has also been explored in terms of attempts of firms to limit the market power of their competitors. According to this hypothesis, oligopolistic firms follow similar FDI strategies as a way to countering the advantages of other competing firms. Therefore, foreign investment is considered as an oligopolistic reaction with the aim of offsetting the competitive edge of similar firms (e.g. Knickerbrocker, 1973; Flowers 1976; Yu and Ito, 1988). An important limitation of this theory is that its logic implies that more intense competition on world markets is very likely to lead to less oligopolistic reaction and, as a consequence, lower volumes of FDI. However, direct observation of world trends shows that nowadays there is stronger competition and higher volumes of FDI.
19
organisational structure and to operate exchanges within the boundaries of the firm across national borders. In other words, firms become multinationals in order to avoid imperfections such as market uncertainty, wastes of time and resources and asymmetric information. In this sense, some firms prefer to open a subsidiary in another country and to trade with it rather than licensing to local firms or exporting.
20
stool is only functional if the three legs are evenly balanced” (Dunning, 2009:5). The eclectic OLI paradigm, therefore, provides a convincing and flexible conceptualisation of MNE existence and behaviour, although being lacking under other aspects. For instance, the geography of MNEs remains loosely specified in its (L) advantages, calling for further for investigation (Iammarino and McCann, 2013).
More recently, the study of MNE has also grown in the international trade literature, where the combination of the Krugman (1980) model based on product differentiation and monopolistic competition with the notion of firm heterogeneity (Melitz, 2003) has allowed to overcoming formal problems in modelling MNE activity. In this respect, a relevant implication of firm heterogeneity for the study of MNE is related to the intra-industry diversity of internationalisation modes as a response to differences in the accumulation of knowledge across MNEs (Castellani and Zanfei, 2006).
III. Aim and structure of the thesis
21
As mentioned above, the thesis is divided into three main parts containing five chapters. The first part contains three chapters while the remaining two parts are constituted by one chapter each.
Part I - MNE location strategies
In the first part, this thesis examines the location behaviour of European MNEs with respect to a number of drivers that are under-explored in the literature. The first chapter offers an explorative analysis of MNE location choices in countries linked to the ‘core’ of the European Union (EU-15) by different degrees of functional, economic and political integration: the EU 'New' Member states, Accession and Candidate countries, European Neighbourhood Policy countries, as well as Russia. Understanding the drivers of Foreign Investment (FDI) in these countries is highly relevant in consideration of their increasing integration into the global market and the strong influence exerted by the EU on this process. By employing data on individual greenfield investment projects, this chapter aims at disentangling the drivers of FDI in these countries for different industrial sectors, business functions and investment origins. The empirical results suggest that FDI in the area tends to follow market-seeking and efficiency-oriented strategies, and show path-dependency and concentration patterns that may reinforce core-periphery development trajectories in the EU neighbourhood.
22
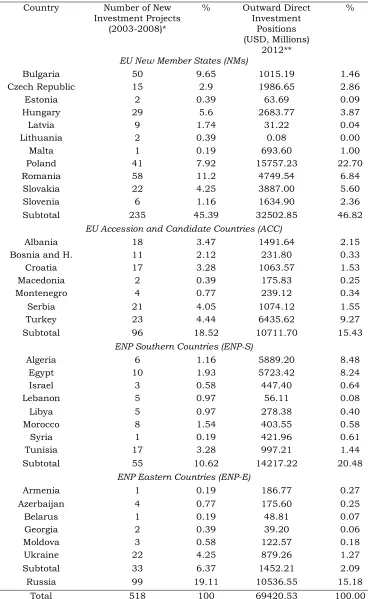
the EU and the European Neighbouring countries. The paper compares market-seeking and efficiency-seeking motivations with asset-seeking strategies. The quantitative analysis assess the location determinants of 518 Italian MNEs that invested in the area in the 2003-2008 period, while qualitative information on strategic location decisions is collected by means of in-depth interviews with executives in two of the largest Italian MNEs active in the region. The evidence suggests that market-seeking considerations are still predominant drivers of Italian MNE location decisions in EU Neighbouring Countries, together with resource-seeking motivations. However, different MNEs are developing diversified strategies to increase their access to these areas which are of increasing interest for global investors.
23
Part II – Selection patterns in cross-border acquisitions
After exploring the determinants of MNEs location decisions, this chapter addresses the patterns of selection of cross-border acquisition operations undertaken by MNEs. This represents a very novel area of enquiry and the objective of this chapter is to quantitatively assess the relevance of target firms’ attributes in shaping the acquisition choices of MNEs in the framework of their international organisation of production. By employing firm-level data on EU-15 countries, this fourth chapter studies the extent to which different firm-level attributes of domestic target companies motivate cross-border takeovers. In so doing, this work analyses changes in ownership from domestic to foreign in a sample of more than 300,000 firms in EU-15 countries over the period 1997-2013, focusing in particular on the productivity of target firms as well as their ability to establish successful market linkages. Results suggest that selection on target firms’ profitability systematically drives MNE strategies of cross-border takeovers: that is, domestic firms that experience an increase in their business have a higher probability of being acquired in any given year. By contrast, firm efficiency, in terms of labour productivity, does not relate to international acquisition decisions, but the effect of firm profitability tends to be concentrated in the group of more efficient firms. These findings are confirmed also by employing different measures of firm performance. Baseline results still hold across a large number of checks and extensions, indicating that within-firm differences in profitability are relevant drivers of cross-border acquisitions.
Part III – The impact of FDI on recipient economies
24
their innovation potential. This analysis is developed as a quantitative study having the objective of isolating the causal effect of MNE operations on the innovative performance of host regions. In this respect, this fifth chapter studies the extent to which knowledge externalities arising from FDI foster local innovative performance. The quantitative analysis is developed by employing manufacturing data on Italian provinces over the period 2001-2006 with the specific objective of investigating the causal impact of inward FDI on the local generation of innovation. Adopting a Knowledge Production Function approach (KPF), the chapter suggests that in the case of Italy the presence of foreign investment is beneficial for the innovative performance of the recipient local economies. These results are robust to a number of checks, thus contributing with new evidence to the literature on the impact of FDI on destination countries. In terms of policy consideration, this implies that a structured policy for the attraction of external capital might channel additional sources of knowledge to complement local capabilities.
IV. Concluding remarks
25
26
Figure 1: Growth of FDI, trade and GDP in the world, 1970-2010
100 200 300 400 500 600 700 800
World exports FDI
World nominal GDP
V
al
u
e
in
de
x
(1970=
100)
Year
27
28
Chapter 1 - The geography of foreign
investments in the EU Neighbourhood
1.1
Introduction
Over the past decades the world economy has been characterised by an increasing process of internationalisation of economic activities with the involvement of a growing number of countries. According to UNCTAD, the world stock of Foreign Direct Investment (FDI) in 2010 has reached $20 trillion dollars, while the figure for the first half of the 1980s was below one trillion.2 The dramatic expansion of international
investment represents one of the main features of the process of globalisation, in which developing and transition economies have been progressively more involved (e.g. Moran, 1999; Asiedu, 2002; Iammarino and McCann, 2013).
This paper aims to explore the geographical patterns of FDI in a set of developing and transition economies linked to the 'core' of the European Union (EU-15) by different degrees of functional, economic and political integration, and that will be broadly referred to as the ‘EU neighbourhood’. Such an area embraces the EU New Member States (NMs) that joined the EU in 2004 and 2007 (strongest degree of integration with the 'core' of the EU-15), Accession and Candidate Countries (ACC), European Neighbourhood Policy (ENP) countries, and Russia (the latter with the weakest degree of integration with the EU-15, stronger autonomy, but crucially important 'gravitation point' for investments in the area).3 This group of countries represents a very
2http://unctadstat.unctad.org. 3
29
relevant case in terms of patterns of FDI and strategies of multinational enterprises (MNEs) for its geographical proximity as well as its political and economic links to the EU-15 economic core. In this respect, the paper offers some new insights on the dynamics of global investment in the EU neighbourhood. While this region is relatively under-explored in the existing literature on FDI, its importance from a policy perspective is rapidly increasing. Policy-makers at the EU and national level are especially interested in gaining a better understanding of FDI patterns (and their drivers): the European Neighbourhood Policy and the intensification of economic and institutional relationships with other important actors in the area (such as the Russian Federation and Turkey, among others) have made apparent the huge potential of the entire region in terms of future economic development and integration through global value chains. Furthermore, the attractiveness of these economies for international investment is of special interest because of their relatively recent access to global markets that has often been coupled with (or mediated by) a close relationship with the European Union, making them unique case studies for the analysis of the interaction between globalisation and regionalisation processes. As a consequence, from the standpoint of academic research, the investigation of MNE behaviour in terms of investment strategies in the EU neighbourhood has a particular relevance for a better understanding of the economic, social and geographical processes that connect global and local actors.
30
determinants across sectors and business activities in order to shed new light on the heterogeneous effect of different characteristics of the recipient economies on investments of different nature. Third, the analysis investigates whether FDI originating from different areas of the world responds differently to national features and concentration patterns.
The next section provides a brief overview of the empirical research that has explored FDI determinants in the EU neighbourhood, while Section 3 offers a detailed picture of FDI patterns in this area. Section 4 introduces the drivers of FDI considered in the econometric section and explains the methodology. The main findings are presented and discussed in Section 5, whilst Section 6 concludes.
1.2
Literature background: the drivers of FDI
into the EU neighbourhood
31
Notwithstanding the variety of economies involved – to different degrees – in this process, the attention of most existing studies on FDI and their determinants in the area has been focused on CEECs (i.e. the countries that gained full EU membership in the 2000s and that are here called New Member states – NMs).4 Most existing studies looked at FDI
flows in the NMs in order to understand whether (and to what extent) increasing economic integration can influence FDI drivers. The reason for the special attention devoted to this sub-group of countries by the existing academic literature is threefold. First, the EU enlargement has provided scholars with unprecedented settings for the study of FDI patterns. Second, these analyses responded to the widespread concerns for the growing de-localisation (and potential job loss) away from the 'old' EU members in favour of CEECs (e.g. Boeri and Brücker, 2001). The third reason is related to data availability: not only NMs have received a much larger share of FDI than all other countries in the EU neighbourhood, but empirical analyses have also been fuelled by more accessible and comparatively more reliable data.
What emerges from the literature on the determinants of FDI in NMs is that internal demand, market potential and labour costs are fundamental aspects that foreign firms consider in their investment decisions (Resmini, 2000; Carstensen and Toubal, 2004; Janicki et al., 2004; Bellak et al., 2008). Other relevant elements for FDI attraction include proximity to the EU (Bevan and Estrin, 2004), deepening economic integration (Brenton et al., 1999), good institutions (Bevan et al., 2004) and tax incentives (Bellak and Leibrecht, 2009). Interestingly for the aims of the present paper, Resmini (2000) develops an empirical model taking into account sectoral differences in attracting FDI in NMs: her findings suggest that the responsiveness of FDI to national
4 As Croatia joined the EU on the 1st of July 2013, in this paper it is considered Accession country and
32
characteristics differs substantially across industries. This insight is corroborated by the results of Pusterla and Resmini (2007), showing that sector-specific drivers influence the investment decisions of foreign companies in NMs. The present paper offers a similar perspective for countries of the EU neighbourhood, further extending the analysis to business functions, following Crescenzi et al. (2014).
33
Overall, although the literature on FDI determinants has devoted limited attention to the EU neighbourhood, at least in comparison to other emerging areas such as China, India or Latin America, existing contributions point out that most FDI in the region follows market and/or efficiency-seeking rationales.
1.3
Stylised facts on FDI in the EU
neighbourhood
In order to broaden the perspective of the existing literature and cover both the EU NMs and the broadly defined neighbourhood of the Union this paper makes use of homogenous and comparable data on individual investment projects undertaken by MNEs in 34 countries in the period 2004-2008.5 The source of data is FDi Markets-Financial Times Business,
which represents an increasingly exploited tool of analysis in the literature on FDI determinants and location choices (e.g. Crescenzi et al., 2014).6 Greenfield investments from the entire world into the EU NMs
and neighbourhood are used to investigate country-level drivers of FDI decisions. In what follows we present some descriptive evidence in order to contextualize the subsequent empirical analysis.
[Table 1.1 here]
5 Although FDi Markets provides data since 2003, in the present work we consider only the period
2004-2008. This is due to the econometric exercise requiring lagged independent variables for which data are not available prior 2003 (see Section 4 below).
6
34
As is mentioned above, the EU neighbourhood, as considered here, is a highly heterogeneous region. NMs have joined the EU in two subsequent enlargement rounds in 2004 and 2007, ACC are EU candidate or potential candidate, while a large group is involved in the ENP, with the exception of Russia. These different degrees of integration with the EU signal the large variation in economic and political features across the region, as well as in the extent of attractiveness towards global capital flows.
Table 1.1 reports new foreign investments undertaken in the EU neighbourhood over the period 2004-2008 by global MNEs. Over half of total FDI flows in the area are directed to NMs (52.18%), while ACC, ENP Southern and ENP Eastern economies all exhibit lower and similar shares: 10.03%, 11.92% and 8.0%, respectively. A relevant share is, instead, targeting Russia, which receives 18.11% of total global FDI directed in the area. Considering individual countries rather than groups, Russia is the most attractive destination for FDI, followed at large distance by Romania (11.91%), Poland (9.26%) and Hungary (7.16%). In the ACC group, Turkey and Serbia are the most preferred destinations, with 3.87% and 2.68% respectively.
In the ENP Southern region, Morocco and Egypt play a leading role with 2.39% and 2.25% of total FDI, whilst in the ENP Eastern region Ukraine attracts the great majority of investments with 4.67% of the total. Figure 1 provides a graphical representation of global FDI distribution in the EU neighbourhood over the period 2004-2008.
[Figure 1.1 here]
35
due to the low number of observations in some countries for certain activities and industries, data are aggregated into three groups of business functions and two broad economic sectors. With respect to the former, Table 1.2 presents figures on investment in the following broad functional categories: (i) Headquarter and Innovation activities (HQ & Inno); (ii) Sales, Marketing, Logistic and Distribution (SMLD) and (iii) Production. Table 1.3 instead provides an outlook on the macrosectoral aggregations: (i) Manufacturing and (ii) Services.
Table 1.2 shows that NMs attract the large majority of FDI in all business functions. However, Russia remains the single most important country in terms of attractiveness across all functions. Surprisingly, ENP Southern countries receive a relatively large share of FDI in Headquarters and Innovative activities (16.7%), due in particular to the large role played by Israel (3.8%). Among NMs, Romania attracts the largest share of FDI in all business functions, while Turkey and Serbia lead the ACC group. As far as ENP Eastern is concerned, Ukraine unsurprisingly plays the most relevant role. What emerges from these figures is that global FDI tends to be concentrated in a few locations across the EU neighbourhood, and that variations in foreign investors’ preferences exist according to different business functions. For instance, Poland is one of the main destinations of global FDI in the area, but only 5.9% is in Headquarters and Innovation, while the share almost doubles when looking at FDI in Production activities.
[Table 1.2 here]
36
respectively); the Russian Federation alone attracts 19.7% of manufacturing FDI. As far as service activities are concerned, the shares of ENP Southern and ENP Eastern are higher (14.8% and 9.9% respectively) while NMs still attract about half the volume of service FDI (47.9%).
[Table 1.3 here]
1.4
FDI in the EU neighbourhood: methodology
In order to investigate the role (and relative importance) of national characteristics for the attraction of FDI in the EU neighbourhood, this paper relies upon regression techniques. In particular, following the literature on the quantitative analysis of MNE location, the empirical analysis relies on a count data model where national characteristics explain the number of FDI projects received by each country in each year.7 With a count response variable, it is customary to employ a
Poisson regression technique. However, we detect over-dispersion in our count variable, which makes this methodology less appropriate: we therefore apply a negative binomial model, which allows us to adjust estimates for over-dispersed data8 9. The time span covers the period
2004-2008 and includes a total of 11,262 greenfield FDI. In line with the relevant literature, independent variables enter the analysis with a one-year lag, as specified below. Thus, data for 2003 are employed to construct lagged explanatory variables.
7
Alternatively, a conditional logit model can be adopted, as common in similar studies. Nevertheless, the equivalence of the coefficients provided by these classes of models is well established in the literature (Guimarães et al., 2003).
8
An additional problem with count data models can derive from the large number of zeros in the data. However, this is not a relevant issue in our dataset.
9 We also run a Poisson regression (not reported here) which confirmed the main results of the Negative
37
The following empirical model is estimated:
𝐹𝐷𝐼𝑖𝑡 = 𝑓(𝑑𝑒𝑚𝑎𝑛𝑑𝑖𝑡−1, 𝑖𝑛𝑠𝑡𝑖𝑡𝑢𝑡𝑖𝑜𝑛𝑠𝑖𝑡−1, 𝑙𝑎𝑏𝑜𝑢𝑟𝑖𝑡−1, 𝑐𝑜𝑙𝑜𝑐𝑎𝑡𝑖𝑜𝑛𝑖, 𝑃𝑖)
Where:
FDIitis the count of foreign investment in destination country i in year
t.
Demandit-1 represents internal market size and external market
potential (MP) of country i in year t-1; both variables enter the model in log form. The size of the market in the host economies is viewed as a major driver of FDI (e.g. Wheeler and Mody, 1992; Billington, 1999). The larger the national market in the recipient country, the larger the local demand for goods and services and, consequently, market opportunities for the investor. National GDP at constant prices (US dollars 2005) is included as a proxy, with one-year lag, and comes from the World Development Indicators (WDI) of the World Bank.
FDI might also be aimed at exploiting external market potential (e.g. Head and Mayer, 2004; Carstensen and Toubal, 2004): in other words, some countries can play the role of platforms for exports towards other proximate locations. In order to control for countries’ external market potential we follow the literature (Harris, 1954) and compute the following indicator:
𝑀𝑃𝑖𝑡−1 = ∑ (𝐺𝐷𝑃𝑐⁄ )𝑑𝑖𝑐 𝑐≠𝑖
38
Institutionsit-1 stands for ‘Control of corruption’ in country i in year t-1.
This part of the model tests whether FDI is sensitive to national institutional environments, which are highly heterogeneous in the EU neighbourhood. Institutions are proxied with a measure that captures a very relevant aspect of the national environment when considering the strategies of foreign investors, namely ‘Control of corruption’ as provided by the World Bank in its World Governance Indicators (WGI). As for previous variables, institutions enter the analysis with a one-year lag. As is suggested by the existing literature, we expect that good institutional quality plays a positive role in attracting foreign capital since it increases certainty in market transactions and stability (e.g. Altomonte, 2000; Wei, 2000; Bénassy Quéré et al., 2007).
Labourit-1 includes proxies for the education level and average wage in
39
Colocationit includes several stock variables for FDI in country i
calculated as a cumulative count according to country of origin, sector and business function, all expressed in log. These variables capture the extent to which foreign investments co-locate in the same country; that is, using data at the investment level, we generate the stock of all FDI with similar characteristics to those of each specific investment (e.g. Defever, 2006). Then, when constructing our dataset at the country level, we consider the cumulative average stock of FDI in a specific country in a specific year. The FDi Markets database allows constructing stock measures of FDI according to (i) nationality of the investor, (ii) sector and (iii) business function. We are thus able to investigate the importance of similar FDI in determining new flows of investment, exploring FDI path-dependency along these three different dimensions. Similarly, two additional stock variables are built by crossing both sectors and business functions with information on origin countries, allowing to test whether FDI in one sector or business activity originated from a certain country attracts more FDI with similar features.
Finally, Pi is a set of country dummies included in order to account
for any factor not explicitly controlled for in the model that might have an effect on countries’ attractiveness towards global FDI. These include any time-invariant country-level driver of FDI such as geographical and cultural characteristics. The full list of variables is reported in Appendix A.
1.5
Results
40
[Table 1.4 here]
The results of this first estimation are reported in Table 1.4. The coefficients are mostly in line with expectations, and consistent across different model specifications. Traditional drivers of FDI, such as size of the internal market and external market potential, are strongly and positively correlated with the decision to undertake new investments. This confirms that global FDI flows towards the EU NMs and neighbourhood have a prominent market-seeking rationale. In other words, MNE strategies in the area are strongly based upon market access considerations in terms of both the exploitation of domestic demand in the recipient economies and the opportunity to constitute platforms for exports towards third countries (see Neary, 2007). As far as the national institutional environment is concerned, ‘Control of corruption’ exhibits a positive and weakly significant relationship with FDI in only two specifications out of five: overall, according to this first set of results, global investors do not appear overly concerned about choosing locations where the institutional setting confers stability to their operations and transactions.
41
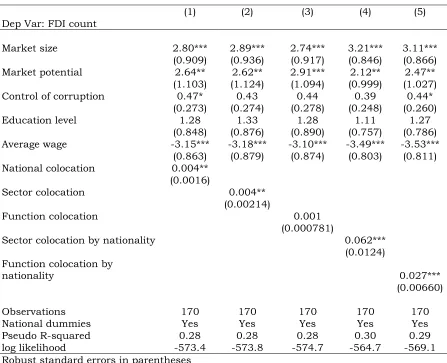
As far as FDI path-dependency is concerned, we enter the different colocation variables separately given the high level of correlation among them. The first three columns test the relevance of colocation patterns associated with common nationality of the investor, sector and business function respectively. Columns 4 and 5, instead, test the effect of colocation of FDI in the same sector and business by nationality. Results in Table 1.4 suggest that FDI tends to follow previous investment flows with similar features, with the only exception of functional colocation. Moreover, regressions in columns 4 and 5 indicate that FDI from the same country of origin tends to select the same location according to their sector and business activity performed abroad.
Foreign investment might be motivated by different determinants depending on the specific function operated abroad or the particular sector in which the FDI is undertaken. Therefore, we run separate regressions for the three types of business functions (Table 1.5) and the two macro-aggregates of economic activity (Table 1.6).
[Table 1.5 here]
42
favourable institutional environment plays a major role in driving FDI patterns in the EU neighbourhood. With respect to colocation variables, path-dependency in FDI inflows emerges clearly in the case Production. This is not surprising considering that production activities are likely to be associated with the occurrence of agglomeration economies and localised backward and forward linkages. However, in the case of ‘HQ & Inno’ the coefficients turn out to be negative and significant: this might be due to the fact that, while corporate headquarters tend to concentrate in large urban agglomerations (particularly capital cities) mainly for political networking and lobbying reasons, this is not normally the case for innovation activities (Iammarino and McCann, 2015). Previous research has shown that MNE technological and innovation operations are unlikely to be located in the vicinity of those of competitive rivals (see, among others, Cantwell and Santangelo, 1999; Alcácer, 2006; Verbeke et al., 2009) and tend rather to follow the location of production operations (Defever, 2006) or to reflect a value chain logic (Crescenzi et al. 2014)
[Table 1.6 here]
43
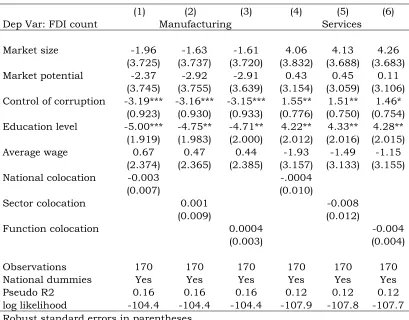
requires relative higher standards of skills than basic manufacturing. Table 1.6 also suggests that the institutional setting of the host countries matters for FDI decisions, again with different signs in the two aggregates considered. In particular, manufacturing activities are associated with less favourable institutional conditions: this, particularly in the case of emerging and developing economies such as those in the EU neighbourhood, might be explained by cross industry heterogeneity in MNEs’ preferences over institutional attributes. In other words, it has been argued that some MNEs tend to prefer locations with weaker economic institutions because they aim at bypassing transparent market mechanisms in their operations abroad (e.g. Helmann, 1998; Helmann et al., 2000; Glaeser and Shleifer, 2002; Sonin, 2003). Indeed, weaker institutions might facilitate rent-seeking or moral hazard behaviour, or simply allow capturing a share of host countries’ public resources, through lobbying, subsidies or less legalized channels – such as, in the case here, corruption. Such MNE behaviours has proved to differ across sectors and functions: previous research has shown that MNEs in high or medium technology manufacturing choose to locate in places where the institutional environment is more adequately protected, while MNEs operating in low-technology and less sophisticated sectors may consider strong regulation in business as an obstacle.10 Hence, mechanisms of
institutional subversion (Helmann, 1998) might be easily reflected in our results for manufacturing considering the highly heterogeneous group of countries analysed, that include both transition and developing countries, often characterised by notable institutional flaws. On the contrary, the institutional environment takes the expected positive sign when the analysis shifts to FDI in services, which include operations aiming to provide financial and business services, soft infrastructure and more knowledge-intensive content activities – as also the attractiveness
10 To be noted that our manufacturing aggregate includes also extraction and processing of coal, oil and
44
of stronger human capital in the sector seems to point out – and that tend to take into consideration business regulation, transparency and enforcement of contracts as pre-requisites for their location.
1.6
Conclusions
This paper aimed at providing a first investigation of the drivers of global FDI in the broadly defined EU neighbourhood. The area constitutes an interesting case in terms of attractiveness towards global MNE investments, both for its geographical closeness and its political and economic linkages with the ‘core’ of the European Union. The different degrees of integration with the EU, and the relatively recent access of most neighbourhood countries to global markets, reflect their large heterogeneity in terms of economic, social and political characteristics, which also entails large variation in their attractiveness towards foreign capital.
By employing data on greenfield investment projects occurred in the EU NMs and neighbourhood in the period 2003 to 2008, we explored the drivers of FDI by sector and business function. What emerges from the general empirical analysis is a clear market-seeking and efficiency-oriented rationale behind FDI in the EU neighbourhood. Interestingly, strong co-location patterns of FDI appear along different axes – national origin of the investor, industrial sector, and business function – supporting the existence of path-dependency, cumulative causation mechanisms and possible virtuous (or vicious) cycles in the impact of globalisation on the EU neighbourhood.
45
costs. Most importantly from a political point of view, they benefit from the EU membership. However, Russia is the single country that receives most foreign investment in manufacturing and services, plausibly due to the relevance of its huge internal demand for MNEs’ strategies.
In interpreting our empirical results and the descriptive evidence presented, we notice that the rest of the EU neighbourhood tends to remain peripheral in the strategies of MNEs, with few exceptions represented by countries such as Turkey and Ukraine, and to a lesser extent, Egypt and Morocco. These economies are far less integrated both politically and economically with the ‘core’ of the EU, but they are central economic actors in their regions and it is likely that MNEs oriented towards the exploitation of new markets and low-cost labour force will look at them with growing interest.
46
47
Table 1.1: FDI into the EU neighbourhood
Country Investment projects %
New Member States
Bulgaria 735 6.53
Czech Republic 651 5.78
Estonia 207 1.84
Hungary 806 7.16
Latvia 293 2.60
Lithuania 236 2.10
Malta 8 0.07
Poland 1,043 9.26
Romania 1,341 11.91
Slovakia 446 3.96
Slovenia 109 0.97
Subtotal 5,875 52.18
Accession and Candidate countries
Albania 49 0.44
Bosnia and H. 96 0.85
Croatia 183 1.62
Macedonia 45 0.40
Montenegro 19 0.17
Serbia 302 2.68
Turkey 436 3.87
Subtotal 1,130 10.03
ENP Southern countries
Algeria 208 1.85
Egypt 253 2.25
Israel 120 1.07
Jordan 111 0.99
Lebanon 66 0.59
Libya 88 0.78
Morocco 269 2.39
Syria 88 0.78
Tunisia 137 1.22
Subtotal 1,340 11.92
ENP Eastern countries
Armenia 47 0.42
Azerbaijan 113 1.00
Belarus 80 0.71
Georgia 69 0.61
Moldova 43 0.38
Ukraine 526 4.67
Subtotal 878 8.00
Russia 2,039 18.11
Total 11,262 100
48
Table 1.2: FDI into the EU neighbourhood by business function
Country HQ & Innovation SMLD Production Investment % Investment % Investment %
New Member States
Bulgaria 82 4.5 328 6.9 325 6.9
Czech Republic 101 5.6 271 5.7 279 5.9
Estonia 34 1.9 103 2.2 70 1.5
Hungary 118 6.6 349 7.3 339 7.2
Latvia 25 1.4 191 4.0 77 1.6
Lithuania 28 1.6 153 3.2 55 1.2
Malta 1 0.06 3 0.06 4 0.08
Poland 107 5.9 394 8.3 542 11.5
Romania 223 12.4 568 12.0 550 11.7
Slovakia 48 2.7 159 3.4 239 5.1
Slovenia 14 0.8 65 1.4 30 0.6
Subtotal 781 43.1 2,584 59.4 2,510 53.3 Accession and Candidate countries
Albania 9 0.5 19 0.4 21 0.5
Bosnia and H. 13 0.7 32 0.7 51 1.1
Croatia 16 0.9 94 2.0 73 1.6
Macedonia 3 0.2 9 0.2 33 0.7
Montenegro 1 0.06 8 0.2 10 0.2
Serbia 52 2.9 119 2.5 131 2.8
Turkey 91 5.1 171 3.6 174 3.7
Subtotal 185 10.2 452 10.4 493 10.5
ENP Southern countries
Algeria 50 2.8 77 1.6 81 1.7
Egypt 43 2.4 91 1.9 119 2.5
Israel 69 3.8 30 0.6 21 0.5
Jordan 23 1.3 44 0.9 44 0.9
Lebanon 15 1.3 33 0.7 18 0.4
Libya 18 1.0 18 0.4 52 1.1
Morocco 33 1.83 104 2.2 132 2.8
Syria 20 1.1 18 0.4 50 1.1
Tunisia 32 1.8 33 0.7 72 1.5
Subtotal 303 16.7 448 10.3 589 12.5
ENP Eastern countries
Armenia 19 1.1 14 0.4 14 0.3
Azerbaijan 32 1.8 50 1.1 31 0.7
Belarus 19 1.1 45 1.0 16 0.3
Georgia 17 0.9 32 0.7 20 0.4
Ukraine 132 6.5 237 5.0 168 3.6
Moldova 4 0.2 14 0.3 14 0.3
Subtotal 223 12.3 392 9.0 263 5.6
Russia 319 17.6 866 19.9 854 18.1
49
Table 1.3: FDI into the EU neighbourhood by macro-sector
Country Manufacturing Services
Investment % Investment %
New Member States
Bulgaria 358 6.0 323 6.8
Czech
Republic 401 6.7 226 4.8
Estonia 112 1.9 90 1.9
Hungary 476 7.9 292 6.2
Latvia 174 2.9 117 2.5
Lithuania 125 2.1 100 2.1
Malta 6 0.1 2 0.04
Poland 605 10.1 413 8.7
Romania 748 12.5 552 11.6
Slovakia 310 5.2 125 2.6
Slovenia 59 1.0 43 0.9
Subtotal 3,374 56.3 2,283 47.9
Accession and Candidate countries
Albania 18 0.3 23 0.5
Bosnia and H. 48 0.8 48 0.8
Croatia 100 1.7 100 1.7
Macedonia 16 0.3 19 0.3
Montenegro 3 0.05 3 0.05
Serbia 171 2.9 122 2.6
Turkey 214 3.6 200 4.2
Subtotal 570 9.5 515 10.8
ENP Southern countries
Algeria 89 1.5 102 2.2
Egypt 102 1.7 127 2.7
Israel 49 0.8 65 1.4
Jordan 44 0.7 65 1.4
Lebanon 18 0.3 47 1.0
Libya 21 0.4 39 0.8
Morocco 108 1.8 152 3.2
Syria 25 0.4 48 1.0
Tunisia 68 1.1 61 1.3
Subtotal 524 8.7 706 14.8
ENP Eastern countries
Armenia 14 0.2 26 0.6
Azerbaijan 35 0.6 64 1.4
Belarus 31 0.5 46 1.0
Georgia 17 0.3 39 0.8
Moldova 19 0.3 20 0.4
Ukraine 229 3.8 276 5.8
Subtotal 345 5.8 471 9.9
Russia 1,180 19.7 792 16.7
Total 5,993 100 4,767 100
50
Table 1.4: FDI determinants into the EU neighbourhood
(1) (2) (3) (4) (5)
Dep Var: FDI count
Market size 2.80*** 2.89*** 2.74*** 3.21*** 3.11*** (0.909) (0.936) (0.917) (0.846) (0.866) Market potential 2.64** 2.62** 2.91*** 2.12** 2.47** (1.103) (1.124) (1.094) (0.999) (1.027) Control of corruption 0.47* 0.43 0.44 0.39 0.44*
(0.273) (0.274) (0.278) (0.248) (0.260)
Education level 1.28 1.33 1.28 1.11 1.27
(0.848) (0.876) (0.890) (0.757) (0.786) Average wage -3.15*** -3.18*** -3.10*** -3.49*** -3.53***
(0.863) (0.879) (0.874) (0.803) (0.811) National colocation 0.004**
(0.0016)
Sector colocation 0.004**
(0.00214)
Function colocation 0.001
(0.000781)
Sector colocation by nationality 0.062*** (0.0124) Function colocation by
nationality 0.027***
(0.00660)
Observations 170 170 170 170 170
National dummies Yes Yes Yes Yes Yes
Pseudo R-squared 0.28 0.28 0.28 0.30 0.29
log likelihood -573.4 -573.8 -574.7 -564.7 -569.1 Robust standard errors in parentheses
51
Table 1.5: FDI determinants in the EU neighbourhood by business function
(1) (2) (3) (4) (5) (6) (7) (8) (9)
Dep Var: FDI count HQ & Inno SMLD Production
Market size 9.11 8.15 8.90 -1.11 -1.16 -1.29 -0.96 -0.087 -0.37 (6.577) (6.321) (6.500) (5.929) (6.122) (6.273) (3.141) (3.187) (3.156) Market potential -1.21 -1.24 -2.84 -5.77 -5.87 -6.07 1.20 0.10 0.65
(5.315) (5.179) (5.285) (6.632) (6.911) (6.949) (3.552) (3.484) (3.451) Control of corruption 0.56 0.69 0.44 -1.02 -0.91 -0.92 2.27** 2.10** 2.22** (1.323) (1.334) (1.328) (0.995) (0.986) (0.987) (0.992) (1.001) (0.998) Education level 14.24*** 15.19*** 14.25*** -3.60** -3.64** -3.74** 3.11 4.88 5.17
(4.476) (4.775) (4.580) (1.624) (1.639) (1.648) (3.588) (3.624) (3.555) Average wage 6.36 9.57 9.39 2.71 2.56 2.77 0.43 -0.05 -0.09
(6.390) (7.011) (7.111) (3.785) (3.823) (3.903) (2.307) (2.312) (2.330)
National colocation -0.02 -0.01 0.01
(0.012) (0.009) (0.010)
Sector colocation -0.04** -0.01 0.025*
(0.02) (0.011) (0.014)
Function colocation -.015*** -0.002 0.011**
(0.005) (0.003) (0.005)
Observations 170 170 170 170 170 170 170 170 170
National dummies Yes Yes Yes Yes Yes Yes Yes Yes Yes
Pseudo R2 0.28 0.30 0.30 0.16 0.16 0.16 0.15 0.16 0.16 log likelihood -56.40 -55.30 -55.34 -100.1 -100.2 -100.2 -95.21 -94.57 -94.38 Robust standard errors in parentheses
52
Table 1.6: FDI determinants in the EU neighbourhood by macro-sector
(1) (2) (3) (4) (5) (6)
Dep Var: FDI count Manufacturing Services
Market size -1.96 -1.63 -1.61 4.06 4.13 4.26 (3.725) (3.737) (3.720) (3.832) (3.688) (3.683) Market potential -2.37 -2.92 -2.91 0.43 0.45 0.11
(3.745) (3.755) (3.639) (3.154) (3.059) (3.106) Control of corruption -3.19*** -3.16*** -3.15*** 1.55** 1.51** 1.46*
(0.923) (0.930) (0.933) (0.776) (0.750) (0.754) Education level -5.00*** -4.75** -4.71** 4.22** 4.33** 4.28**
(1.919) (1.983) (2.000) (2.012) (2.016) (2.015) Average wage 0.67 0.47 0.44 -1.93 -1.49 -1.15
(2.374) (2.365) (2.385) (3.157) (3.133) (3.155) National colocation -0.003 -.0004
(0.007) (0.010)
Sector colocation 0.001 -0.008
(0.009) (0.012)
Function colocation 0.0004 -0.004
(0.003) (0.004)
Observations 170 170 170 170 170 170
National dummies Yes Yes Yes Yes Yes Yes Pseudo R2 0.16 0.16 0.16 0.12 0.12 0.12 log likelihood -104.4 -104.4 -104.4 -107.9 -107.8 -107.7 Robust standard errors in parentheses
53
[image:53.612.86.549.137.566.2]Appendix A
Table A.1: List of variables
Variable Description Source
Dependent
FDIit Count of FDI in country i at time t FDi
Markets
Independent
Demand
Market Sizeit-1 GDP of country i at time t-1. WDI
Market Potentialit-1 Sum of distance-weighted GDP of all third
countries c from location i at time t-1. WDI / CEPII Institutions
Control of Corruptionit-1 Composite indicator ranging from -2.5 to 2.5,
with higher values associated to more control of corruption in country i at time t-1.
WGI
Labour
Education Levelit Ratio between secondary school age population
and total population in country i at time t-1.
UNESCO
Average Wageit Per capita GDP in country i at time t-1. WDI Co-location
National Co-locationit Cumulative average stock of investment in
country i from the same country of origin.
FDi Markets Sector Co-locationit Cumulative average stock of investment in
country i in the same sector of activity. Markets FDi Function Co-locationit
Sector Co-locationit by
nationality
Function Co-locationit by
nationality
Cumulative average stock of investment in country i in the same business function. Cumulative average stock of investment in country i in the same sector of activity from the same country of origin.
Cumulative average stock of investment in country i in the same business function from the same country of origin.
54
Chapter 2 – What drives European
multinationals to the EU neighbouring
countries? A mixed methods analysis of
Italian investment strategies
2.1
Introduction
55
Eastern countries, but EU FDI account for around 80% of the total in Ukraine) (DRN, 2013).
While “corruption has been identified as a major obstacle to investment and business, both in eastern and southern ENP countries” (European Commission, 2013: 10), very limited systematic research has been conducted so far on the relative importance of other investment drivers/barriers that might play an important role in this emerging context. Corruption and poor institutional quality remain fundamental cross-country issues for the entire region (see Chapter 3 for a more detailed discussion of this), but market-seeking (associated with increasing market size), resource-seeking and efficiency-seeking (associated with cheap skilled labour) motives remain strong countervailing pull factors that interact with geographical and (increasing) institutional proximity, sustaining the increasing flow of EU investments in the region.
This paper aims to shed new light on the strategic decisions of European MNEs when balancing the repulsive and attractive forces that shape the geography of their investments in the EU neighbouring countries (NCs) and in the ‘new’ member states (NMs) of the EU. The coverage of 33 destination countries among NCs and European NMs11
makes it possible to analyse the full spectrum of economic and institutional integration with the ‘core’ of the EU-15, from the full economic and political integration into the Union and the single market of the NMs, to the looser association of the ENP East and South. In terms of origin of the investments the focus of the paper will be on the case of Italy. The focus on investments originating from one single country will make possible to ‘net out’ any ‘home market’ bias in MNE behaviour,
11 In this paper NCs are (i) Accession and Candidate Countries (ACC): Albania, Bosnia and Herzegovina,
56
allowing us to compare their strategies with reference to the highly diversified context of the NCs and NMs. The case of Italy is particularly appropriate for this purpose: Italy is a founding member of the European Union that forms part of the ‘core’ of the Union but, at the same time, benefits from closer geographical proximity with both NMs and NCs than other ‘old’ EU members. In addition, Italian foreign and commercial policies have historically devoted a special attention to the role of the country as a ‘bridge’ between the ‘Old’ Europe and the EU neighbourhood (Bank of Italy, 2000)
57
In terms of contribution to the existing