R E S E A R C H A R T I C L E
Open Access
Accuracy of risk scales for predicting repeat
self-harm and suicide: a multicentre,
population-level cohort study using routine
clinical data
Sarah Steeg
1*, Leah Quinlivan
1, Rebecca Nowland
1, Robert Carroll
4, Deborah Casey
2, Caroline Clements
1,
Jayne Cooper
1, Linda Davies
5, Duleeka Knipe
4, Jennifer Ness
3, Rory C. O
’
Connor
6, Keith Hawton
2,
David Gunnell
4and Nav Kapur
1,7Abstract
Background:Risk scales are used widely in the management of patients presenting to hospital following self-harm.
However, there is evidence that their diagnostic accuracy in predicting repeat self-harm is limited. Their predictive accuracy in population settings, and in identifying those at highest risk of suicide is not known.
Method:We compared the predictive accuracy of the Manchester Self-Harm Rule (MSHR), ReACT Self-Harm Rule
(ReACT), SAD PERSONS Scale (SPS) and Modified SAD PERSONS Scale (MSPS) in an unselected sample of patients attending hospital following self-harm. Data on 4000 episodes of self-harm presenting to Emergency Departments (ED) between 2010 and 2012 were obtained from four established monitoring systems in England. Episodes were assigned a risk category for each scale and followed up for 6 months.
Results:The episode-based repeat rate was 28% (1133/4000) and the incidence of suicide was 0.5% (18/3962). The
MSHR and ReACT performed with high sensitivity (98% and 94% respectively) and low specificity (15% and 23%). The SPS and the MSPS performed with relatively low sensitivity (24–29% and 9–12% respectively) and high specificity (76–77% and 90%). The area under the curve was 71% for both MSHR and ReACT, 51% for SPS and 49% for MSPS. Differences in predictive accuracy by subgroup were small. The scales were less accurate at predicting suicide than repeat self-harm.
Conclusions:The scales failed to accurately predict repeat self-harm and suicide. The findings support existing
clinical guidance not to use risk classification scales alone to determine treatment or predict future risk.
Keywords:Self-harm, Suicide, Risk factors, Classification, Outcome
Background
Emergency Departments (EDs) in England treat over 200,000 presentations for harm (intentional
self-poisoning or self-injury) each year [1], and the
appro-priate management of these individuals is important. Clinicians are required to manage a number of risks when treating this population. People who have
self-harmed are at greater risk of suicide [2], other causes
of premature mortality [3] and comorbid conditions
such as alcohol misuse [4] compared to the general
population. In efforts to help mental health and non-specialist clinicians manage patients, many hospitals use risk scales, which aim to score or classify patients according to their risk of future self-harm or suicide based on the presence or absence of a specified set of characteristics.
Psychosocial assessment by a mental health clinician is a central component of clinical care and is recommended
for each episode of self-harm [5]. These in-depth
assess-ments help clinicians to formulate decisions about follow-* Correspondence:[email protected]
1Centre for Mental Health and Safety, Manchester Academic Health Science
Centre, University of Manchester, Manchester, England Full list of author information is available at the end of the article
© The Author(s). 2018Open AccessThis article is distributed under the terms of the Creative Commons Attribution 4.0
International License (http://creativecommons.org/licenses/by/4.0/), which permits unrestricted use, distribution, and
up care and reach an informed decision about the risk of further self-harm. There is also evidence that psychosocial assessment may reduce the risk of a further self-harm
episode [6,7]. Formal risk scales are used often by ED and
psychiatric clinicians. One study of 32 hospitals across England found that over 20 different risk scales were being
used with people who presented after self-harm [8]. This
suggests they are in widespread use, with little consensus about which should be used or how well they predict future risk.
A recent systematic review compared the diagnostic accuracy of predicting repeat self-harm of a number of
scales [9]. There were no scales that performed well
enough to be recommended for use in clinical practice. Another recent meta-analysis pooled positive predictive values from 52 studies of psychological scales predicting
repeat self-harm and suicide [10]. The results suggested
high-risk classification approaches were unlikely to be clinically useful but also reported high between-study heterogeneity. Another study measured the accuracy of the SAD PERSONS Scale (SPS) for predicting suicide following an emergency department presentation, using
administrative data to identify suicide deaths [11]. The
study found that the predictive accuracy of the SPS was inadequate to support the use of this risk scale. However, there have been few head-to-head comparisons of risk scales within the same cohort. A comparatively small
study (n= 483) found that the levels of diagnostic
accur-acy reached by the five scales investigated meant they
had limited clinical utility [12]. The risk scales also
performed worse at predicting repeat self-harm than simply asking the clinician or patient to rate their risk. However, the study only recruited individuals re-ceiving a psychosocial assessment from mental health clinician (typically only around 55% of all self-harm patients who present to the ED receive a psychosocial
assessment) [6, 13]. This study was too small to
consider the outcome of most concern to clinicians –
suicide, or to examine diagnostic accuracy of the scales in different subgroups. In the current study we therefore aimed to test four of the risk scales tested in previous research, using data from a large unse-lected cohort of people presenting to the ED after self-harm.
Aims of the study
Our specific objectives were:
– To estimate predictive accuracy of the risk scales, using established cut-off points, for identifying a) repeat self-harm and b) suicide
– To test for differences in the predictive accuracy of the scales by groups (age, sex, method of self-harm,
professional background of the assessor and self-harm history)
Our hypothesis was that the poor predictive ability of risk scales found in previous smaller studies would hold for this larger unselected hospital cohort and would be replicated for suicide as an outcome.
Methods Data sources
Data were obtained from self-harm cohorts in four separate centres in England. Each centre has an established system to collect data relating to episodes of self-harm presenting to the study EDs. Two of the centres (Bristol and Oxford) are based in the South of England, one in the Midlands (Derby) one in the North (Manchester). The centres collected data from one hospital each with the exception of Manchester, which included three hospitals. The EDs in the study hospitals each had access to psychiatric liaison teams alongside emergency out-of-hours cover from crisis teams or junior psychiatrists.
For all self-harm episodes, basic data were avail-able on method of self-harm (including drugs taken in self-poisoning), time of presentation, age, gender
and initial hospital management (for example,
admission to a medical bed, referral for a psychiatric assessment). For individuals who were subsequently referred to liaison psychiatry services for a psycho-social assessment, additional data were available including factors precipitating the self-harm, circum-stances of the act (such as planning and suicidal intent), social circumstances (such as living arrangements and marital status) and symptoms of depression. For the present study, 1000 consecutive episodes of self-harm, in-cluding any repeat episodes by the same individuals, were
extracted from each centre’s cohort. The presentations
took place over different time periods in each centre but all were between 2010 and 2012. Repeat episodes of self-harm by individuals were included to reflect the real-world ED environment and to be in line with clinical guid-ance that each episode of self-harm should be assessed
comprehensively [5]. In order to preserve the
observational nature of the data, no selection/exclusion criteria were applied.
In addition to information from the study hospitals, individuals in three of the centres were matched to Office for National Statistics (ONS) records held by the
National Health Service [https://digital.nhs.uk]. For
indi-viduals who died, information about the cause of death, verdict and date of death were available. In one of the centres, suicide deaths were identified from the local
Scales
We compared the predictive accuracy of the following risk scales: the Manchester Self-Harm Rule (MSHR)
[14], the ReACT Self-Harm Rule (ReACT) [15], the SAD
PERSONS Scale (SPS) [16] and the Modified SAD
PERSONS Scale (MSPS) [17]. The MSHR and ReACT
both consist of four items, with a‘yes’to at least one of
the items resulting in a high risk categorisation and‘no’
to all items corresponding to low risk. The SPS and the MSPS both include ten items and classify episodes into three risk categories (low, moderate and high). The MSPS also weights four of the items, resulting in maximum score of 14. The items included in each of these scales and the cut-off points for the risk categories are
shown in Additional file1: Table S1. Scales were selected
based on an existing systematic review of the diagnostic
accuracy of risk scales for predicting self-harm [9]. We
in-cluded scales that could be re-constructed from routinely recorded information following a self-harm hospital presentation. The scales were also included in a previous study that compared their predictive accuracy when ad-ministered by a mental health clinician as part of the
psy-chosocial assessment [12].
Due to the observational nature of the study, some of the individual items for the risk scales were derived from variables related to the core items of interest. For
ex-ample, the item ‘Stated future intent’from the two SAD
PERSONS Scales was derived in three centres from the
Suicide Intent Scale [18] and in another from a binary
‘yes/no’question about current suicidal plans. In another
example, the SPS item‘Depression or hopelessness’was
available for two of the four sites: in one site it was de-rived from the presence of either one or two of the items
‘depression’ and ‘hopelessness’ within a list of eight
symptoms of depression and in another it was derived from the presence of a diagnosis of affective disorder at the time of presentation.
Outcome measures
Repeat attendance to the study hospitals with an episode of self-harm within 6 months was our first outcome measure. This was selected because it is a marker for continued distress and need for ongoing clinical care,
and has been an outcome in many previous studies [19].
We chose 6 months as the follow-up period as the ma-jority of repeat episodes occur within this time-frame
[20]. Our second outcome measure was suicide within
6 months of the self-harm episode. Many studies are in-sufficiently powered to examine suicide as an outcome, due to low event numbers, but large observational data-sets are well suited to this purpose. Individuals who
could not be matched to ONS records (n= 38/3157)
were excluded from the analyses of suicide. Finally, we were interested to see if there were differences in the
predictive accuracy of the scales by demographic and clinical sub-groups (age, sex, method of harm, self-harm history and according to the professional back-ground of the assessor). These have been identified as
factors which may influence the assessment of risk [21].
Missing data
Data were relatively complete (median levels of com-pleteness for variables 69% (IQR 45% to 92%, range 34% to 100%) with lower completeness for certain variables (e.g. future suicidal intent and depression). Data were more likely to be missing for variables where the individ-ual did not have a psychosocial assessment. For episodes where no assessment took place, there was evidence of bias towards clinicians recording the variable if it was
‘present’ and not if it was ‘absent’. In these instances,
variables were imputed as absent, prior to multiple im-putation. The potential effect of this would be to under-estimate sensitivity and overunder-estimate specificity (defined
in Table 1). This included the following items from the
SPS/MSPS: depression or hopelessness, organised or ser-ious attempt and rational thinking loss. This approach
has been taken in a previous study with similar data [7].
The remaining missing data were largely missing at ran-dom, with potential predictors of missingness included in the imputation model. Imputation was conducted
using the ‘chained equations’ approach [22] in Stata to
generate 50 imputations. Analyses were either conducted on all imputed datasets to generate pooled results, or, where multiple imputation was not compatible with the
analytic method, estimates were pooled from m = 1–5
using Rubin’s rules [23].
In a sensitivity analysis, repeat self-harm outcomes were also examined using a dataset with missing data for scale items coded as not present. This analysis did not include one of the centres due to the unavailability of a scale item used in three of the four scales (living
circum-stances) in this centre. We also conducted a ‘complete
case’ analysis of the MSHR and ReACT by excluding
scale items with missing data. Due to the larger number of items in the SPS and the MSPS, too many cases would have been excluded for this approach to be feas-ible for these scales. For example, while 52% of cases had complete data for at least seven out of ten items on the SPS, only 2% had complete data for all ten scale items. Therefore, excluding all cases with missing data for any one scale item would result in 98% of cases ex-cluded from the analyses.
Statistical analyses
proportion of people who did not repeat self-harm and were correctly identified by the scale as low risk), posi-tive predicposi-tive value (the probability that the person identified as high risk went on to repeat self-harm), negative predictive value (the probability that the person identified as low risk did not repeat self-harm), positive likelihood ratio (the increased likelihood of a high risk scale result in a person who repeated self-harm vs. one who did not), negative likelihood ratio (the decreased likelihood of a low risk scale result in a person who re-peated self-harm vs. one who did not) and diagnostic odds ratio (the odds of a high risk scale result in a per-son who repeated self-harm vs. one who did not). Receiver operator characteristic (ROC) curves, which
show sensitivity on they-axis and 1 minus specificity on
the x-axis for all possible scale thresholds were plotted
[24]. The area under the curve (AUC), based on the
published cut-off points for each scale, was also calcu-lated. The AUC represents the overall proportion of cases correctly predicted by the test; an AUC of 0.5 would suggest the test does not perform any better than chance while an AUC of 1.0 indicates every case is pre-dicted correctly. Chi-square tests were used to examine differences in the AUC between subgroups. Stata V.13.1 and OpenEpi were used for the analyses.
Results
Characteristics of the cohort
The 4000 self-harm presentations involved 3157 individ-uals. 60% (2411) of episodes were by females, 14% (552) by individuals aged 18 or under and 22% (892) aged 45 years or over. The majority of episodes involved self-poisoning with drugs or other substances (81%, 3241) and 19% (759) presentations were by individuals who had self-injured. 55% (2206) of episodes received a psy-chosocial assessment. In 2759 (69%) of the episodes,
individuals had a previous history of self-harm. 28% (1133) of episodes were followed by a repeat episode within 6 months. Amongst the 3962 episodes in which individuals could be followed up for mortality status, the
incidence of suicide was 0.5% (n= 18).
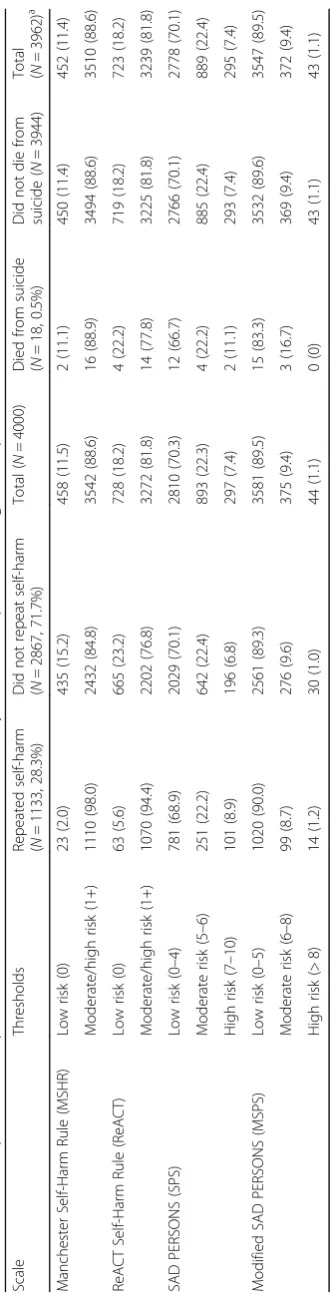
Repeat self-harm within six months by scale cut-off points
For the MSHR and ReACT the majority of the episodes that were followed by a repeat episode in the subsequent 6 months were identified as moderate to high risk
(Table 2). The MSHR and ReACT both had high
sensi-tivity for identifying repeat self-harm (98% and 94% respectively) alongside relatively low specificity for iden-tifying those that did not go on to repeat (15% and 23%
respectively) (Table 3). The reverse pattern was seen for
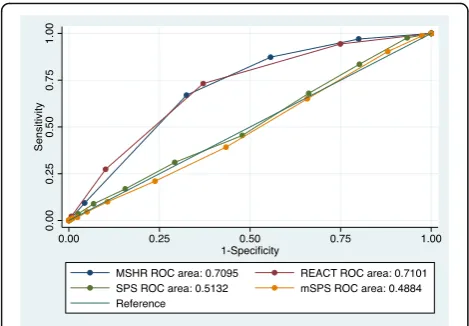
the SPS and the MSPS: relatively low sensitivity with high specificity resulted in the correct prediction of the majority of episodes that were not followed by repetition of self-harm as low risk. Positive predictive values were similar across the four scales. The positive likelihood ra-tios for a high risk result on the scales were between 1.2 (MSHR) and 1.3 (MSPS). The overall area under the curve (the proportion of episodes correctly identified by the scales) was highest for the MSHR and ReACT (both 71%) and was approximately equivalent to chance for
the SPS (51%) and the MSPS (49%) (Fig.1).
Suicide within six months by scale cut-off points
Only two people who died by suicide (11% of all suicides) were identified as low risk by the MSHR and four (22%)
by ReACT (Table 2). However two thirds of the suicides
(12/18) were categorised as low risk by the SPS and over 80% (15/18) by the MSPS. There were no suicide deaths
identified as high risk by the MSPS (Table2). The MSHR
[image:4.595.57.542.99.286.2]and ReACT had relatively high sensitivity for predicting
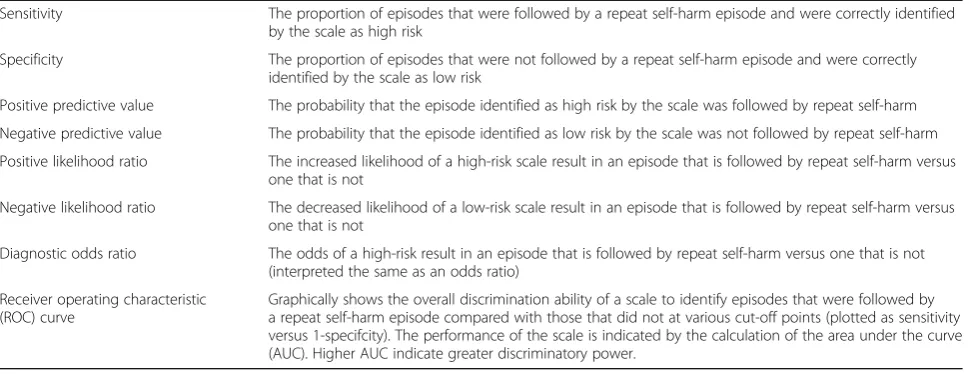
Table 1Diagnostic accuracy definitions
Sensitivity The proportion of episodes that were followed by a repeat self-harm episode and were correctly identified by the scale as high risk
Specificity The proportion of episodes that were not followed by a repeat self-harm episode and were correctly identified by the scale as low risk
Positive predictive value The probability that the episode identified as high risk by the scale was followed by repeat self-harm
Negative predictive value The probability that the episode identified as low risk by the scale was not followed by repeat self-harm
Positive likelihood ratio The increased likelihood of a high-risk scale result in an episode that is followed by repeat self-harm versus one that is not
Negative likelihood ratio The decreased likelihood of a low-risk scale result in an episode that is followed by repeat self-harm versus one that is not
Diagnostic odds ratio The odds of a high-risk result in an episode that is followed by repeat self-harm versus one that is not (interpreted the same as an odds ratio)
Receiver operating characteristic (ROC) curve
suicide, while the SPS and the MSPS had higher specificity
(Table4).
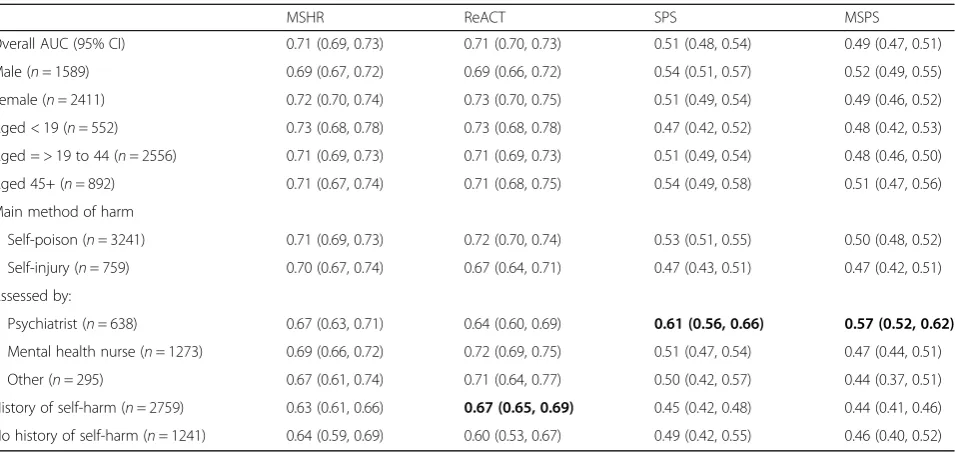
Differences by subgroups
There were few differences in overall predictive accuracy
(AUC) by subgroups (Table5). There was higher AUC for
episodes assessed by a psychiatrist for both the SPS
(area under the curve 0.61, p= 0.003) and the MSPS
(0.57, p= 0.001) than those assessed by a mental
health nurse, by another profession or not assessed. The ReACT risk scale performed worse amongst episodes involving individuals with no prior episode of self-harm (0.60) compared to individuals with a history of self-harm
(0.67, p= .0.02). However, the absolute differences
be-tween subgroups were small (Table5).
Sensitivity analysis
In sensitivity analysis with missing items imputed as not present, the MSHR and ReACT again performed with relatively high sensitivity and low specificity, though sen-sitivities were lower and specificities higher, due to more
individuals being rated as low risk (Additional file 1:
Table S2). The measures of predictive accuracy of the SPS and MSPS were broadly similar to those in the main analyses. When we included only those cases with complete data for all scale items for the MSHR and ReACT scales, sensitivity was similar but specificity was lower. For the MSHR, 30.4% (981/3228) of episodes were followed by repetition of self-harm, sensitivity was 99.2% and specificity was 7.4%. For ReACT, the repeat rate was 27.2% (668/2459), sensitivity was 94.3% and specificity was 20.0%.
Discussion Main findings
The MSHR and ReACT performed with high sensitivity but low specificity for prediction of repeat self-harm. This resulted in a large proportion of episodes that were not followed by repetition being placed in the higher risk category. The overall area under the curve for these scales was fair. The SPS and the MSPS had lower sensi-tivity and higher specificity, resulting in the majority of episodes that resulted in repetition being identified as low risk. The SPS and the MSPS were no better than chance in terms of overall predictive accuracy. The SPS and the MSPS identified the majority of suicide deaths as low risk.
Strengths and limitations
Some scale items were not available across all sites. To avoid over-estimating the prevalence of risk factors, we assumed the item was not present if data were missing. Furthermore, if there was evidence that the prevalence of a scale item was over-estimated in non-assessed epi-sodes, missing items were imputed as absent for all non-assessed episodes before multiple imputation. The effect of this on the measures of predictive accuracy would be to underestimate sensitivity (due to fewer meeting the
criteria for ‘high risk’) and overestimate specificity (due
to more meeting the criteria for ‘low risk’). When the
performance of the MSHR and the ReACT scales, the two best performing scales in this study, was tested on cases with complete data for all scales items, measures of sensitivity were similar and specificities were lower. This suggests our imputation approach did not lead to over-estimation of the performance of these two scales.
The data for this study were obtained from observa-tional self-harm cohorts with data extracted from hos-pital records and clinical notes. It was necessary to use proxy variables for certain scale items where an exact corresponding variable was not available, which is a limi-tation of this study. In addition, for some scale items, corresponding variables could be recorded differently ac-cording to the study centre. For example, suicidal intent was derived from the Suicide Intent Scale in three cen-tres and from a binary variable in another centre. This would have had most impact on the SAD PERSONS Scales, due to the higher number of scale items. How-ever, the measures of diagnostic accuracy are in line with a previous study which showed the area under the curve
to be no better than chance for the SPS [17].
Further-more, this novel approach resulted in a more representa-tive, real-world sample of self-harm episodes and their management.
A potential source of bias in this study could have arisen if percieved risk influenced subsequent clinical management, which in turn may have been associated
Fig. 1Receiver operator characteristic curves (multiply imputed
[image:7.595.56.291.87.250.2]with risks of repeat self-harm and suicide. This would have led to bias in the measures of predictive accuracy.
Comparison to previous research
A previous study used a selected sample with clinicians administering the risk scales following referral to
psychi-atric services [12]. The conclusion from that study was
that the diagnostic accuracy of the scales was too modest for them to be of clinical use. The measures of diagnos-tic accuracy in the present study are comparable, sug-gesting that risk scales following self-harm are also unsuitable for the wider population of all those who present to hospital following self-harm, not just those seen by mental health clinicians. While the previous study recruited patients after they had been referred to liaison psychiatry for assessment, the present study also included non-referred episodes, typically just under half
of all episodes [13, 25]. The present study also suggests
that the risk scales are unsuitable for predicting risk of future suicide among individuals presenting with self-harm. A meta-analysis of risk scales used for predicting suicidal behaviour also found that predictive ability of risk scales was insufficient to be used to determine
treat-ment allocation [10]. The present study addresses the
high level of heterogeneity found in the meta-analysis, and reaches similar conclusions.
A comparatively small study of psychiatric inpatients recently reported a modular multi-informant approach, resulting in promising levels of accuracy for predicting
further suicidal behaviour [26]. Machine learning
tech-niques utilising medical databases are also becoming more common in the pursuit of accurate detection of
suicide risk [27]. These are potential areas for further
research.
Clinical implications
This study adds to the evidence that scales, particularly the widely used SAD PERSONS Scales, are not suitable for predicting repeat episodes of self-harm or future sui-cide. Their overall performance as measured by the
AUC did not surpass a‘fair’ level of prediction, defined
as between 0.7 and 0.8 [28], likelihood ratios had weak
predictive ability [29] and performance did not exceed
that of clinicians’ratings (measured at 0.74) found in an
earlier study [12].
There is evidence that risk classification scales remain in widespread use despite growing evidence about their
poor predictive abilities [8, 10]. It is possible that
clini-cians welcome the structure they offer or the prompts for factors to consider, such as social isolation, in their overall formulation of a follow-up plan. The use of risk
scales may act as ‘aide memoires’ for less experienced
clinicians and may help in eliciting the relevant
informa-tion, provided the patient’s narrative is not lost [30].
Carter and colleagues also suggest that there should be a focus on modifiable risk factors, such as hopelessness, as
part of a needs-based assessment [10]. This would help
focus the assessment on a person’s situation and how
best to help manage it [31]. There is evidence that
as-sessment itself may be beneficial at reducing the risk of
a repeat self-harm episode [6,7], with patients valuing a
positive therapeutic alliance that promotes hope and
[image:9.595.61.539.97.323.2]en-couragement [32].
Table 5Area under the curve (AUC) for repeat self-harm by subgroups, with 95% confidence intervals,N= 4000, m = 1–5
MSHR ReACT SPS MSPS
Overall AUC (95% CI) 0.71 (0.69, 0.73) 0.71 (0.70, 0.73) 0.51 (0.48, 0.54) 0.49 (0.47, 0.51)
Male (n= 1589) 0.69 (0.67, 0.72) 0.69 (0.66, 0.72) 0.54 (0.51, 0.57) 0.52 (0.49, 0.55)
Female (n= 2411) 0.72 (0.70, 0.74) 0.73 (0.70, 0.75) 0.51 (0.49, 0.54) 0.49 (0.46, 0.52)
Aged < 19 (n= 552) 0.73 (0.68, 0.78) 0.73 (0.68, 0.78) 0.47 (0.42, 0.52) 0.48 (0.42, 0.53)
Aged = > 19 to 44 (n= 2556) 0.71 (0.69, 0.73) 0.71 (0.69, 0.73) 0.51 (0.49, 0.54) 0.48 (0.46, 0.50)
Aged 45+ (n= 892) 0.71 (0.67, 0.74) 0.71 (0.68, 0.75) 0.54 (0.49, 0.58) 0.51 (0.47, 0.56)
Main method of harm
Self-poison (n= 3241) 0.71 (0.69, 0.73) 0.72 (0.70, 0.74) 0.53 (0.51, 0.55) 0.50 (0.48, 0.52)
Self-injury (n= 759) 0.70 (0.67, 0.74) 0.67 (0.64, 0.71) 0.47 (0.43, 0.51) 0.47 (0.42, 0.51)
Assessed by:
Psychiatrist (n= 638) 0.67 (0.63, 0.71) 0.64 (0.60, 0.69) 0.61 (0.56, 0.66) 0.57 (0.52, 0.62)
Mental health nurse (n= 1273) 0.69 (0.66, 0.72) 0.72 (0.69, 0.75) 0.51 (0.47, 0.54) 0.47 (0.44, 0.51)
Other (n= 295) 0.67 (0.61, 0.74) 0.71 (0.64, 0.77) 0.50 (0.42, 0.57) 0.44 (0.37, 0.51)
History of self-harm (n= 2759) 0.63 (0.61, 0.66) 0.67 (0.65, 0.69) 0.45 (0.42, 0.48) 0.44 (0.41, 0.46)
No history of self-harm (n= 1241) 0.64 (0.59, 0.69) 0.60 (0.53, 0.67) 0.49 (0.42, 0.55) 0.46 (0.40, 0.52)
The SPS and MSPS performed slightly better for episodes assessed by a psychiatrist, though the per-formance was still below those of the ReACT and MSHR scales. Episodes assessed by a psychiatrist were more likely to involve individuals with a history of self-harm but not currently receiving treatment. The episodes by individuals assessed by psychiatrists were also more likely to be rated as moderate or high risk than low risk on both the SPS and the MSPS com-pared to episodes assessed by mental health nurses. In addition, the overall predictive accuracy of the ReACT scale was lower for episodes where individuals had no history of self-harm. These individuals were less likely to repeat self-harm, and the specificity was lower (16%), suggesting the incorrect identification of episodes that did not repeat resulted in reduced over-all performance. However, the difference in predictive accuracy between these groups was small and is un-likely to be of major clinical importance.
Conclusion
The findings of this study support existing clinical guidance, which suggests scales that classify patients into risk categories should not be used alone to allo-cate treatment or predict future risk of further self-harm or suicide. There was no evidence to support the use of risk scales with particular subgroups of pa-tients. While scales with high sensitivity may have some clinical use when considered alongside a
com-prehensive assessment [15], they are not suitable for
the purpose of prediction. Given that scales continue to be widely used by clinicians, future studies could consider if they could be combined with other ap-proaches to increase their effectiveness. For example, randomised controlled trials could combine structured risk assessment with other aspects of care, such as comprehensive follow-up planning or building thera-peutic alliance. A study carried out recently in the United States found that screening in the ED com-bined with a brief intervention consisting of a number of components (including safety planning and follow-up telephone calls), was associated with reductions in repeat suicide attempts and overall number of repeat
attempts [33]. Further studies of this kind could help
to determine aspects of risk scales that might be use-ful in the management of self-harm.
Additional file
Additional file 1:Supplementary tables: additional information about the risk scales and their items. Description of material:Table S1.Risk scales tested in the predicting risk of repeat self-harm cohort study,
Table S2.Risk scale items and corresponding variables from the self-harm cohort studies. (DOCX 23 kb)
Abbreviations
AUC:Area under the curve; ED: Emergency Department; MSHR: Manchester Self-Harm Rule; MSPS: Modified SAD PERSONS Scale; ONS: Office for National Statistics; ReACT: ReACT Self-Harm Rule; ROC: Receiver operating
characteristic; SPS: SAD PERSONS Scale
Acknowledgements
The authors would like to thank Dr. Matthew Carr at the University of Manchester for statistical advice.
Funding
This paper presents independent research funded by the National Institute of Health Research (NIHR) under its Programme Grants for Applied Research Programme (Grant Reference Number RP-PG-0610-10026). The views expressed are those of the authors and not necessarily those of the NHS, the NIHR or the Department of Health. K.H. and D.G. are NIHR Senior Investigators. K.H. is also supported by the Oxford Health NHS Foundation Trust and N.K. by the Greater Manchester Mental Health NHS Foundation Trust.
Availability of data and materials
The datasets used and analysed during the current study are not publically available. They are subject to strict data confidentiality policies at each site and only aggregated data is published.
Authors’contributions
NK, JC, ROC, DG and KH designed the study with input from SS and LQ. SS, LQ, DC, CC, DK, JN and RC extracted and processed the data. SS analysed the data. All authors interpreted the results and SS wrote the first draft. All the authors contributed to subsequent drafts and have approved the final version of the manuscript.
Ethics approval and consent to participate
The self-harm monitoring system in Oxford was approved by South Central
–Berkshire National Research Ethics Service and Derbyshire Research Ethics Committee approved the study in Derby. Both were granted ethical approval to collect data for both local and multicentre projects. South Manchester Research Ethics Committee reviewed the project in Manchester. The project was deemed not to require approval as the monitoring is conducted as part of a clinical audit system. The Bristol Self-Harm Surveillance Centre received ethical approval from University Hospitals Bristol NHS Foundation Trust and Southmead Research Ethics Committee approved the research database. All centres have approval under section 251 of the NHS Act (2006) to collect patient identifiable data without patient consent and Oxford, Derby and Manchester have consent to send patient details to the Data Linkage Service.
Competing interests
D.G., K.H. and N.K. are members of the Department of Health’s (England) National Suicide Prevention Advisory Group. N.K. chaired the NICE guideline development group for the longer-term management of self-harm and the NICE Topic Expert Group (which developed the quality standards for self-harm services). He is currently chair of the updated NICE guideline for depression. R.O.C. was a member of the NICE guideline development group for the longer-term management of self-harm and is a member of the Scottish Government’s suicide prevention implementation and monitoring group. All other authors declare no conflict of interest.
Publisher’s Note
Springer Nature remains neutral with regard to jurisdictional claims in published maps and institutional affiliations.
Author details 1
Centre for Mental Health and Safety, Manchester Academic Health Science Centre, University of Manchester, Manchester, England.2Centre for Suicide Research, University of Oxford Department of Psychiatry, Warneford Hospital, Oxford, England.3Centre for Self-harm and Suicide Prevention Research, Derbyshire Healthcare NHS Foundation Trust, Derby, England.4Population Health Sciences, Bristol Medical School, University of Bristol, Bristol, England. 5Institute of Population Health, University of Manchester, Manchester,
Wellbeing, University of Glasgow, Glasgow, Scotland.7Greater Manchester Mental Health NHS Foundation Trust, Manchester, England.
Received: 23 January 2018 Accepted: 16 April 2018
References
1. Hawton K, Bergen H, Casey D, Simkin S, Palmer B, Cooper J, Kapur N, Horrocks J, House A, Lilley R, et al. Self-harm in England: a tale of three cities - multicentre study of self-harm. Soc Psychiatry Psychiatr Epidemiol. 2007;42(7):513–21.
2. Carroll R, Metcalfe C, Gunnell D. Hospital presenting self-harm and risk of fatal and non-fatal repetition: systematic review and meta-analysis. PLoS One. 2014;9(2):e89944.
3. Bergen H, Hawton K, Waters K, Ness J, Cooper J, Steeg S, Kapur N. Premature death after self-harm: a multicentre cohort study. Lancet. 2012; 380(9853):1568–74.
4. Ness J, Hawton K, Bergen H, Cooper J, Steeg S, Kapur N, Clarke M, Waters K. Alcohol use and misuse, self-harm and subsequent mortality: an epidemiological and longitudinal study from the multicentre study of self-harm in England. Emerg Med J. 2015;32(10):793–9.
5. NICE. The long term care and treatment of self-harm. Clinical guideline 133. London: National Institute of Health and Care Excellence; 2011.
6. Kapur N, Steeg S, Webb R, Haigh M, Bergen H, Hawton K, Ness J, Waters K, Cooper J. Does clinical management improve outcomes following self-harm? Results from the multicentre study of self-harm in England. PLoS One. 2013;8(8):e70434.
7. Steeg S, Emsley R, Carr M, Cooper J, Kapur N. Routine hospital management of self-harm and risk of further self-harm: propensity score analysis using record-based cohort data. Psychol Med. 2017;48(2):1–12.
8. Quinlivan L, Cooper J, Steeg S, Davies L, Hawton K, Gunnell D, Kapur N. Scales for predicting risk following self-harm: an observational study in 32 hospitals in England. BMJ Open. 2014;4(5):e004732.
9. Quinlivan L, Cooper J, Davies L, Hawton K, Gunnell D, Kapur N. Which are the most useful scales for predicting repeat self-harm? A systematic review evaluating risk scales using measures of diagnostic accuracy. BMJ Open. 2016;6(2):e009297.
10. Carter G, Milner A, McGill K, Pirkis J, Kapur N, Spittal MJ. Predicting suicidal behaviours using clinical instruments: systematic review and meta-analysis of positive predictive values for risk scales. Br J Psychiatry. 2017;210(6):387-+. 11. Katz C, Randall JR, Sareen J, Chateau D, Walld R, Leslie WD, Wang J, Bolton
JM. Predicting suicide with the SAD PERSONS scale. Depress Anxiety. 2017; 34(9):809–16.
12. Quinlivan L, Cooper J, Meehan D, Longson D, Potokar J, Hulme T, Marsden J, Brand F, Lange K, Riseborough E, et al. Predictive accuracy of risk scales following self-harm: multicentre, prospective cohort study. Br J Psychiatry. 2017;210(6):429-+.
13. Cooper J, Steeg S, Bennewith O, Lowe M, Gunnell D, House A, Hawton K, Kapur N. Are hospital services for self-harm getting better? An observational study examining management, service provision and temporal trends in England. BMJ Open. 2013;3(11):e003444.
14. Cooper J, Kapur N, Dunning J, Guthrie E, Appleby L, Mackway-Jones K. A clinical tool for assessing risk after self-harm. Ann Emerg Med. 2006; 48(4):459–66.
15. Steeg S, Kapur N, Webb R, Applegate E, Stewart SLK, Hawton K, Bergen H, Waters K, Cooper J. The development of a population-level clinical screening tool for self-harm repetition and suicide: the ReACT Self-Harm Rule. Psychol Med. 2012;42(11):2383–94.
16. Patterson WM, Dohn HH, Bird J, Patterson GA. Evaluation of suicidal patients - the sad persons scale. Psychosomatics. 1983;24(4):343-&.
17. Bolton J, Rae Spiwak R, Sareen J. Predicting suicide attempts with the sad persons scale: a longitudinal analysis. J Clin Psychiatry. 2012;73(6):e735–41. 18. Beck RW, Morris JB, Beck AT. Cross-validation of suicidal-intent-scale. Psychol
Rep. 1974;34(2):445–6.
19. Carroll R, Metcalfe C, Gunnell D. Hospital management of self-harm patients and risk of repetition: systematic review and meta-analysis. J Affect Disord. 2014;168:476–83.
20. Kapur N, Cooper J, King-Hele S, Webb R, Lawlor M, Rodway C, Appleby L. The repetition of suicidal behavior: a multicenter cohort study. J Clin Psychiatry. 2006;67(10):1599–609.
21. Hawton K, Witt KG, Taylor Salisbury TL, Arensman E, Gunnell D, Hazell P, Townsend E, van Heeringen K. Psychosocial interventions for self-harm in adults. Cochrane Database Syst Rev. 2016;5. Art. No.: CD012189.https://doi. org/10.1002/14651858.CD012189.
22. Royston P, White IR. Multiple Imputation by Chained Equations (MICE): implementation in Stata. J Stat Softw. 2011;45(4):1–20.
23. Rubin DB. Multiple imputation for non-response in surveys. New York: John Wiley & Sons; 1987.
24. Altman DG, Bland JM. Diagnostic-tests-3 - receiver operating characteristic plots .7. Br Med J. 1994;309(6948):188.
25. Kapur N, Murphy E, Cooper J, Bergen H, Hawton K, Simkin S, Casey D, Horrocks J, Lilley R, Noble R, et al. Psychosocial assessment following self-harm: results from the multi-centre monitoring of self-harm project. J Affect Disord. 2008;106(3):285–93.
26. Hawes M, Yaseen Z, Briggs J, Galynker I. The Modular Assessment of Risk for Imminent Suicide (MARIS): a proof of concept for a multi-informant tool for evaluation of short-term. Compr Psychiatry. 2017;72:88–96.
27. Walsh CG, Ribeiro JD, Franklin JC. Predicting risk of suicide attempts over time through machine learning. Clin Psychol Sci. 2017;5(3):457–69. 28. Metz CE. BASIC PRINCIPLES OF ROC ANALYSIS. Semin Nucl Med. 1978;
8(4):283–98.
29. Hancock M, Kent P. Interpretation of dichotomous outcomes: risk, odds, risk ratios, odds ratios and number needed to treat. J Physiother. 2016; 62(3):172–4.
30. Runeson B, Odeberg J, Pettersson A, Edbom T, Adamsson IJ, Waern M. Instruments for the assessment of suicide risk: a systematic review evaluating the certainty of the evidence. PLoS One. 2017;12(7):e0180292. 31. Ryan CJ, Large MM. Suicide risk assessment: where are we now? Med J
Aust. 2013;198(9):462–3.
32. Hunter C, Chantler K, Kapur N, Cooper J. Service user perspectives on psychosocial assessment following self-ham and its impact on further help-seeking: a qualitative study. J Affect Disord. 2013;145(3):315–23.