2016 International Congress on Computation Algorithms in Engineering (ICCAE 2016) ISBN: 978-1-60595-386-1
1 INTRODUCTION
With the rapid development of market economy, the products updating is accelerating. Therefore, how to rapidly develop a new product has become an urgent problem for enterprises. The traditional serial devel-opment mode cannot meet the demands any more, and fully parallel development mode is hard to be realized because of various restrictions. Therefore, the re-searchers and enterprises are paying more attention to overlapping development mode [1]. Overlapping is defined: Different with traditional serial mode, the downstream activity starts before the upstream activity ends, as shown in Figure 1. Overlapping activities are operated by pre-releasing information and controlled as a whole, which are very different from serial activi-ties [2].
Time overlapping and information dependence are two key points of the overlapping activities. The pre-releasing information of upstream activities allows the downstream activities starting in advance. The upstream activities may produce new information, and pre-release information may change as well, which cannot make the activities carry on in accordance with the updated information, and the downstream
[image:1.516.275.452.467.533.2]activi-ties have to be reworked consistently in accordance with the result of information exchange. Overlapping will shorten the overall duration, which can reduce the cost. However, information exchange and rework will extend the overall duration, and the information ex-change and downstream activity’s rework will in-crease the total cost as well.
Figure 1. Overlapping activities.
On the other hand, time and cost are two important goals of design process planning, thus the trade-off between benefits due to duration shortening and losses due to information exchange and rework has become a key problem about overlapping. Therefore, many scholars establish models on this issue and try to op-timize the models by simulating and calculating.
Reza Dehghan [3] believes that overlapping is the essence of the design process rather than a way to save time, and he introduces the concept of the equivalent
Research on Simulation of Overlapping Activities Based on Simio
Ting Xu1, 2, Qi Gao1, 2*, Jianrong Gao1, 2, Hengdong Guo1, 2 & Chao Jiang1, 2 1
School of Mechanical Engineering, Shandong University, Jinan, Shandong, China 2
Key Laboratory of High Efficiency and Clean Mechanical Manufacture, Ministry of Education, Shandong Uni-versity, Jinan, Shandong, China
ABSTRACT: In order to describe and plan the overlapping activities of product design process, a dynamic simulation model of overlapping activities is established with 3D system simulation software Simio, which is based on a mathematical model, including an information model, an information exchange strategy and a sin-gle-objective decision model. Within the simulation model, the executing process and results of overlapping activities are contrasted by setting the start time of downstream activity to different values, in order to search for the optimal time to start the downstream activity. The validity of the simulation model is illustrated by a tion example about a flatness prober. The overlapping activities’ executing process is optimized with the simula-tion model based on Simio, avoiding the complicated calculasimula-tion and program development as well.
Keywords: design process simulation; overlapping activities; Simio
rework duration, which is equal to the product of re-work probability and rere-work duration. The calculation formula of equivalent rework duration is respectively given for the cases of two and three activities overlap-ping, and he accomplishes the formulation of trade-off of time and cost. Wenjian M [4] establishes the parallel product development model based on the unidirec-tional information transmission, constructs the global benefits variable considering development time and cost, and obtains the optimal time to start downstream activity and the optimal information exchange times by derivation. Tinggui C [5] explores the influence of information progress degree and sensitivity on over-lapping, and verifies the validity of the method by data calculation. Wenjian M and Tinggui C use mathemat-ics analytic method to solve the model and search for the optimization, but its disadvantage lies in: It could not describe the model with multiple execution modes; it is unable to describe the uncertain dynamic variable; it is difficult to calculate complicated models and prone to making errors. Zhaoyun W [6] establishes
time overlapping model and objective decision model according to coexistence of income and price. Instead of traditional mathematical method, he optimizes the model by simulation method with Matlab, which can make up the deficiency of the analytical method, but still cannot realize the dynamic simulation. Petri-net has a strong capability in dynamic simulation, but it cannot describe the iterative characteristic of the de-sign activities. Therefore, many scholars have to com-bine Petri-net with other modeling and simulation tools [7]. In recent years, due to the deficiencies of the above analysis or simulation methods, some profes-sional process simulation software are widely used because of its high flexibility and high degree of free-dom in the field of design process simulation. Baosen Y [8] establishes a mathematical model for describing the executing process of overlapping activities and carries out the simulation with Arena. But this model doesn’t plan information exchange, thus every mation modification or the arrival of the new infor-mation will trigger the rework of the downstream activity. Such frequent information exchange will disrupt the downstream activity; on the other hand, many functions need to be met by secondary devel-opment due to its low degree of module integration, and Arena is not suitable for dynamic simulation and does not have three-dimensional animation.
In conclusion, researchers have established a num-ber of models on the information flow and activity rework of overlapping, and carried out detailed de-scriptions on the execute process of the overlapping. These studies focus on establishing models, but pay little attention to simulating. However, the embedded analysis of the models has to be based on a large amount of data and concrete examples [9]. Therefore, it is especially necessary to search for a better design process simulation method. The software Simio is the new generation 3D system simulation software based
on “smart object”, established by American SimioLLC Company in 2004. It has been successfully applied to simulation analysis of airports, harbors, passenger stations, supply chains, assembly lines, medical indus-tries, military resources and many other areas [10, 11], not extended to the design process simulation research field yet. However, the problems Simio solved in these fields are very similar to problems of the design process simulation.
Simio can simulate dynamically discrete systems; product design process is a continuous process, but many researches have transferred it into discrete sys-tem by extracting key events. The characteristics of randomness and iteration of the design process can be described by Simio’s probability function and failure event. Simio’s modules about time, cost, resources and other parameters can be used to describe the dura-tion (total duradura-tion, rework duradura-tion), cost, and re-sources (designers, organizations, machines, etc.) of the design process; after running the simulation model, Simio will generate large amounts of data, benefiting for deeply analyzing the design process. Based on the above analysis, Simio is used as the design process simulation tool in this paper.
Based on analyzing the characteristics of overlap-ping, Reference 6 establishes an information model to describe information exchange and activity rework, as well as objective decision model to optimize design process. Based on the mathematical models in Refer-ence 6,a dynamic simulation model is established to explore how to simulate and optimize the design pro-cess by Simio.
2 MATHEMATICAL MODEL ON OVERLAPPING ACTIVITIES
2.1 Information model of upstream activity
Information accumulation function is adopted to de-scribe the progression of upstream activity infor-mation. The information accumulation function of sub-information is shown as Equation (1):
= ∗
+ 1 − , 0 ≤ ≤
1, ≤ ≤
(1)
It is provided that the number of sub-information from upstream activity to downstream activity is “i”.
is the progression of sub-information i; tis activity executed time; is execution duration of sub-information i(≤ ); is innovation index; is evolutionary path index. is provided as the propor-tion of sub-informapropor-tion i in the overall informapropor-tion, “n” as the total number of sub-information, then the over-all information model could be expressed as Equation (2):
We take upstream activity information being modi-fied as events, which happens randomly, uncertainly, and could be regarded as stochastic events. As shown in Equation (3), a non-stationary Poisson process with an intensity of μt is adopted to describe the stochas-tic events.
μt = μ ∗ $1 + % ∗ 2 ∗'− 1( (3)
μ is average Poisson intensity; % is overall infor-mation progression rate.
Thus, within), + Δ+, the times of information changes can be calculated with Equation (4):
,./μt -≈ 1 ∗ ∆ ∗ $3'2 ∗ + ∆ + 1 − %((4)
2.2 Information exchange strategy
At the early stage of the overlapping activities, the upstream activity may make an estimation or assump-tion about the incomplete informaassump-tion. As the activi-ties progressing, the upstream activity would produce new information, which will influence the downstream activity. On the other hand, the modify information of upstream activity will modify the previously false information. Both of the new information and modify information will make downstream activity to rework. Rework duration is concerned with rework amount, which is determined by the influence of new and modify information on downstream activity.
Within ∆t, the influence on downstream activity of new information could be calculated with Equation (5):
∆45= ∑ 67!" ∗ ∆= ∑ 67!" ∗ ) + ∆t − +(5)
6 is the influence of sub-information i on down-stream activity; his the number of sub-information generated new information within ∆t.
The influence of modified information on down-stream activity could be calculated with Equation (6):
∆49= ∑ 6:!" ∗ (6)
;: The number of sub-information generated modi-fied information within ∆t.
Therefore, the total influence of upstream activity on downstream activity could be calculated with Equation (7):
∆P = ∆45+ ∆49 (7) Theoretically, information should be transmitted to downstream activity as soon as possible to reduce the rework amount and additional losses. However, it takes designers time and cost to exchange information, and too frequent information exchange and activity rework will disrupt the normal design work as well. Therefore information exchange is a double-edged
sword with advantages and disadvantages, which needs information exchanging strategy to plan.
Thus, the following information exchanging strate-gy is adopted in this paper. The first information ex-change happens when downstream activities start. During the overlapping period, information exchange happens when P = ∑ ∆4 ≥ ; otherwise, continue to accumulate influence until meeting the trigger condi-tions. In other words, when the information influence reaches threshold () after several∆t, the information exchanges once. The last information exchange hap-pens when upstream activity ends. Except the first exchange, every information exchange is followed by downstream activity rework.
P = ∑ ∆4 ≥ (8) The corresponding rework duration at different time is expressed with rework influence function as Equa-tion (9):
Rt = 3 ∗ 4 (9)
3: Effective progression time of downstream activities at t (excluding information exchange dura-tion and rework duradura-tion).
2.3 Single-objective decision model
As two important goals of product design process planning, time and cost are closely relevant [12].
Over-lapping product development mode could not only shorten developing time, but also increase the cost in exchanging information and activity rework. There-fore, a total benefit considering both time and cost is taken as optimizing object, as shown in Equation (10):
G = H − W = ∆T ∗ C7− )D∗ CD+ E − 1 ∗ C3+(10) G is global benefit; H is benefits obtained by short-ening developing time; W is costs due to information exchange and rework; C7 is the benefit obtained by shortening per unit developing time; C3 is the cost that each information exchange takes.
Therefore, the planning of overlapping activities can be concluded a single-objective problem: search for the optimal time to start downstream activity (FG∗ ) and obtain the maximum total benefit.
3 SIMULATION MODEL ON OVERLAPPING
ACTIVITIES
The above-mentioned model will be simulated with Simio by describing upstream and downstream activi-ties with “Server”, describing information exchanges and activity rework with “Failure”. Here are the steps to establish the simulation model:
“ForB”).
(2) Set path of “ForA” to “source-ServerA-sink”, and set path of “ForB” to “source-ServerB-sink”.
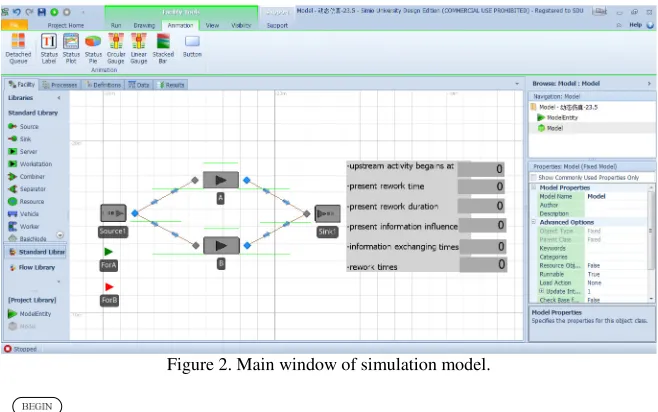
(3) The “ProcessingTime” of A and B are respec-tively set to the upstream and downstream activities’ initial duration. Failure duration is set to rework dura-tion from “Step (4)”. Repairing duradura-tion is obtained from Equation (9). And the main window of the simu-lation model is shown in Figure 2.
(4) It is logically complicated to obtain the infor-mation influence and rework duration. Therefore, flow diagrams are adopted to describe the complicated logical relationship, as shown in Figures 3 and 4. The variables in the diagrams are: loop variable “step”, present time “TN”, row number “row”, the accumu-lated times of modify information happens “HI”, the accumulated influence of new information “deltPN”, the initial influence of new information “PN0”, the influence modify information “49”. Create a table to store the time at which the activity rework will happen. The logical model is finally established in Figure in
Simio. (5) Create “FloorLable” and “StatusLable” to show
key parameters including: the moments when down-stream activity begins or when activity rework;
accu-mulated times of exchange and rework happened, etc. (6) Create “ReworkCostCenter”, “InformationEx-changeCostCenter” and “SaveCostCenter” to simulate rework cost (−), information exchange cost (−) and benefit due to shortening developing duration (+). The total benefit can be obtained from the simulating re-sults.
(7) Eventually, verify the simulation model with 2 kinds of activities of a flatness prober developing pro-ject, whose upstream activity contains 4 kinds of sub-information. The optimal time to start downstream activity is obtained by comparing global benefits. In addition, we can observe the activities operating dy-namically, including when and how long the infor-mation exchange and activity rework happens, or when upstream and downstream activity start and end, etc.
4 CASE STUDY
4.1 Case data
The design process of a flatness prober will be ana-lyzed to prove the validity of the proposed simulation
[image:4.516.98.427.324.530.2]Figure 2. Main window of simulation model.
model. Within the multiple activities, the designing activity of box is set as upstream activity A, and the designing activity of system hardware is set as down-stream activity B. The duration of A: TA=30 day; the duration of B is TB=40 day; Ch = 2500 dollar per day,
r
C = 700 dollar each time,C = 200 dollar each timec .α =
0.3, μ = 0.4, e = 0.4.Upstream activity produces 4 kinds of sub-information, whose parameters are shown in Table 1.
4.2 Results analysis
(1) Starting from FG= 0, we simulate different situ-ations for different FG in step 5. And the simulation results are shownin Table 2.
E is the times of information exchange happens;
ER is the times of rework happens; is global dura-tion; ∆ is the shortened duration contrasted with serial mode; D.S is the duration of information ex-change and rework; D is the duration of rework; S
is the duration of information exchange; CD is global rework cost; CS is global information exchange cost;
C7 is the benefits due to shortening duration; T is global benefit.
(2) As Table 2 shows, the maximum of global bene-fit may rise when FG is around 20. Therefore, in step 1, we simulate different situations for different FG when FG is around 20. The simulation results are shown in Table 3.
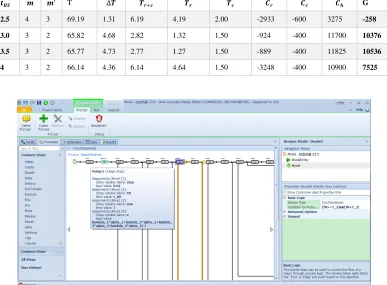
(3) AsTable 2 shows, the maximum of global bene-fit rises when FG is around 23. In this case, the unit of time is “day”, therefore it is necessary to enhance the accuracy to be half a day. The simulation results are shown in Table 4.
(4) The relationship between G and t_BS is visually shown as Figure 6.
[image:5.516.55.466.70.135.2]As (1), (2), (3) and (4) show, when FG= 23.5, that is to say, when downstream activity starts at the afternoon of 23rd day after upstream activity started, the global benefit gets maximum, and the global dura-tion is minimum.
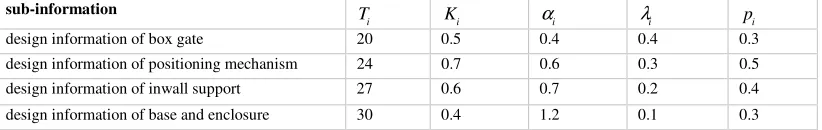
Table 1. Parameters of sub-information.
sub-information
i
T Ki αi λi pi
design information of box gate 20 0.5 0.4 0.4 0.3
design information of positioning mechanism 24 0.7 0.6 0.3 0.5
design information of inwall support 27 0.6 0.7 0.2 0.4
[image:5.516.50.472.87.432.2]design information of base and enclosure 30 0.4 1.2 0.1 0.3
Table 2. Simulation results for different FG.
\]^ _ _R T ∆` `a.b `a `b ca cb cd e
0 13 12 106.97 -36.47 66.97 60.47 6.5 -42329 -2400 -91175 -135904
5 11 10 98.50 -28.0 53.50 48.00 5.50 -33600 -2000 -70000 -105600
10 8 7 76.33 -5.83 26.33 22.33 4.00 -15631 -1400 -14575 -31606
15 6 5 69.49 1.01 14.48 11.48 3.00 -8036 -1000 2525 -6511
20 4 3 66.14 4.36 6.14 4.14 2.00 -2898 -600 10900 7402
25 3 2 67.74 2.76 2.74 1.24 1.50 -868 -400 6900 5632
30 1 0 70.5 0 0.5 0 0.50 0 0 0 0
Table 3. Simulation results for different FG when FG is around 20.
\]^ _ _R ` ∆` `a.b `a `b ca cb cd G
16 6 5 70.73 0.23 14.73 11.73 3.00 -8211 -1000 -575 -9786
17 6 5 71.98 -1.48 14.98 11.98 3.00 -8386 -1000 -3700 -13086
18 5 4 67.38 3.12 9.38 6.88 2.5 -4816 -800 7800 2184
19 5 4 68.53 1.97 9.53 7.03 2.50 -4921 -800 4925 -796
20 4 3 66.14 4.36 6.14 4.14 2.00 -2898 -600 10900 7402
21 4 3 67.13 3.37 6.13 4.13 2.00 -2891 -600 8425 4934
22 4 3 68.16 2.34 6.16 4.16 2.00 -2912 -600 5850 2338
23 3 2 65.82 4.68 2.82 1.32 1.50 -924 -400 11700 10376
24 3 2 66.14 4.36 6.14 4.64 1.50 -3248 -400 10900 7252
Node1
deltPN= p1*I1(TN+step)+ p2*I2(TN+step)+
p3*I3(TN+step)+
p4*I4(TN+step)-PN0
deltN=μ*step*[e/TA*(2*TN+step)+(1-e)]
Nd=Nd+deltN
Nd≥1?
PM=random{p1*I1(TN),p2*I2(TN),p3*I3(TN),p4*I4(TN)}
Nd=Nd-[Nd],P=P+PM
P+deltPN≥α?
row=row+1
Record ”TN+step” Record ”P+deltPN”
PN0=p1*I1(TN+step)+ p2*I2(TN+step)+
p3*I3(TN+step)+ p4*I4(TN+step)
P=0,deltPN=0
TN=TN+step
TN+step≥T1?
Y
Y
N
N
N
Node2
deltPN=p1+ p2*I2(TN+step)+ p3*I3(TN+step)+ p4*I4(TN+step)-PN0
deltN=μ*step*[e/TA*(2*TN+step)+(1-e)] Nd=Nd+deltN
Nd≥1?
PM=random{p1,p2*I2(TN),p3*I3(TN),p4*I4(TN)} Nd=Nd-[Nd],P=P+PM
P+deltPN≥α?
row=row+1
Record ”TN+step” Record ”P+deltPN”
PN0=p1+ p2*I2(TN+step)+ p3*I3(TN+step)+ p4*I4(TN+step) P=0,deltPN=0
TN=TN+step
TN+step≥T2? Y
Y
N
N
N Y
Node3
deltPN=p1+p2+ p3*I3(TN+step)+ p4*I4(TN+step)-PN0
deltN=μ*step*[e/TA*(2*TN+step)+(1-e)] Nd=Nd+deltN
Nd≥1?
PM=random{p1,p2,p3*I3(TN),p4*I4(TN)}
Nd=Nd-[Nd],P=P+PM
P+deltPN≥α?
row=row+1
Record ”TN+step” Record ”P+deltPN”
PN0=p1+p2+ p3*I3(TN+step)+ p4*I4(TN+step) P=0,deltPN=0
TN=TN+step
TN+step≥T3? Y
Y
N
N
N
Node4
deltPN=p1+p2+p3+ p4*I4(TN+step)-PN0
deltN=μ*step*[e/TA*(2*TN+step)+(1-e)] Nd=Nd+deltN
Nd≥1?
PM=random{p1,p2,p3,p4*I4(TN)} Nd=Nd-[Nd],P=P+PM
P+deltPN≥α?
row=row+1
Record ”TN+step” Record ”P+deltPN”
PN0=p1+p2+p3+ p4*I4(TN+step) P=0,deltPN=0
TN=TN+step
TN+step≥T4? Y
Y
N
N
N Y
Y Y
END
Figure 6. The relationship between G and tBS.
In addition, the above simulation model can dy-namically simulate the design process by catching key parameters (such as when upstream activity begins, when rework happens, rework duration, present in-formation influence, times of inin-formation exchange and rework happened, etc.) and observing states of activities (including waiting, begins, finishes, ex-changing information, reworking, etc.) in real time. On the other hand, the simulation model produces much more than the above mentioned data, which benefits for the further quantitative evaluation on de-sign process.
5 CONCLUSIONS
A simulation model based on Simio is established to describe and plan overlapping activities of product design process, which deeply studies how information flows through design process and obtains the optimal time to start downstream activity. In this paper, Simio is introduced into design process simulation fields, verifying its feasibility by dynamically simulating overlapping design activities with Simio. What’s more, this paper provides theoretical guidance for designers and presents a new tool for researchers in design pro-cess simulation fields. However, our study is based on two assumptions: The effect of influence threshold isn’t taken into account; multi-activity overlapping isn’t referred to.
ACKNOWLEDGEMENT
[image:7.516.64.451.74.359.2]This work was supported by the Shandong Province Natural Science Foundation of China (GN: ZR2012 GM015) and the National High-Tech Research and Development Projects (863) (GN: 2013AA040204).
Table 4. Simulation results for different FG when FG is around 23.
\]^ _ _R T ∆` `a.b `a `b ca cb cd G
22.5 4 3 69.19 1.31 6.19 4.19 2.00 -2933 -600 3275 -258
23.0 3 2 65.82 4.68 2.82 1.32 1.50 -924 -400 11700 10376
23.5 3 2 65.77 4.73 2.77 1.27 1.50 -889 -400 11825 10536
[image:7.516.61.246.393.500.2]24 3 2 66.14 4.36 6.14 4.64 1.50 -3248 -400 10900 7525
REFERENCES
[1] Sandberg S, Lundin M. & Nasstrom M. 2013. Support-ing engineerSupport-ing decisions through contextual, mod-el-oriented communication and knowledge-based engi-neering in simulation-driven product development: an automotive case study. Journal of Engineering Design. 24(1): 45-63.
[2] Li-Hong Q. & Jian-Fei G. 2013.Stochastic network planning and simulation method for concurrent product development. Computer Intergrated Manufacturing Sys-tem. 14(12): 2354-2360.
[3] Reza Dehghan P D, Janaka Y. & Ruwnapura P D M A. 2014. Model of Trade-Off between Overlapping and Rework of Design Activities.
[4] Ma W, Liu W. & Li C. 2008. Overlapping and commu-nication frequency between activities within concurrent product development. Computer Intergrated
Manufac-turing System. 14(4): 631-636.
[5] Chen T. & Xiao R. 2008. Activity overlapping model with multiple IO in product development. Computer
In-tergrated Manufacturing System. 14(2): 255-261.
[6] Wu Z, Li L. & Zhao H. 2011. Overlapping model and simulation optimization in concurrent product develop-ment. Computer Intergrated Manufacturing System. 3 (17): 552-558.
[7] Li H, Yang B. & Yang X, et al. 2014. Product design process nodeling and simulation based on DSM and Colored Petri Nets. Chinese Journal of Mechanical
En-gineering. 25(1): 108-116.
[8] Bao-Sen Y. & Lu L. 2012. Simulation Research of the time-cost model in Stochastic Activity Network with Activities Overlapping. Journal of System Simulation. 24(3): 684-687.
[9] Gerwin D, Bhuiyan N. & Thomson V. 2012. A Quantita-tive Evaluation of Concurrent Product Development Ef-fectiveness Theories. IEEE TRANSACTIONS ON
EN-GINEERING MANAGEMENT. 59(3): 415-427.
[10] Tian S, Li S. & Liu X. 2012. The application study of Simio simulation in assembly line balance of excavator's axle. Manufacturing Automation. 34(7): 42-45. [11] Sun H, Xu Z. & Shi W. 2011. Simulation of Armored
Equipment Battlefield Repair Organization and Imple-mentation Process Based on Simio. Journal of System
Simulation. 23: 323-326.