2019 International Conference on Computational Modeling, Simulation and Optimization (CMSO 2019) ISBN: 978-1-60595-659-6
A Quantitative Study of Trade Potential between China and Iran
Jun-hua CHEN
1,2and Meng-ru REN
2,*1School of Geographical Science, Southwest University, Chongqing, China
2Research Centre of West Asia, Southwest University, Chongqing, China
*Corresponding author
Keywords: China, Iran, Trade Gravity Model, Trade Potential, Assessment.
Abstract. Iran is an important node country of the Belt and Road Initiative and has close economic
and trade ties with China. Domestic research on Sino-Iran economic and trade relations has mostly stayed in qualitative aspects such as trade characteristics, influencing factors, and future trends. However, on whether Sino-Iran trade has potential, how much potential it could reach and other issues, there is still a lack of quantitative accurate assessment and analysis. Based on the bilateral trade data of Sino-Iran from 2010 to 2016, this paper evaluates the potential of bilateral trade between China and Iran by establishing a model of trade gravity. The results show that oil price fluctuations and sanctions against Iran by major countries are important factors affecting the trade flows between China and Iran. The minimum value of the Sino-Iran trade potential index is 1.27, and the maximum value is 2.49. Therefore the Sino-Iran trade is a potential re-modeling type. The potential for commercial trade between the two countries is limited, and the development space for commodity trade needs to be further explored. China and Iran can seek new growth points in bilateral trade by establishing an emergency record for trade, enhancing trade mutual trust, increasing cultural exchanges and so on. This study could provide a scientific basis for our country to formulate policies to promote Sino-Iran economic and trade development in the future.
Introduction
China is vigorously promoting the construction of the Belt and Road. By actively constructing free trade zones with countries and regions along the Belt and Road, we can realize the big pattern of opening up to the outside world in the new era. Iran is a large country in the Middle East, with a large population and abundant resources, and close economic and trade ties with China. It is the main strategic fulcrum of China's Belt and Road in the Middle East, and it can completely become a breakthrough in the construction of the free trade zone network.
At present, from the scholars' study of China-Iran economy and trade, it is agreed that under the background of the Belt and Road situation, the two countries should strengthen industrial cooperation and bridge China's production capacity advantages with Iran's resource advantages [1-4]. Such as Qiao-mei Guo (2011) from the perspective of optimizing China's trade structure to study the structure of the Iranian trade products and put forward corresponding recommendations [5]. Hong-wei Zao (2008) studied the development potential of product trade and foreign investment between the two countries in the context of China's accession to the WTO [6]. Tao Yang (2011) started from the characteristics and constraints of economic and trade development between the two countries and provided suggestions for future China-Iran cooperation [7]. Jia-ling Zou (2016) and others believe that the trade in energy minerals makes China's trade with Iran relatively close [8]. Zhi-gao Liu (2018) believes that Iran is a highly central country and can be used as China's regional trading partner [9].
Research Methods and Data Sources
Based on the background of Belt and Road, this paper uses the bilateral trade data of 2010-2016 to establish a gravity model and evaluate the potential of bilateral trade, aiming to provide a scientific basis operation basis for bilateral economic and trade exchanges between China and Iran in the future.
Trade Potential Assessment Model
Scholars often use trade gravity models to assess the potential of trade between different countries
[10]
. The basic model of trade gravity is:
Xij=A YiYj
Dij (1) In the formula, Xij represents the export value of country i to country j, Yi, Yj represents the gross
domestic product of country i and country j, and Dij represents the distance between the capitals of i
and j or the economic center of gravity.
After the Belt and Road initiative was put forward, in order to further study the trade structure between China and other countries, scholars introduced the Belt and Road variable, border variable, WTO variable and exchange rate variable into the gravity model, and the expanded measurement model is:
lntradeijt=β0+β1lngdpit+β2lngdpjt+β3lndgdpit+β4lndisij+β5borderij+β6R&Bj+β7WTOijt+β8lnerit +εijt (2)
In formula (2), ln represents the natural logarithm of the variable, i represents China, and j represents other countries. t represents the year, β0 represents a constant term, β1-β8 represent
variable coefficients, and ε represents a model random error term. Tradeij represents the total
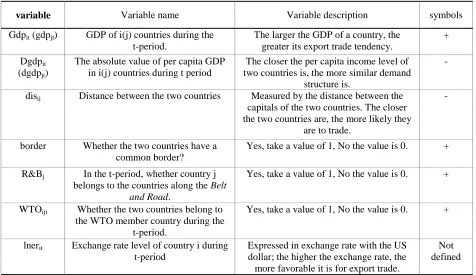
[image:2.595.61.537.482.757.2]bilateral trade between country i and country j. The specific description of the variables is shown in Tab.1.
Table 1. The variable definition and description.
variable Variable name Variable description symbols
Gdpit (gdpjt) GDP of i(j) countries during the
t-period.
The larger the GDP of a country, the greater its export trade tendency.
+
Dgdpit
(dgdpjt)
The absolute value of per capita GDP in i(j) countries during t period
The closer the per capita income level of two countries is, the more similar demand
structure is.
-
disij Distance between the two countries Measured by the distance between the
capitals of the two countries. The closer the two countries are, the more likely they
are to trade.
-
border Whether the two countries have a
common border?
Yes, take a value of 1, No the value is 0. +
R&Bj In the t-period, whether country j
belongs to the countries along the Belt and Road.
Yes, take a value of 1, No the value is 0. +
WTOijt Whether the two countries belong to
the WTO member country during the t-period.
Yes, take a value of 1, No the value is 0. +
lnerit Exchange rate level of country i during
t-period
Expressed in exchange rate with the US dollar; the higher the exchange rate, the more favorable it is for export trade.
Based on the bilateral actual trade volume and simulated trade volume between the two countries, we can estimate the bilateral trade potential index. The specific formula for calculating trade potential index is:
TPt=TVSVt
t (3)
In formula (3), TPt represents the bilateral trade potential index during t period, and TVt and SVt
represent bilateral actual trade volume and simulated trade volume during t period [12]. If TPt≥1.2, it
is called potential re-modeling, which means that the trade potential between trading partners is limited; when 0.8<TPt<1.2, it is named potential development type, indicating that there is room for
trade between the two countries; when TPt≤0.8 We call it huge potential type, which shows that the
trade potential between trading partners is very large, and the potential for deepening the economic and trade potential of the two countries is vast.
Data Sources
The data and sources used in this paper are: trade data from the International Trade Center (ITC) database; economic data from the World Bank database; distance is measured by Google Earth. Due to the slow update of international data, the time period is 2010-2016. In addition, due to the incompleteness of international data, Iran’s individual trade data in 2015 is missing. This article uses the 2013-2016 average instead.
Analysis of Trade Potential between China and Iran
Regression Analysis of Trade Gravity Model
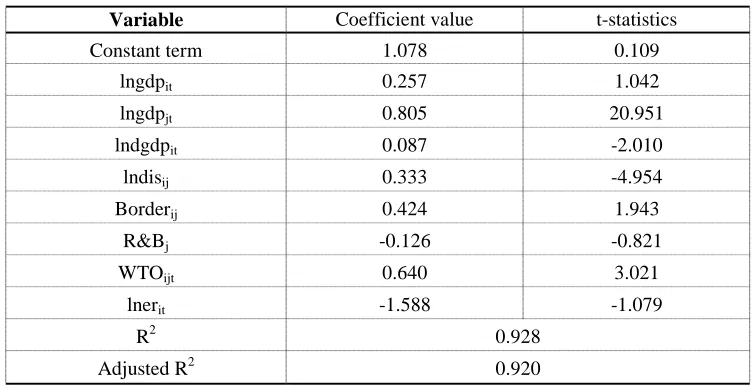
[image:3.595.109.485.547.740.2]In order to evaluate the bilateral trade potential between China and Iran, this paper selects data from 2010 to 2016 in 15 countries including the United States and Japan, with a total of 105 samples, and uses SPSS20.0 software for regression analysis. The reasons for the selection are as follows: First, the bilateral trade between these countries and China is relatively large, and the calculated regression model is more representative. Secondly, the samples are spatially dispersed and can more widely reflect the characteristics of trade between China and other countries. Finally, these national samples vary widely in each variable and can fully explain the characteristics of the different variables, reflecting the overall characteristics of the sample. The results of the regression analysis are shown in Tab.2.
Table 2. The regression results of trade gravity equation.
Variable Coefficient value t-statistics
Constant term 1.078 0.109
lngdpit 0.257 1.042
lngdpjt 0.805 20.951
lndgdpit 0.087 -2.010
lndisij 0.333 -4.954
Borderij 0.424 1.943
R&Bj -0.126 -0.821
WTOijt 0.640 3.021
lnerit -1.588 -1.079
R2 0.928
Adjusted R2 0.920
lntradeijt=0.257lngdpit+0.805lngdpjt-0.087lndgdpit-0.333lndisij+0.424borderij-0.126R&Bj +0.640WTOijt-1.588lnerit+1.087 (4)
The regression results show that for every 1% increase in China's GDP, the trade volume between China and other countries will increase by 0.257 percentage points; for every 1% increase in GDP of other countries, the bilateral trade volume will increase by 0.805 percentage points. This is because China's foreign trade is relatively large, and there is no significant trading partner in terms of trade volume growth. For every 1% increase in the bilateral GDP per capita, bilateral trade will decrease by 0.087 percentage points. The greater the gap in economic development between the two countries, the more unfavorable it is for trade. The distance between the capitals or economic centers of the two countries, whether they have a common border, and whether they belong to the WTO are the same as expected. In addition, whether a country belongs to the Belt and Road countries is contrary to the expected symbol, indicating that China’s positive influence on the economic and trade of countries along the Belt and Road has yet to be developed. China should make full use of the advantage platform of the “Belt and Road Initiative” to promote the common development of countries in the region and achieve win-win cooperation.
Sino-Iran Bilateral Trade Potential
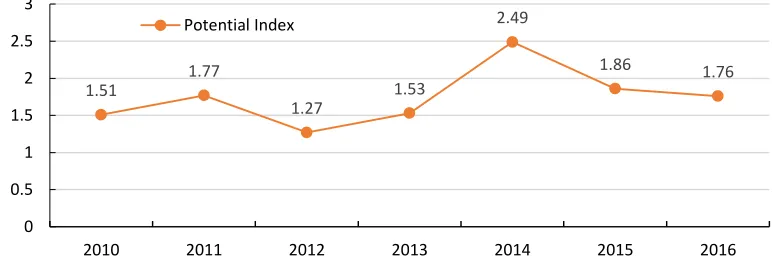
The China-Iran trade potential index for 2010-2016 is greater than 1.2, with a minimum of 1.27 in 2012 and a maximum of 2.47 in 2014. Given that TPt≥1.2, we can judge that the Sino-Iran trade
potential is a potential re-modeling, indicating that the trade potential between China and Iran has been fully explored to a large extent.
[image:4.595.106.492.451.582.2]From 2010 to 2016, the China-Iran trade potential index rose by 0.25, indicating that the bilateral trade development space has further narrowed by 16.89%. This shows that the potential for commodity trade potential that can be developed between the two countries is already small. In the future, both sides need to seek more trade growth points to reactivate bilateral trade.
Figure 1. The index of bilateral trade potential between China and Iran.
Summary
The Belt and Road Initiative is a new measure for China to promote openness and global development. This paper uses the bilateral trade data of China and Iran from 2010 to 2016 to assess the bilateral trade potential between China and Iran through the establishment of a gravity model. The results show that: First, oil price volatility and large countries' sanctions against Iraq are important factors affecting Sino-Iran trade flows. Second, China-Iran trade has gradually become more balanced and intensive, and Iran’s trade complementary with China has expanded. Third, the Sino-Iran trade potential is greater than 1.2, which is a potential re-modeling. The development potential of commodity trade between the two countries is limited. Fourth, the bilateral trade structure between China and Iran needs to be optimized, and the space for commodity trade development needs to be further explored.
1.51
1.77
1.27
1.53
2.49
1.86 1.76
0 0.5 1 1.5 2 2.5 3
2010 2011 2012 2013 2014 2015 2016
Acknowledgement
This paper is funded by the Fundamental Research Funds for the Central Universities (XDJK2017B021) and the Special Project for Humanities and Social Sciences Research Planning Fund of the Ministry of Education (1732003).
References
[1] Lin-ze Du. The Iranian Status and Sino-Iranian Cooperation in the One Belt and One Road [J]. Journal of Foreign Studies, 2016(03): 66-75.
[2] Xue-li Liu, Junhua Chen, Yu Ling, et al. The retrospect and Prospect of domestic research on the relationship of China and Iran [J]. World regional studies, 2016, 25(01): 31-38.
[3] Hong-da Fan. China's The Belt and Road initiative in Iran: political environment and coping style [J]. West Asia and Africa, 2016 (02): 49-64.
[4] Liang-xiang Jin. Iran's strategic position and Sino-Iranian relations in the post-agreement era [J]. Forum of World Economic and Politics, 2016(1): 34-47.
[5] Qiao-mei Guo. Study on the Commodity Trade Structure between China and Iran in the early 21st Century [D]. Chongqing: Southwest University, 2011.
[6] Wei-hong Zhao. Study on the Comparative advantages of China-Iran Merchandise Trade in the early 21st Century [D]. Chongqing: Southwest University, 2008.
[7] Tao Yang. Characteristics and Constraints of China-Iran Economic Trade [J]. Journal of Xidian University (Social Science Edition), 2011, Vol. 21 No. 221(02):55-58.
[8] Jia-ling Zou, Weidong Liu. Trade Network of China and Countries along Belt and Road Initiative Areas from 2001 to 2013 [J]. Scientia Geographica Sinica, 2016, 36(11): 1629-1636.
[9] Zhi-gao Liu, Tao Wang, Jung Won Sonn, Wei Chen. The structure and evolution of trade relations between countries along the Belt and Road [J]. Journal of Geographical Sciences, 2018, 28(9): 1233-1248.
[10] Buongiorno J. Gravity models of forest products trade: applications to forecasting and policy analysis [J]. Forestry, 2016, 89(2): 117-126.
[11] Skowron P, Karpiarz M, Fronczak A, et al. Spanning trees of the World Trade Web: real-world data and the gravity model of trade [J]. Acta Physica Polonica A, 2014, 127(3): 294-7.