BIROn - Birkbeck Institutional Research Online
Callender, Claire (2009) The impact of institutuional financial support in
England: higher education students’ awareness, knowledge and take-up
of bursaries and scholarships. Bristol, UK: Office for Fair Access. ISBN
9780956433602.
Downloaded from:
Usage Guidelines:
Please refer to usage guidelines at or alternatively
THE IMPACT OF INSTITUTIONAL FINANCIAL
SUPPORT IN ENGLAND: HIGHER EDUCATION
STUDENTS’ AWARENESS, KNOWLEDGE AND
TAKE-UP OF BURSARIES AND SCHOLARSHIPS
A Report to the
Office for Fair Access
Claire Callender
Birkbeck, London University
David Wilkinson
Rebecca Hopkin
National Institute of Economic and
Alternative formats
The publication can be downloaded from the OFFA web-site (www.offa.org.uk) under „Publications‟. For readers without access to the internet, we can also supply it on 3.5” disk or in large print. Please call 0117 931 7171 for alternative format versions.
Published by the Office for Fair Access
© OFFA 2009
The copyright for this publication is held by the Office for Fair Access (OFFA). The material may be copied or reproduced provided that the source is acknowledged and the material, wholly or in part, is not used for commercial gain. Use of the material for commercial gain requires the prior written permission of OFFA.
ACKNOWLEDGEMENTS
My thanks go to a range of people and organisations who have helped with this study. First, to Jean Arnold and David Barrett at OFFA who have been supportive throughout the duration of the study. Next, I would like to thank the Student Loans Company for their help
particularly in drawing the sample of students, and to the Centre for Customer Awareness Ltd (CCA) who conducted the survey of students on our behalf. I am indebted, as always, to both David Wilkinson and Rebecca Hopkin at the National Institute of Social Research for their help. Finally, I thank all the students who took part in this survey – without their help this study could not have happened.
All the views expressed in this report are solely those of the authors.
Professor Claire Callender
Birkbeck, University of London
CONTENTS
EXECUTIVE SUMMARY ... 12
1 INTRODUCTION ... 21
1.1 Policy context ... 21
1.2 Background ... 24
1.3 Aims and objectives of the research ... 26
1.4 Methodology ... 26
1.5 Terminology ... 27
1.6 Outline of the report ... 27
1.7 Sample of students surveyed ... 28
2 THE COSTS OF GOING TO UNIVERSITY ... 35
2.1 Introduction ... 35
2.2 Awareness and concern about the costs of going to university ... 35
2.3 The influence of the costs of going to university ... 48
2.4 Paying for the costs of going to university ... 57
2.5 Summary ... 60
3 STUDENTS‟ AWARENESS OF BURSARIES ... 62
3.1 Introduction ... 62
3.2 Students‟ awareness of bursaries ... 62
3.3 Summary ... 70
4 INFORMATION ON BURSARIES ... 71
4.1 Introduction ... 71
4.2 Looking for information on bursaries ... 71
6 STUDENTS‟ KNOWLEDGE AND UNDERSTANDING OF STUDENT FINANCIAL
SUPPORT AND BURSARIES ... 116
6.1 Introduction ... 116
6.2 How well-informed students were about student financial support including institutional support ... 116
6.3 Students‟ understanding of bursaries ... 121
6.4 How students describe bursaries and scholarships ... 124
6.5 Students‟ factual knowledge of bursaries ... 128
6.6 Summary ... 134
7 STUDENTS‟ ATTITUDES TO BURSARIES ... 136
7.1 Introduction ... 136
7.2 Students‟ views on bursaries ... 136
7.3 Summary ... 141
8 THE IMPACT OF BURSARIES ... 142
8.1 Introduction ... 142
8.2 Whether bursaries are important in deciding where to go to university ... 143
8.3 Finding out about the largest bursaries available ... 147
8.4 Whether the amount of bursary students could receive influenced to which university they applied ... 149
8.5 Whether the amount of bursary students could receive influenced what course they chose to study at university ... 155
8.6 Whether the amount of bursary students could receive influenced any other decision about what students would do while at university ... 158
8.7 The overall effectiveness of bursaries ... 160
8.8 Summary ... 161
TABLES
Table 1.1 Students surveyed by key socio-economic characteristics ... 30
Table 1.2 Students surveyed by additional socio-economic characteristics ... 31
Table 1.3 Students surveyed by institutional characteristics ... 32
Table 2.1 When students started to think about the costs of going to university and how they would pay for university, by key socio-economic characteristics ... 39
Table 5.1 Whether students had applied for a bursary, by whether they thought that they qualified for a bursary ... 99
Table 5.2 Why students had not applied for a bursary, by whether they thought they qualified for a bursary ... 102
Table 6.1 Students‟ assessment of how well-informed they were about student financial support, by whether they had looked for information on bursaries ... 120
FIGURES
Figure 2.1 Percentage of students who had thought about the costs of going to university and
how they would pay for university, by key socio-economic characteristics ... 36
Figure 2.2: When students started to think about the costs of going to university and how they would pay for university ... 37
Figure 2.3 How well-informed students felt about the costs of going to university, by key socio-economic characteristics ... 41
Figure 2.4 How worried students felt about the costs of going to university, by key socio-economic characteristics ... 43
Figure 2.5 How worried students felt about the costs of going to university, by how well-informed they were about the costs of going to university ... 44
Figure 2.6 How worried students felt about building up debt while at university, by key socio-economic characteristics ... 46
Figure 2.7 How worried students felt about building up debt while at university, by how well-informed they were about the costs of going to university ... 47
Figure 2.8 The extent to which the costs of going to university influenced students‟ decision about whether to attend university, by key socio-economic characteristics ... 49
Figure 2.9 The extent to which the costs of going to university influenced students‟ university and course selections, by key socio-economic characteristics ... 52
Figure 2.10 How the costs of going to university affected students‟ decisions... 54
Figure 2.11 Sources of funding students will receive or apply for ... 57
Figure 3.1 Percentage of students who had not heard of bursaries, by key socio-economic characteristics ... 63
Figure 3.2: When students first heard about bursaries ... 66
Figure 3.3 How students first heard about bursaries (multi-code) ... 66
Figure 3.4: How students first heard about bursaries through an HEI ... 69
Figure 4.1 Percentage of students who had looked for information on bursaries, by key socio-economic characteristics ... 72
Figure 4.2 Why students had not looked for information on bursaries (multi-code) ... 74
Figure 4.3 When students looked for information on bursaries ... 76
Figure 4.9 How easy students found it to work out information about bursaries using HEI
sources ... 87
Figure 5.1 Percentage of students whose chosen university had told them how to apply for a bursary, by key socio-economic characteristics ... 93
Figure 5.2 Percentage of students whose chosen university had told them how to apply for a bursary, by institutional characteristics ... 94
Figure 5.3 Percentage of students who thought that they qualified for a bursary, by key socio-economic characteristics ... 96
Figure 5.4 Whether students had applied for a bursary from their chosen HEI ... 98
Figure 5.5 Whether students had applied for a bursary from their chosen HEI, by key socio-economic characteristics ... 100
Figure 5.6 Why students had not applied for a bursary ... 101
Figure 5.7 How students had applied for a bursary from their chosen HEI ... 103
Figure 5.8 Whether students had been told that they would receive a bursary ... 105
Figure 5.9 How much bursary students hope to receive in their first year of study, by key socio-economic characteristics ... 107
Figure 5.10 How much bursary students hope to receive in their first year of study, by institutional characteristics ... 108
Figure 5.11 Whether the amount of bursary students hoped to receive was more or less than expected, by key socio-economic characteristics ... 110
Figure 5.12 When students would receive their first bursary payment ... 111
Figure 5.13 How students would receive their bursary payments, by key socio-economic characteristics ... 112
Figure 5.14 How students would spend their bursary, by key socio-economic characteristics ... 114
Figure 6.1 Students‟ assessment of how well-informed they were about student financial support ... 117
Figure 6.2 Students who understood what is meant by a bursary, by key socio-economic characteristics ... 121
Figure 8.1 To what extent students agreed with the statement that „bursaries are not important in deciding where to go to university‟, by key socio-economic characteristics ... 146
Figure 8.2 Whether students had found out which university would give the largest bursary, by key socio-economic characteristics ... 148
Figure 8.3 The extent to which the amount of bursary students could receive influenced which universities they applied to, by key socio-economic characteristics ... 151
Figure 8.4 The extent to which the amount of bursary students could receive influenced to which universities they applied by other factors ... 152
Figure 8.5 The extent to which the amount of bursary students could receive influenced which universities they applied to, by information seeking behaviour ... 153
Figure 8.6 How the amount of bursary a student could get influenced their university
decisions ... 154
Figure 8.7 The extent to which the amount of bursary students could receive influenced which courses they chose to study, by key socio-economic characteristics ... 157
Figure 8.8 Whether the amount of bursary students could receive had influenced their other decisions about what to do while at university, by key socio-economic characteristics ... 159
STATISTICAL APPENDIX
Table A1.2 Type of HEI attended, by key socio-economic characteristics ... 165
Table A 2.1 The associations between key socio-economic characteristics and the extent to which the costs of going to university influenced students‟ decisions about whether to attend university ... 166
Table A2.2 The associations between key socio-economic characteristics and the extent to which the costs of going to university influenced students‟ university and course selections ... 167
Table A2.3 How the costs of going to university affected students‟ decisions, by key socio-economic characteristics ... 168
Table A2.4 Sources of funding students will receive or apply for, by key socio-economic characteristics ... 169
Table A3.1 The associations between key socio-economic characteristics and students‟ likelihood to have not heard of bursaries from universities ... 170
Table A3.2 When students first heard about bursaries, by key socio-economic characteristics ... 171
Table A3.3 How students first heard about bursaries, by key socio-economic characteristics (multi-code) ... 172
Table A4.1 The associations between key socio-economic characteristics and students‟ likelihood to have looked for information on bursaries ... 173
Table A4.2 Why students had not looked for information on bursaries, by key
socio-economic characteristics (multi-code) ... 174
Table A4.3 When students looked for information on bursaries, by key socio-economic characteristics ... 175
Table A4.4 Sources of information students used to find out about bursaries, by key socio-economic characteristics (multi-code) ... 176
Table A4.5 How students rated the amount of information about bursaries provided by HEI sources, by key socio-economic characteristics ... 177
Table A4.6 How easy students found it to work out information about bursaries using HEI sources, by key socio-economic characteristics ... 178
Table A6.1 Students‟ assessment of how well-informed they were about student financial support, by key socio-economic characteristics ... 183
Table A6.2 The associations between key socio-economic characteristics and information search behaviour and whether students understood what is meant by a bursary ... 184
Table A6.3 How students describe a bursary, by key socio-economic characteristics (multi-code) ... 185
Table A6.4 How students describe a bursary, by information search behaviour & attitudes 186
Table A6.5 How students describe a scholarship, by key socio-economic characteristics (multi-code) ... 187
Table A6.6 Students‟ responses to statements on bursaries, by key socio-economic
characteristics ... 188
Table A6.7 Students‟ responses to statements on bursaries, by additional characteristics.... 189
Table A6.8 Students‟ responses to statements on bursaries, by information search behaviour ... 190
Table A6.9 Mean scores of knowledge, misunderstanding and ignorance about bursaries, by key socio-economic characteristics ... 191
Table A6.10 Mean scores of knowledge, misunderstanding and unawareness about bursaries, by students‟ information search behaviour ... 192
Table A7.1 Students‟ views about bursaries, by key socio-economic characteristics ... 193
Table 8.1 The determinants of whether students agree or partly agree that bursaries are not important in deciding where to go to university ... 194
Table A8.2 The associations between key socio-economic characteristics and other factors and the extent to which the amount of bursary students could receive influenced to which universities they applied ... 196
EXECUTIVE SUMMARY
This report is based on a survey of full-time Higher Education students in England, commissioned by the Office for Fair Access (OFFA), and undertaken by Professor Claire Callender of Birkbeck University of London, and the National Institute of Economic and Social Research. It forms part of a larger programme of research conducted for OFFA, which aimed to explore Higher Education Institutions‟ (HEI) strategies for improving the awareness and take-up of institutional bursaries and scholarships in England, and to examine the
awareness, knowledge, and take-up of institutional bursaries and scholarships among full-time undergraduate students, their parents and HE advisors in schools and colleges 1 and to produce a good practice guide for those working within HE responsible for bursaries and scholarships.2
Bursaries and scholarships, funded by HEIs, were part of a larger package of student finance reforms established in England in 2004 through new regulations and the 2004 Higher Education Act. These changes introduced variable tuition fees for full-time undergraduates and the re-instated maintenance grants for low-income students. HEIs charging tuition above the maximum maintenance grant (£2,835 in 2008/9) were obliged to give low-income students a minimum bursary, and could give these and other students additional discretionary financial support.
The financial aid an HEI offers forms part of an Access Agreement that HEIs must submit to the OFFA. OFFA is an independent, non-departmental public body, established by the 2004 Higher Education Act, to ensure that the introduction of higher tuition fees did not have a detrimental effect on widening student participation.
The survey of 4,848 students was based on a representative sample of full-time students in England who entered higher education for the first time in 2008/09 and qualified for either a full or partial government-funded maintenance grant. So the sample is representative of all students from households with residual annual incomes of under £60,005. The survey sought to explore students‟ awareness and knowledge of institutional bursaries and scholarships, and how they influenced student behaviour. The online survey was conducted in October 2008.
Some of the key findings are as follows:
THE COSTS OF GOING TO UNIVERSITY (CHAPTER 2)
1. Almost all students in the survey (97%) had thought about the costs of going to university and how they would pay for university. Most had first thought about these costs before applying to university.
2. The majority of students (88%) felt very or fairly well-informed about the costs of going to university.
3. Roughly three-quarters of students (73%) felt quite or very worried about the costs of going to university, and a similar figure (77%) felt quite or very worried about building up debt while at university.
4. Over half of the students (57%) stated that the costs of going to university had
influenced their decision about whether or not to attend university, and just under half (44%) about their university and course selections.
5. Students most commonly reported that the costs had prompted them to apply to universities nearer their home (37%) or to take a subject with better employment prospects (35%). A small proportion of students said university costs had encouraged them to apply to universities offering large bursaries or scholarships (11%) or courses offering large bursaries or scholarships (4%).
6. Students most often planned to pay for university by obtaining government-funded student maintenance grants (90%), loans for tuition fees (90%) and loans for living costs (79%). Over half of students (56%) also intended to supplement this funding through a bursary or scholarship. Other key sources of income were from paid employment (43% of students), and financial support from parents or family (32%).
STUDENTS’ AWARENESS OF BURSARIES (CHAPTER 3)
1. The majority of students (76%) had heard of bursaries. Roughly a half of these students first heard about them before submitting their UCAS application form and the other half at a later stage in the application process.
2. Students first heard of bursaries from a variety of sources - most frequently from HEIs (50%), schools and colleges, (32%) and their personal networks (31%).
3. Black and Asian students, and those from high-income households were most likely to be unaware of bursaries.
INFORMATION ON BURSARIES (CHAPTER 4) Looking for information on bursaries
(49%) and low-income (46%) households compared with those from high-income households (40%). This latter disparity is particularly important as all low and middle-income students qualified for bursaries because they received a full maintenance grant. This finding has implications for Directgov and other government-funded information sources, as well as HEIs.
When students looked for information
4. When students looked for information on bursaries broadly mirrored the timing of when they had first heard of bursaries. A little over two-fifths of students looked for information on bursaries before submitting their UCAS application form.
Ease of finding out about bursaries
5. Around one-third of students who had looked for information on bursaries reported that it was difficult to find out about what bursaries were available. Clearly, the provision of information can be improved for these students.
6. Students from high-income households (39%) were the most likely to have found it difficult to find out about bursaries compared with students from middle-income (29%) and low-income households (33%). Mixed ethnicity (35%) and White (33%) students also found it more difficult than Asian (22%) and Black (27%) students.
Sources of information
7. Students used a broad range of sources of information to find out about bursaries. By far the most widely used sources were those offered by HEIs, used by 81 per cent of students. While the dominant HEI source of bursary information was websites (57%), other HEI sources were important: prospectuses (37%), pamphlets or booklets (26%), open days (22%) and talks (15%). This highlights the importance of HEIs ensuring that the information they provide across all sources is accurate and up to date.
8. In addition, just over one-third of students accessed information from schools or colleges (36%) or their personal networks (35%) and 40 per cent of students reported using other sources including the Student Finance Direct or Student Loans Company websites (27%), UCAS (16%) and the Directgov website (14%). These outcomes closely reflect those identified for the sources of information through which students first heard about bursaries.
9. More than half of the students (60%) identified an HEI source as the most helpful, with 30% specifically identifying an HEI website. In contrast, just 14 per cent of students identified a school or college source as the most helpful and 10 per cent their personal networks.
minority also reported that there was not enough information about how much bursary they would receive (29%); whether they would qualify for a bursary (28%); and what bursaries are for (21%).
Ease with which students could work out information about bursaries
13. Students were asked to work out from the source of information they considered the most useful how easy it was to understand about seven key bursary issues. They had the most difficulty working out when they would receive a bursary (55%); whether bursary receipt affected their eligibility to other government-funded financial support (48%); and how to apply for a bursary (42%).
14. There was a clear association between the amount of information HEI sources provided about a key issue and how easy students had found it to work out this issue: the more information provided on the issue, the easier it was for students to work out.
APPLYING FOR AND RECEIVING A BURSARY (CHAPTER 5) Whether students thought they qualified for a bursary
1. The vast majority of students (81%) who had heard of bursaries thought that they qualified for one. Students from low-income (91%) and middle-income (91%) households were the most likely to think that they qualified for a bursary, while students from high-income households (58%) were the least likely. In other words, students who were eligible for a full government-funded maintenance grant were far more likely than those who qualified for a partial grant to think that they qualified for a bursary.
Whether students were told how to apply for a bursary by their chosen HEI 2. Of those students who had heard of bursaries, only 51 per cent had been told how to
apply for a bursary by the HEI they hoped to go to. Students whose place at an HEI was confirmed (52%) were nearly twice as likely as those whose place had not yet been confirmed (27%) to have been told how to apply for their bursary. This disparity suggests that HEIs concentrated bursary application support on accepted students at the expense of students who had applied to their institution.
Applications for a bursary
3. Just under a half of students who had heard of bursaries, had applied for a bursary from their chosen university. An additional 11% said their application had been automatic and 17 per cent did not know if they had applied or not. These students who did not apply were spread across all categories of HEBSS status, suggesting that for some students the HEBSS service may lead to some confusion.
for a bursary, the percentage who reported that the application process was confusing was even higher.
How students applied for a bursary
6. Students most frequently applied for a bursary from their chosen HEI either via Student Finance Direct (34%) or directly to the HEI (30%). A notable percentage (20%) had benefited from the automatic HEBSS application process and a similar percentage (19%) reported that they had applied for a bursary via their Local Education Authority.
Bursary receipt
7. The majority of students (63%) who had applied for a bursary directly or via HEBSS or did not know if they had applied, had been told that they would receive a bursary. However, one-third of these students had not yet been told whether or not they would receive a bursary. Given these students were surveyed in October 2008, and so had just started or were about to start their HEI course, this proportion of students who had not been told is very large. If bursaries are to be a useful component in students‟ financial planning, then students need to know about their bursary eligibility much earlier.
8. Students who had been told that they would receive a bursary hoped to receive £1,075 on average in their first year of study This is in line with national data which suggests that the typical bursary for a low-income student in 2007/08 was £1,000. Roughly a half of students (47%) reported that this was about what they expected, while for a third the amount was more than they expected and for just over a fifth (22%) it was less than expected. So over a half of students had had inaccurate expectations about the value of their bursaries.
9. Most students (56%) expected to receive their first payment between September and December 2008. A further 41% of students expected their first payment in January or February 2009 and just 3% later than that.
10. Nearly three-quarters (73%) of students reported that they would receive payments in instalments over the year. A further 13% reported that they would receive a lump sum and the remaining 14% did not know how they would receive payment.
How students would spend their bursary
2. Students most likely to receive means-tested bursaries – older (56%) and Black students (53%) and those with annual household incomes of £5,000 or less (53%) were the most well-informed about bursaries. By contrast, students least likely to receive bursaries – students from households with annual incomes of £25,000 and over (39%) were least likely to say they were well-informed about them.
3. However, access to information played a crucial role in how well-informed students were. Students who had looked for information were far better informed than those who had not looked (62% compared with 43%), especially where students found it easy rather than difficult to access information (74% compared with 33%).
4. HEIs and HE advisors over-estimated how well-informed students were about bursaries and scholarships when compared to students‟ own assessment of their knowledge about these types of institutional financial support.
5. The majority of students (84%) said they understood what is meant by a bursary. This subjective measure of bursary knowledge proved to be a fairly good indicator of students‟ objective knowledge, as measured by their responses to a series of statements about bursaries. Students who did not understand what a bursary was, gained the highest ignorance score and the lowest knowledge score.
6. Obtaining information on bursaries was the largest determinant of whether students understood what was meant by a bursary. Students who had not looked for
information on bursaries were 22 per cent less likely than those who had looked to understand the term, after controlling for a variety of factors.
7. Despite students‟ confidence in understanding what is understood by the term bursary, there was confusion about the traditional eligibility criteria used by HEIs for distributing bursaries – an award based on family income – and scholarships – an award based on student achievement. A sizable minority of students, especially older students, over-estimated the significance of where students lived in the allocation of bursaries while the wealthiest students particularly over-estimated the role of the subject studied and student merit. Older students also were most likely to under-estimate the importance of the subject studied in the disbursement of scholarships.
8. Students‟ recognition that they were poorly informed about bursaries was evident by the fact that only three per cent of students answered correctly all the statements about bursaries examined in this study while two per cent answered them all incorrectly. Students attending a Russell Group university and who rated an HEI source of information on bursaries as the most useful were the most knowledgeable.
9. 77 per cent of students were unaware of at least one bursary feature examined in this study and such ignorance was most pronounced among students who elsewhere in the survey said they did not understand what is meant by a bursary.
studied
48% - Students not getting a full maintenance grant can get a bursary
11. These topics are indicative of the bursary information gaps that HEIs and
government-funded sources need to fill. They point to those areas where HEIs and others could improve in both their marketing of bursaries and the information they provide students.
STUDENTS’ ATTITUDES TO BURSARIES (CHAPTER 7)
1. Large majorities of students rejected the idea that their parents did not want them to get a bursary (95%) or that bursaries were stigmatising (74%) while 62 per cent of students, especially older students, perceived bursaries as an indication that their university was investing in them.
2. Most students (65%) believed it was difficult to understand who qualified for bursaries. Sizable minorities of students also had difficulties understanding the differences between bursaries and scholarships (47%), accessing enough information on bursaries (43%), decoding the language used to describe bursaries (39%), and unravelling the complexity of bursaries (39%) - all of which are likely to contribute to low levels of bursary awareness and take-up.
3. A sizable minority of students also thought that the receipt of bursaries (30%) and scholarships (41%) was stigmatising, especially students from certain ethnic groups, which is likely to influence their take-up behaviour.
4. Students from households with annual incomes of £25,000 and over who did not qualify for a full grant had the greatest difficulties in understanding who qualified for bursaries (73%). They also were the most confused about bursaries (45%), and most frequently thought there was not enough information on bursaries (46%).
5. Older students were more likely than any other student group not to understand the difference between bursaries and scholarships (50%) and to find the language used to describe bursaries confusing (42%).
university, after controlling for a range of socio-economic and institutional characteristics.
3. A quarter of students who had heard of bursaries reported that the amount of bursary available influenced to which university they applied.
4. Students who were most concerned about the costs of attending university along with Asian and Black students, and students expecting to receive a bursary of £1,000 or more were most likely to be influenced by the amount of bursary when deciding to which university to apply, after controlling for a range of socio-economic and institutional characteristics.
5. The value of bursary offered was more likely to influence students‟ decision-making if they had looked for information on bursaries before they applied to university rather than once their place at university was confirmed and if they thought they qualified for a bursary, after controlling for a range of socio-economic and institutional characteristics.
6. The way in which the amount of bursary influenced students varied. Equal
proportions of students (27%) reported they were more likely to apply to universities offering higher bursaries when completing their UCAS application form, namely at the search stage; that the size of bursary influenced their final choice of HEI when selecting their firm offer and insurance offer, namely, at the choice stage; or that the amount of bursary was one of the factors they considered at either the search or choice stage.
7. The main reason (66%) the value of bursaries were not considered influential in students‟ decision-making was because other criteria, apart from bursaries, were more important when deciding which HEI to attend.
8. 12 per cent of students said their course choice was influenced by the amount of bursary offered.
9. Asian students were nine per cent more likely than White students to be influenced in their course choice by the amount of bursary they could receive while Black students were seven per cent more likely (after controlling for a range of socio-economic and institutional characteristics). However students from households with residual annual incomes of £25,000 and over were four per cent less likely than their peers with household incomes of £5,000 or under to be influenced, after controlling for socio-economic characteristics.
10. The main reason (66%) bursaries had not influenced students‟ course choice was that the course content was more important in their decision-making than the amount of bursary offered.
12. These findings confirm existing research that suggest that the availability and generosity of bursaries do play a role in some students‟ decision-making about to which universities to apply and which to attend. Bursaries are, therefore, an effective recruitment tool especially for those HEIs providing bursaries of £1,000 and over. They are particularly effective in influencing students‟ perceptions about the affordability of going to university.
1 INTRODUCTION
The Office for Fair Access (OFFA) commissioned Professor Claire Callender of Birkbeck, University of London, and the National Institute of Economic and Social Research to undertake research to inform the production of a good practice guide for improving the awareness and take-up of institutional bursaries and financial support among undergraduate students.
The study consisted of the following:
Interviews with key stakeholder organisations
A survey of HEIs and follow-up in-depth case studies of HEIs3 A survey of students entering HE for the first time in 2008/09
A survey of the students‟ parents4
A survey of HE advisors in schools and colleges5
This report covers the key findings from the survey of students.
Other documents produced arising out of this programme of research, apart from the reports on the four surveys, include a summary document of the findings from all four surveys and a good practice guide aimed at HEIs.6
1.1 Policy context
The 2004 Higher Education Act, which came into effect during 2006-07, deregulated full-time undergraduate tuition fees so that HEIs in England could charge anything from £0 to £3000. In 2008/09, the maximum tuition English higher education institutions (HEIs) could charge was £3,145 a year. In 2008/09, all but a handful of HEIs were charging the maximum tuition for their first degree courses but a few were charging less for sub-degree courses (e.g.
3
For the full report see Callender .C. (2009a) Strategies Undertaken By Higher Education Institutions In England To Increase Awareness, Knowledge, And Take-Up Of Their Bursaries And Scholarships Office for Fair Access, Bristol www.offa.org.uk/publications
4
For the full report see Callender .C. and Hopkin, R. (2009) Awareness And Knowledge Of Institutional
Bursaries And Scholarships Among The Parents Of Higher Education Students In England Office for Fair Access, Bristol www.offa.org.uk/publications
Foundation Degrees, HNCs). There was, however, considerably more variation in fees for both degree and sub-degree courses provided in the Further Education sector where less than half charged the maximum fees.
This variable tuition replaced the previous policy in which the government required all HEIs to charge a uniform flat rate of £1,200 for their undergraduate courses and gave means-tested discounts to low-income students, which were also set by the government. Under the old system, tuition costs were paid up front by students and their parents, although most low-income students paid no fees because of the means-tested discounts. In contrast, all new full-time English undergraduates, irrespective of their family‟s income, are now required to pay the new variable tuition amount. All these undergraduates can take out a government subsidised income-contingent loan to repay their tuition fees after graduation.
In addition, government-funded means-tested maintenance grants for low-income students were re-introduced which previously had been abolished in 1998. Initially set at £1,000, the maximum was raised to up to £2,700 from 2006. Thus today, all undergraduate students can receive government subsidised income-contingent loans for both their tuition and living costs while low-income students can also receive a grant and a mandatory bursary.
While the 2004 Act gave English HE institutions (HEIs) more freedom in setting
undergraduate tuition fees, HEIs that now charge tuition above £2,835 also have an obligation to provide bursaries of up to £310 to low-income students in order to supplement the
government-funded grants and maintenance loans students can also receive. Bursaries include financial assistance made to students mainly on the basis of financial need while scholarships are usually awarded on the basis of merit. Both forms of aid, which we call institutional financial support, are funded directly by HEIs, primarily from the additional income gained from the introduction of variable tuition.
£310 is the maximum bursary HEIs are obliged to pay low-income students. However, the government has encouraged HEIs to provide additional discretionary financial support exceeding this level to these and other students. These bursaries and the financial support an HEI offers form part of an Access Agreement that institutions who charge tuition fees of more than £1,225 must submit to the Office for Fair Access (OFFA). OFFA is an
independent, non-departmental public body that was established by the 2004 Act, to ensure that the introduction of higher tuition fees did not have a detrimental effect on widening student participation. The Access Agreements set out how each HEI will “safeguard and promote fair access”, especially for low-income students.7
It is important to distinguish between the mandatory and non-mandatory bursaries first introduced by HEIs in 2006-07. Mandatory bursaries of up to £310 (in 2008/09) are imposed by government for HEIs that charge tuition of more than £2,835, and must be targeted exclusively at the poorest students, defined as those in receipt of a full government
The discretionary nature of non-mandatory bursaries means that there are considerable differences in the type and scope of support offered by HEIs.8 Despite the government‟s and HEIs‟ endeavours to ensure that prospective and current students are aware of the new financial arrangements, various studies and media reports suggest that students are especially unaware of bursary provision.9 In addition, some have argued that bursaries are often
difficult for students to understand because of their complex eligibility criteria.10
Furthermore, the process set up to facilitate the take-up of bursaries and their administration - the Higher Education Bursary and Scholarship Scheme (HEBSS) initially encountered some difficulties.
HEBSS is run by the Student Loans Company (SLC), a UK public sector organisation established to administer government-funded student loans and maintenance grants to students throughout the United Kingdom. Under the HEBSS service, a student‟s eligibility for their chosen HEI‟s bursary or scholarship scheme is automatically assessed when they apply for government-funded financial support. However, in 2006/07 and again in 2007/08, HEBSS encountered a data-sharing problem.
In order for HEBSS (or in some cases a student‟s HEI) to process a student‟s bursary, the student had to agree to share with their HEI the financial information they provided the Student Loans Company when applying for a student grant and/or student loan. Many students did not understand this. They did not tick the “consent to share” financial information box on the student finance application form. As a result, students who were eligible for a bursary or scholarship but failed to tick the appropriate box did not
automatically receive their bursary. Together these factors have resulted in a large number of bursaries being unclaimed and a significant problem of bursary take-up across the sector in their first two years of operation11.
Bursaries and scholarships are not new. They have a very long history as an important source of financial support, especially for low-income students; but their significance declined with the introduction of statutory means-tested maintenance grants in 1962. Moreover,
traditionally, their reach was limited. Few HEIs gave aid, and only a small proportion of students benefited. What is new about the bursaries and scholarships developed as a direct result of the 2004 Higher Education Act is their function, scope, and potential. For the first time, they have been integrated into the statutory financial aid system, and all HEIs that charge tuition fees in excess of £2,835 (in 2008-09) must provide them. In terms of student financial support, the rise of bursaries present a new era in England with potentially far-reaching consequences. In addition, such institutional aid has tended to be ignored in
8
Callender, C (2010) Bursaries and Institutional Aid in Higher Education in England: Do they safeguard access and promote fair access? Oxford Review of Education, 36:1
9
discussions about cost sharing in HE.12 Debates on cost-sharing emphasise the financial roles played by government, parents, and students in meeting the costs of HE but rarely the role of HEIs themselves. Yet, HEIs, both in the United States and England, are now contributing considerable amounts of their own funds to help students and their families meet the costs of going to university.
1.2 Background
OFFA, as part of its regulatory duties, collects monitoring data from HEIs annually. According to its latest Annual Report,13 in 2007/08, universities and colleges spent £192 million on bursaries and scholarships for low-income students, which represents 21.8 per cent of the additional income they received from charging higher fees.14 Some 70 per cent of bursary money spent by HEIs in 2007/08 went to 133,000 students with household incomes of less than £17,910.
According to OFFA in 2008/09, 79 per cent of the HEIs (N=117) charging full tuition fees offered students in receipt of a full maintenance grant a bursary above the statutory level of £310. The mean value of a bursary for a student on full state support was around £900 a year while the median was £851. The range was £310 to £3,150. The average value of a bursary for a student in receipt of a full government grant attending a Russell Group university was more than double the average available to students at Post-1992 HEIs (£1,500 compared with £700). This considerable variation in the value of bursaries by different types of HEIs was also confirmed in a recent National Audit Office Report.15 In addition, the values of bursaries for low-income students at Russell Group universities currently range from £420 to £3,150 – a difference of £2,730. In contrast, the value of a bursary at a post-1992 HEI ranges from £310 to £1,143 – a difference of £833.
In addition to the core means-tested bursaries, in 2008/09 94 percent of HEIs also provided other discretionary bursaries and scholarships with additional or separate criteria. Some 38 per cent of these HEIs had some sort of scholarship, most of which were not means-tested and were typically worth £1,000. A further 20 per cent of HEIs had awards based on subject, 18 per cent offered awards for achievement or progression while at university; 13 per cent had schemes for students progressing from partner schools and 18 percent had awards targeted at care leavers.16
To date, very little research in England has examined the impact of the institutional bursaries and scholarships put in place in 2006, although there is a larger body of research on the impact of finances on participation in HE. Studies about bursaries from an HEI perspective include that of Temple et al17 who conducted case studies in 15 HEI exploring HEIs‟ initial
12
plans regarding the introduction of variable tuition fees and bursaries. They highlighted institutions‟ concerns about their position in the higher education marketplace and the role that both fees and bursaries played. Callender18 traced the origin of the current policy and government thinking behind the introduction of bursaries, including their objectives. She analysed the eligibility criteria used by 117 HEIs for disbursing their bursaries and
scholarships in 2006, in their first year of existence. Together these 117 HEIs had put in place over 300 different bursary and scholarships schemes, 60 per cent of which were means-tested and the remaining non-means-tested. Callender concluded that this institutional support was being used by HEIs as part of a competitive strategy both to widen participation and to assist their institutional repositioning in an increasingly competitive HE marketplace.
Consequently, there was sometimes a mismatch between government intentions in awarding bursaries and scholarships and the actual manner in which these awards were allocated by HEIs. The system designed to broaden access did, in part, achieve that goal, but it also yielded unanticipated and rather contradictory consequences. In some cases, bursaries and scholarships may have perpetuated the inequities across HEIs they were intended to alleviate; in some cases, they may have actually exacerbated those inequities. Callender‟s analysis suggests that, at times, bursaries and scholarships have been used more to the advantage of the HEIs than needy students, particularly when institutional aid was used as a competitive tool in admissions rather than serving those who were in most financial need.
Analysis of data on the impact of variable fees conducted by Universities UK19 also explored the effect of bursaries on applications. It found no relationship between the total amount of bursaries offered by HEIs and changes in application levels from 2005/6 to 2006/7. However, the conclusion from this research is highly questionable. The study only looked at
applications in aggregate and did not examine the application rates among those student groups who were likely to benefit from bursaries or who actually received bursaries. In some HEIs only very small proportions of students receive bursaries and hence any changes in applications from beneficiaries would not show at the aggregate level.
Davies et al20 investigated in 2006/07 whether students in their final year of schooling looked for information on bursaries and take them into consideration when deciding where to study full time in HE. They found that three-quarters of the students they surveyed understood what is meant by a bursary but less than a third had looked for information on bursaries, and overall their knowledge of bursaries was poor. In addition, most students had made their choices about studying in HE before they had heard about potential bursary options. Davies et al concluded that only large bursaries were likely to make a differences in students‟ HE choices but overall, the majority of students did not take bursaries into account in their decisions about where to study, although this varied by students‟ socio-economic characteristics. While this study provides useful insights, it was restricted to students
attending 20 schools and colleges in the Midlands who may not be representative of potential HE students within the whole region, or the student body as a whole.21
The 2007/08 Student Income and Expenditure Survey,22 which is based on a nationally representative sample of current HE students, examined students‟ receipt of bursaries. SIES found that around a third (35%) of students studying in England who were subject to the new student funding arrangements (introduced since 2006), benefited from a bursary, receiving an average of £980 each. This increased to around a half (49%) of new students from
routine/manual social class backgrounds and to two-thirds (66%) among those who received a maintenance or special support grant.
It is against this background that OFFA commissioned research to investigate what HEIs have done to increase student awareness and take-up of bursaries, and to explore what more could be done to increase student, parent and HE advisor awareness of bursaries and thus improve take-up, and to produce a good practice guide. The remit of this OFFA research is far wider than any other research conducted to date. It is the first study to systematically examine HEIs‟, students‟, parents‟ and HE advisors‟ attitudes to bursaries and the role they play.
1.3 Aims and objectives of the research
The overall aim of the study was to produce and disseminate a research-informed good practice guide to help increase the awareness and take-up of bursaries in England.
To meet this aim the study had the following objectives:
To identify the strategies that HEIs have used to increase student and parent awareness of bursaries within the academic year.
To identify what actions HEIs have taken to increase bursary take-up.
To identify the messages and sources of information that have or have the potential to increase pre-applicant and applicants‟ awareness of bursaries generally or at a specific institution, including any evidence that institutions have of effective terminology surrounding bursary awards.
To identify the different marketing campaigns that HEIs have used to promote their financial support packages to potential students and evaluate the comparative effectiveness of different approaches.
To use the results of the above to produce good practice guidance to inform staff in HEIs responsible for the publicity and delivery of bursaries how they can improve awareness and increase take-up.
(but not the sole) beneficiaries of mandatory and non-mandatory bursaries. The sample was drawn such that two-thirds were students in receipt of a full grant (i.e. with household incomes of £25,000 or below) and the remaining one-third from students in receipt of a partial grant (i.e. with household incomes of £25,001-£60,005).
Other sample design selections were based on the following student characteristics:
includes home students (EU students, and international students are excluded);
includes undergraduates (Initial Teacher Training students and PGCE students are excluded);
includes only English student attending HEIs in England;
excludes students going to HEIs where tuition fees lower than max £3,145;
excludes HE students registered at FE colleges;
excludes students in receipt of an NHS bursary (nurses, midwives etc. and/or intending to pursue these courses);
A web-based online survey was conducted in October 2008 with an initial sample of 20,000 students which were randomly selected from SLC records following the above requirements, plus students must have had a non-blank email address on the SLC record.
We had responses from 5,152 students, a response rate of 25.76 per cent which we consider to be a good response rate for a web-based survey. We then identified 304 respondents who were not attending Higher Education institutions and these were removed from the sample leaving us with 4,848 respondents.
The SLC collects demographic data on students and these data were linked to the survey responses. This reduced the overall length of the questionnaire and undoubtedly improved the survey response rate.
Analysis of survey response rates by a range of characteristics indicated few differential response rates. The only clear biases in the sample related to gender, whether the student received a tuition fee loan and the date their student record was created, which reflects the timing of their application. Weights were created such that the sample of survey respondents reflected the population of students in these dimensions
1.5 Terminology
Chapter 2 concentrates on issues related to the costs of going to university to locate the role of bursaries within a wider context. It explores students‟ concerns about university costs by identifying the extent to which students thought about the costs, and how well-informed and how worried they felt about the costs. Next, the chapter questions how, and to what extent, these costs influenced students‟ HE decisions. Finally, the chapter examines how students intended to pay for their time at university by examining the uptake of key sources of student financial support.
Chapter 3 turns to students‟ awareness of bursaries. The chapter considers whether students had heard of bursaries, and for those students who had heard of bursaries from HEIs, when and how this awareness had first been established.
Chapter 4 explores the provision of information about bursaries. It focuses on how students became informed about bursaries, whether they looked for information on bursaries including the reasons they had not looked, when students had looked, and how easy this process was. Then it examines which sources of information on bursaries students used, which were the most helpful, and their assessment of the adequacy of the information on bursaries provided, especially by HEIs.
Chapter 5 turns to students‟ applications for bursaries, and their consequent bursary receipt. The chapter explores the bursary application process, and the amount of support students received from their HEI, how many students applied and how they applied. The chapter then considers the nature of the bursaries students received, including the amount of bursary students expected, when and how this bursary would be received, and how students intended to use their bursaries.
Chapter 6 moves on to examine students‟ knowledge and understanding of student financial support and bursaries. It explores how well-informed students believed they were about various sources of financial support. Next, the chapter examines students‟ subjective understanding of bursaries and scholarships, and then assesses students‟ knowledge and understanding of bursaries using a more objective measure.
Chapter 7 is about students‟ attitudes to bursaries. By exploring students‟ perceptions of bursaries, the chapter attempts to shed light on factors which may facilitate or hinder bursary awareness and take-up and thus, the overall effectiveness of bursaries.
The final chapter 8 focuses on the impact of bursaries and their role in students‟ decision-making. It considered how important bursaries were to students when deciding where to go to university. Then it assesses whether the amount of bursary students could get influenced which HEI they attended, the courses they chose, and any other decision about what they would do while at university, and how the value of bursaries shaped their decisions.
followed by consideration of additional socio-economic characteristics which are used less frequently in the report. Then we explore the institutional characteristics of the students surveyed and finish off by looking at how the characteristics of the students are related to each other.
The socio-economic characteristics of the students surveyed
Table 1.1 shows that most students surveyed were:
female;
aged 24 years or under at start of course („younger students‟);
White;
from households with a residual income of greater than £5,000 but less than or equal to £25,000 („middle income households‟); and
Table 1.1 Students surveyed by key socio-economic characteristics
Characteristic % Base N
Gender
Female 57 2746
Male 43 2102
Age
24 years or under 87 4227
25 years or over 13 621
Ethnicity
White 73 3557
Mixed 3 164
Asian 11 515
Black 7 347
Other 2 87
Refused 4 178
Household income25
Low-income group (< £5,000) 30 1461
Middle income group (>£5,000-≤£25,000) 36 1754
High income group (>£25,000) 33 1633
Parent HE qualifications
Parents no HE qualifications 50 2421
Parents hold HE qualifications 35 1716
Don't know/NA/not answered 15 711
All 100 4848
Base: All students
In addition, as shown in Table 1.2, the majority of students surveyed were:
dependent students;26 single with no children; and
[image:32.595.89.499.188.507.2]living in university provided accommodation during term-time.
Table 1.2 Students surveyed by additional socio-economic characteristics
Characteristic % Base N
Dependency
Dependent 80 3869
Independent 20 979
Family type
Single, no children 91 4435
Single, dependent children 3 169
Married/cohabiting, no children 3 125
Married/cohabiting, dependent children 2 119
Living arrangements
University provided accommodation 54 2599
With parents/family 23 1118
Other rented accommodation 19 907
Other 4 189
Not answered 1 35
All 100 4848
Base: All students
The institutional characteristics of the students surveyed
Turning to the institutional characteristics of the students surveyed, Table 1.3 shows that the majority of students surveyed:
undertook their existing qualification at a Further Education college;
attended post-1992 universities;
attended universities with full HEBSS status; and
[image:33.595.84.499.248.667.2]were not studying a strategically important or vulnerable (SIV) subject.
Table 1.3 Students surveyed by institutional characteristics
Characteristic % Base N
Where existing qualification was undertaken
FE college 65 3146
State school 26 1270
Private/independent school 7 363
Not answered 2 80
HEI type/Mission
Russell group 19 919
1994 group 12 595
Pre-199227 9 459
Post-1992 59 2874
HEI HEBSS status
Full 78 3787
Information only 18 869
None 4 191
Studying strategically important or vulnerable subject (SIV)?
Associations amongst the characteristics of the students surveyed
In the remainder of the report we will examine differences between students by their socio-economic characteristics. These characteristics are often highly correlated with each other. And this needs to be taken into consideration when assessing differences between student groups. For instance, when discussing older students it is important to note that these are more likely than younger students to be Black and to come from the poorest households. In contrast, younger students are more likely to be White or Asian and come from higher income households.
Table A1.1 in the statistical appendix, shows statistically significant associations amongst the key socio-economic characteristics of the students surveyed.
By gender:
Females were more likely to have parents with no HE qualifications.
By age:
Younger students were more likely to be of White or Asian ethnicity, from middle or high-income households, and to have parents with HE qualifications
Older students were more likely to be of Black ethnicity and from low-income households.
By ethnicity:
White students were more likely to be from high-income households and to have parents with HE qualifications.
Mixed ethnicity students were more likely to be from low-income households and to have parents with HE qualifications.
Asian students were more likely to be younger, from low or middle income households and to have parents with no HE qualifications.
Black students were more likely to be older and from low-income families.
By household income
Students from low-income households were more likely to be older, of Mixed, Asian or Black ethnicity and to have parents with no HE qualifications.
Students from middle income households were more likely to be younger, of Asian ethnicity and to have parents with no HE qualifications.
Students from high-income households were more likely to be younger, of White ethnicity and to have parents with HE qualifications.
In addition, statistically significant associations were identified between the type of HEI attended and the following key socio-economic characteristics (Table A1.2 in Statistical Appendix):
Gender – female students were more likely to have attended a post-1992 HEI, while male students were more likely to have attended a Russell group university.
Age – younger students were more likely to have attended a Russell group or 1994 university, while older students were more likely to have attended a pre-1992 or post-1992 HEI.
Ethnicity – White students were more likely to have attended a Russell group university, Mixed ethnicity students a Russell group, 1994 or pre-1992 HEI and Black students a pre-1992 or post-1992 HEI.
Household income – students from low-income households were more likely to have attended a pre-1992 or post-1992 HEI, from middle income households a Russell HEI, and from high-income households a Russell or 1994 HEI.
2 THE COSTS OF GOING TO UNIVERSITY
2.1 Introduction
This chapter is concerned with the overall costs of going to university. According to the 2007/08 Student Income and Expenditure Survey,28 the average total expenditure over an academic year for full-time English domiciled undergraduate students who were subject to the new funding arrangements was £12,855. This gives us some idea about what the annual costs of attending university were for the students surveyed for OFFA.
The chapter firstly explores students‟ awareness and concerns about university costs by identifying the extent to which students thought about the costs, and how well-informed and how worried they felt about these costs. Next, the chapter questions how, and to what extent, these costs influenced students‟ university decisions. Finally, the chapter examines how students intended to pay for their time at university by examining the uptake of key sources of student funding.
2.2 Awareness and concern about the costs of going to university
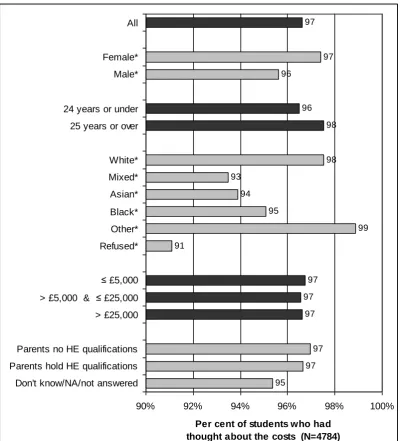
Nearly all of the students interviewed (97%) had thought about the costs of university and how they would pay for their time at university.
Some differences in the likelihood of students thinking about these issues were evident by key socio-economic characteristics (Figure 2.1).
White students (98%) and older students (98%) were overall the most likely to have thought about university costs and payment, while students of mixed (93%) ethnicity were the least likely.
Statistically significant intra-group differences in students‟ likelihood to have thought about the costs of going to university and how they would pay for their time at university were identified, in order of magnitude, by:
Ethnicity - a higher percentage of White (98%) students had thought about university costs and payment than Black (95%), Asian (94%) or mixed ethnicity (93%) students.
Gender - females (97%) were more likely to have thought about university costs and payment than males (96%).
Figure 2.1 Percentage of students who had thought about the costs of going to university and how they would pay for university, by key socio-economic characteristics
97
96 98
97 97
97
97 97 95
98 93
94 95
99 91
97 96
90% 92% 94% 96% 98% 100%
All
Female*
Male*
24 years or under
25 years or over
White*
Mixed*
Asian*
Black*
Other*
Refused*
≤ £5,000
> £5,000 & ≤ £25,000
> £25,000
Parents no HE qualifications
Parents hold HE qualifications
Don't know/NA/not answered
Per cent of students who had thought about the costs (N=4784)
Base: All students
When students started to think seriously about the costs of going to university and how they would pay for university
[image:38.595.92.502.224.439.2]Of those students who had thought about the costs of going to university and how they would pay for their time at university, most had started to think seriously about these issues before applying to university (47%) or when completing their UCAS application form (15%). The remaining 38 per cent had started to think seriously at a stage after their UCAS submission, with just 5 per cent after having their place at university confirmed (Figure 2.2).
Figure 2.2: When students started to think about the costs of going to university and how they would pay for university
Per cent of students (N=4568)
47%
15% 9%
8% 16%
5%
Before applying to university When doing my UCAS application After submitting my UCAS application, but before I was offered a place at university After I was offered a place at university When applying for student financial support After my university confirmed my place
Base: All students who had thought about costs of going to university
Source: Birkbeck Survey of Students, 2008
Differences in when students started to think seriously about the costs of going to university and how they would pay for university were evident by key socio-economic characteristics (Table 2.1).
Statistically significant intra-group differences in when students started to think seriously about university costs and payment were identified, in order of magnitude, by:
Age - older students (78%) were substantially more likely to have considered university costs and payment before UCAS submission than younger students (60%).
Ethnicity - a lower percentage of Asian students (56%) had considered university costs and payment before UCAS submission than mixed ethnicity (65%), White (63%) or Black (62%) students.
Household income - students from low-income households (68%) were more likely to have considered university costs and payment before UCAS
Table 2.1 When students started to think about the costs of going to university and how they would pay for university, by key socio-economic characteristics
Before applying
to university
When doing my UCAS application
After submitting my UCAS application
After I was offered a place at university
When applying for student financial
support
After my university
confirmed my place Total
% % % % % % N
Gender
Female 48 16 8 8 16 5 2613
Male 46 14 9 8 15 6 1955
Age*
24 years or under 44 16 9 8 17 6 3981
25 years or over 69 8 7 5 7 3 587
Ethnicity*
White 48 15 9 8 15 5 3392
Mixed 50 15 11 7 12 5 147
Asian 35 21 10 6 20 7 474
Black 50 12 5 10 17 6 321
Other 43 17 11 7 17 5 85
Refused 54 12 8 6 13 6 150
Household income*
≤ £5,000 54 14 6 7 14 5 1380
> £5,000 & ≤ £25,000 46 15 9 8 16 6 1649
How well-informed students felt about the costs of going to university
The majority of students (88%) felt very or fairly well-informed about the costs of going to university, with 33 per cent feeling very well-informed. Only 12 per cent of students reported feeling poorly or very poorly informed about university costs.
Differences by key socio-economic characteristics in the percentage of students reporting that they were „poorly or very poorly informed‟ were small. However, there were some large differences by these characteristics in the percentage of „very informed‟ and „fairly well-informed‟ responses (Figure 2.3).
Black students (43%) were the most likely to have felt very well-informed and students from high-income households (28%) were the least likely to have felt very well-informed.
Statistically significant intra-group differences in how well-informed students felt about the costs of going to university were identified, in order of magnitude, by:
Ethnicity - Black students (43%) were the most likely to have felt very well-informed, followed by Asian (35%), White (32%) and then Mixed ethnicity students (29%).
Household income - a lower proportion of students from high-income
households (28%) felt very well-informed than those from middle (34%) or low (37%) income households.
Figure 2.3 How well-informed students felt about the costs of going to university, by key socio-economic characteristics 33 32 34 32 38 32 29 35 43 41 26 37 34 28 32 33 35 12 13 11 12 14 11 14 14 13 16 18 14 12 11 13 12 11 56 60 54 50 55 44 51 58 57 49 55 55 55 43 55 56 54
0% 20% 40% 60% 80% 100%
All
Female
Male
24 years or under*
25 years or over*
White* Mixed* Asian* Black* Other* Refused* ≤ £5,000* > £5,000 & ≤ £25,000*
> £25,000*
Parents no HE qualifications
Parents hold HE qualifications
Don't know/NA/not answered
Per cent of students (N=4826)
Very well informed Fairly well informed Poorly or very poorly informed
Base: All students
Notes: * indicates differences significant at 5 per cent level