ORIGINAL RESEARCH ARTICLE
SOLVE DATA ACQUISITION PROBLEMS AND INFORMATION SYSTEM AN EXAMPLE BASED
ON STUDY OF UNIVERSITY STUDENTS
*Khalil, M.S.
Information System Department, Faculty of Management & Economic and information system
Misr University for Science & Technology, Cairo, Egypt
ARTICLE INFO ABSTRACT
Computer-based data acquisition system has an effective role in business environment; Successful high speed data acquisition has efficiency at its core. This paper introduces a novel information acquisition problem generated by business applications in which data of customer has to be acquired. Our solution based on design information system This system is encoded in java programming allowing improving the manual data acquisition by implementing of checking algorithms and cooperation with Service seekers. The validation of the proposed system is performed by SPSS to deal with these outputs and applying statistical analysis, they are as well much more reliable and stable in difficult business environment, and Other useful attributes for this system is Time compression and expansion are other pluses.This indicates the new system decreases the waiting time for services.
Copyright © 2018,Khalil. This is an open access article distributed under the Creative Commons Attribution License, which permits unrestricted use, distribution, and reproduction in any medium, provided the original work is properly cited.
INTRODUCTION
Last decade there was a significant change in processing data, improving of efficiency operations to maximize output and in the same time minimizing required resources. This change is as well affecting the data collection. For the quick and efficient decision making process is mandatory to have qualitatively accurate, reliable and real time available information. Technology of data acquisition is ever changing and advancing. Nowadays, Computer systems are available in almost the majority of organizations. This has made change in data acquisition in a deep method; most data is available in an instantaneous digital format. This can be a strong tool to quickly identify and mitigate problems of data. These digital systems should increase data capture and reporting. It is possible to extract data either manually or automatically and this process has to take place in the area of occurrence of information source, however there are still plenty of the source locations where only manual entry of data by operator is possible.
*Corresponding author: Khalil, M.S.,
Information System Department, Faculty of Management & Economic and information system Misr University for Science & Technology, Cairo, Egypt.
Quality of data (Lubomir lengyel, 2013) coming from manual entry of information is a key element in efficiency of decision making (Moore and Whinston, 1987) process for all support functions and as well management allowing them to quickly react on changing circumstances of working environment. In this research the timely reporting of high quality will be discussed, highly time-resolved ambient monitoring data will require a coordinated effort to ensure data management systems are meeting desired performance needs. These systems of data management will require to give validated data, to the possible extent, in near real time to multiple students within minutes from the end of a sample period. Data management systems used in order to accomplish this research, information must be managed and collected in a way that ensures and protects its integrity. Most of the data has been collected from the "on time" system applications. These systems must be effectively managed through a set of issue like emails and phone calls are critical to maintaining good quality. The "on time" system. Time! That’s our problem defines, we define our Objective:
Saving everyone’s time.
Satisfying Customer needs.
ISSN: 2230-9926
International Journal of Development Research
Vol. 08, Issue, 05, pp.20366-20371, May,2018
Article History:
Received 27th February, 2018 Received in revised form 14th March, 2018 Accepted 24th April, 2018 Published online 28th May, 2018
Key Words: Data acquisition, On time, Information system
Citation: Khalil, M.S., 2018. “Solve data acquisition problems and information system an example based on study of university students”, International
Journal of Development Research, 8, (05), 20366-20371.
Reducing Congestion.
Help employees to develop themselves faster than before.
The section will discuss
Data acquisition- The raw data collection from the sampler/monitor, storing it for an appropriate interval, reducing or aggregating the data, and moving this data to final storage in a local data base (monitoring organizations database)
Data transfer- preparing and transferring data to external data bases.
Data management- ensuring the integrity of the data collection systems.
This paper deals with some of the basic problems that have made it difficult to acquire data and manage information for planning, dealing with manual entry issues and analysis of such acquired data through specialized software’s and modules running as a part of the "on time" systems .This solution is the highly efficient, reliable, and stable. Overall all of pervious systems are lacking one of the most important features and are not taking into account one of the major principles of getting data quick method. Operator performing a data entry is required to select the proper data group by selecting from written possibilities.
Hypotheses: The hypotheses and identify the claim: For the system to be effective the waiting time after applying the system must be significantly less than the waiting time before applying the system
Data Acquisition Techniques and methodology: Major issues arising from manual entry of data can be summarized (Robbins, 2013)to delayed Service delivery reporting, slowed decision making process, inaccurate reporting due to manual errors (Wahi et al., 2008) and Non-organization of service delivery and scheduling of each customer. Solution for previously mentioned problems is the automated data acquisition process using specialized system for manual data entry placed in the area of data occurrence enabling fast data
input, organized of service delivery and time scheduling of each customer, Other solutions are based on the special applications running on the workstations available directly in production able to directly communicate with the superior systems like ERP’s, but our solution based on design information system allowing to improve the manual data acquisition by implementing of checking algorithms and cooperation with Service seekers. Dealing with these outputs and applying statistical analysis, they are as well much more stable and reliable in difficult business environment.
Steps for Successful High Speed Data Acquisition Sequence Diagram : Figure 1: illustrate the Steps for Successful High Speed Data Acquisition through Sequence Diagram Including: Data bases, web browsers, servers, email, of all the jobs that make our personal computers do, real time data acquisition. Spotting high speed data acquisition trouble is the topic of this research in it, we'll explore system characteristics that not only allow high speed measurements, but will do so on slower PCs. In so doing, we'll discuss advanced sampling techniques such as sampling a time and selectable sample rates per student. We'll explore how the student should react when there is a problem by exploring gap detector routines and their importance to high speed data acquisition.
Functional and Non-Functional Requirement
Functional Requirement
Create: This is the first functional requirement of the system that help use to create a new account that added for the system
Add: Add a record for booking a new place that would help him to achieve his books through simplified way
Update: That would help user to update his booking time or choosing another one
Select: That would help users to select what he needs and what he wants from the system
Review: that reviewing the personal details about the people who are working in that system or who worked
Check Status: Check If this user has been registered or not
Evaluate Performance: It would helping manager to evaluate employee performance through an easy way without physical evidence
Non-Functional: Accessibility: refers to the, devices, services, or environments for people who experience disabilities.
• Open Source: Open source promotes universal access via an open-source or free license to a product's design or blueprint, and universal redistribution of that design or blueprint.
• Security is the degree of resistance to, or protection from, harm. It applies to any vulnerable and/or valuable asset.
• Usability: the ease of use and learn ability of a human-made object such as a tool or device.
• Scalability is the capability of a system, network, or process to handle a growing amount of work, or its potential to be enlarged to accommodate that growth. • Response Time: the total amount of time it takes to
respond to a request for service. That service can be anything from a memory fetch, to a disk IO, to a complex database query, or loading a full web page. • Availability: The degree to which a system, subsystem
or equipment is in a specified operable and committable state at the start of a mission.
We arranged some Points to acquire quality data: Looking at the multiple benefits on offer by data acquisition, it becomes important to ensure that the data acquired is of high quality. Quality is measured through three different benchmarks
• Contextual data quality – Data to be acquired needs to be relevant (Rieder and Lauritsen, 2011], timely, of correct volume and must adhere to timeliness and completeness • Intrinsic data quality – Data needs to display intrinsic characteristics such as accuracy, believability, reputation, and objectivity
• Accessibility data quality – Data must have secure and validated access for security.
Problem Definition Analysis
Problem 1 – Data isn’t timeliness
The Cause:
•Data extraction process that is not fast enough to meet the needs of the mission
•Data given is not keeping up with the evolution of the needs
Resolution:
•Adding more investment in web data acquisition (5)(human capital)
•Advance the systems of generating data with new system Problem 2 – Cleansing the data
The Cause:
• Data generated without taking into account the needs or business objectives
• Increasing amounts of data, algorisms, employees, or products information
• The big data becomes less efficient or effective over time
Resolution:
• Detecting and correcting process or even deleting corrupt or inaccurate records
• Maintaining and distributing valuable data within an organization
• Develop a solid and scalable system to modify and rectify incorrect data
Case Study: Data Acquisition and Analysis Management System on University Students
supervisor, data analysis's is interested into the data showing possible defects coming out of process or tooling etc. Thus every department has its own data analysts (special function or joint function within a department), performing such analysis, usually occupying up to (20%) of the working time of employee. This issue costs university a lot of money in salaries, which could be invested to better usage of specialist’s abilities on improvements within a processes or working. Cross communication between different working subgroups working than as an internal administrative/data entry (Pegasie Technologies, 2013) (e.g. one administrative is supplying student’s data to another one which is covering them) is than not possible as the data are not available in real time. As well exchange of information and reaction possibilities between different departments is questionable. With lack of information that delivered late, some problems arouse from that point where books department can ran out of particular books, where it cant find a proper method or technique to cover this problem till the next day when the day ends, most likely after hours, so some actions needed to take place where the university developed the new system. This system also provides a new service with new methodology and technique for control the booking process for books reservation. Back then when the system was manually operated it took a students an average of (1 to 3 hours) a day to just receive their books, sometimes also the student get back home without getting the needed books cause of the end of the working day, wait times for booking services arise because of:
Capacity does not match demand.
Capacity or demand is not well managed.
There is significant variability over time in the demand for booking services.
The new system mainly based on controlling the booking process, it follows approaches to achieve satisfaction the student demands, where it implement new techniques of distribution and diffusion of peak crowded hours, Simultaneously system’s new methodologies scheduling for every student a period of time in particular day of choice, Thus it was a major problem time wasting process, which needed to implementation of a new solution tools.
Programming Model
We briefly discuss here some general programming models in our system "on time", It gives the familiar interface of communicate and interact, offering facilities for the specification, interaction, and dynamic composition of distributed (concurrent) components and Reduce runtime system automatically partitions input data and schedules the execution of programs in a large cluster of data acquisition.
HttpSession session = httpServletRequest.getSession(false);
httpServletRequest.setCharacterEncoding("UTF-8"); if (!requestURI.contains(loginPage)) {
if (session == null) { redirect = true;
} else if (session.getAttribute("student") == null) { redirect = true;
httpServletRequest.getSession().invalidate(); } else if (requestURI.contains("logout.xhtml")) { redirect = true;
httpServletRequest.getSession().invalidate();
} }
if (redirect) {
if (isAJAXRequest(httpServletRequest)) {
httpServletResponse.setContentType("text/xml"); httpServletResponse.getWriter()
.append("<?xml version=\"1.0\" encoding=\"UTF-8\"?>")
.printf("<partial-response><redirect url=\"%s\"></redirect></partial-response>", contextPath + timeoutLandingPage);
} else {
httpServletResponse.sendRedirect(contextPath + timeoutLandingPage);
} } }
if (!redirect) {
chain.doFilter(request, response); }
long lEndTime = System.currentTimeMillis(); long difference = lEndTime - lStartTime;
System.out.println("Request End @ " + new Date()); System.out.println("Elapsed milliseconds: " + difference); }
Statistical Analysis
The statistical method chosen to examine the data of this study is testing the difference between two means for dependent samples using T test. Where the samples are dependent, where the subject is paired or matched in some way (before applying the system and after applying the system). We want to see whether the new system will affect the waiting time of the students. To test this hypothesis, then we pre tested the current system in the sample first. That given a test to ascertain their waiting times. Then after applying the new system, the students are tested again, using a posttest. Finally, the means of the two tests are compared to see whether there is a difference. The researcher employs a T test, using the differences between the pretest values and the posttest values. Thus only the increase or decrease in values is compared, also we wants to see whether a new system program will help students decrease the waiting time. Therefore, the waiting time of the students will be compared before and after applying the system.
Testing of Hypotheses
The hypotheses and identify the claim: For the system to be effective the waiting time after applying the system must be significantly less than the waiting time before applying the system; hence, the mean of the differences must be greater than zero:H0: μD = 0
H1: μD > 0
Where: μD: is the symbol for the expected mean of the difference of the matched pairs.
D = before – after
T-Test
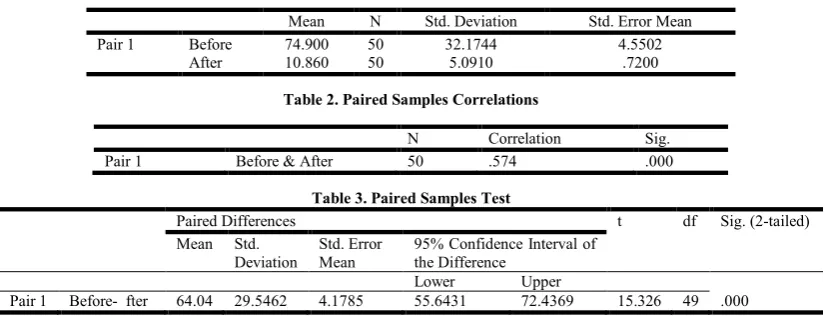
for “before” and “after” there is a big difference between them. This might indicate the new system decreases the waiting time. In the second table, the sample size (number of pairs) appears along with the correlation between before and after waiting time. We note that the correlation (.574) is positive moderate, and statistically significant (less than 0.01). This suggests that the power to detect a difference between the two means is substantial. Third table identify the mean waiting time difference, (64.04) minutes, is reported along with the sample standard deviation and standard error (based on the waiting time difference computed for each student). The significance value (.00) indicates that new system decreases the waiting time of students, so there is almost a (95%) chance of obtaining as large (or larger) a difference as we obtained in our sample. Using the standard cut-off probability of (.05), we reject the null hypothesis and conclude that new system decreases the waiting time of students.
The Decision: The decision is to reject the null hypothesis as shown in the previous tables, hence, confirm the validity of the claim that the new system decreases the waiting time of students.
Change to Applying in our system
The system can be divided into three subsystems: The first system design information system to provide the service time provided to the student with live connection to data servers, The second system: Acquiring the system outputs and integrating them as inputs to the case study by investigating the time that was provided after the application of the information system, and third system: through the output second system allowing data analysis by using SPSS program, reporting, and export of data to the systems. Important in this point is the accessibility of all the data in real time for all users to allow quick and efficient overview of the situation and define actions in case of deviations, automation of creation of those reports can lead to system of notifications over email, phone, and intranet etc. decreasing needed reaction time, to allow anticipation of the future situation and take necessary actions in real time reducing a risk of deviations in future.
RESULTS AND DISCUSSIONS of SPSS
All of above mentioned requirements were deeply analyzed allowing to create a timeline for implementation of the system which has been called "on time". Within this timeline a series of milestones has been defined allowing to We see that the means for “before” is (74.900) and “after” is (10.860) there is
a big difference between them. Means that the System allowed immediate saving of (64.04) minutes per student approximately 53 working hours for sample size. The most important outcome of the system implementation was decreased the proceedings of time are now widely used during problem solving processes allowing to cut the ratio of time by 64% within half a year. Major advantages of such system are:
• Decreasing reaction time to minimum.
• Decreasing “data noise” coming from the manual entry of data.
• Improving of customer perception of the university. • Detailed and efficient base for problem solving process,
Major challenges.
• Adoption of such system by all involved parties understanding its advantages.
• Efficient IT support related to functionalities of whole system.
Conclusion
In this paper, we presented a new idea of solving problem of data acquisition, one motivated by practical decision contexts faced by management. Toward this end, we presented a general method and a specific information system for selective data acquisition. The generic method is based on reduce the time of services. The experimental results show that the methods perform well and indicate that selective data acquisition can be effective. This study compares the statistical method chosen to examine the data of this study is testing the difference between two means for dependent samples using T test. Where the samples are dependent, where the subject is paired or matched in some way (before applying the system and after applying the system). We see that the means for “before” is (74.900) with Std. Deviation (32.1744) and “after” is (10.860) with Std. Deviation (5.0910). there is a big difference between them. Means that the System allowed immediate saving of (64.04) minutes per student approximately (53) working hours for sample size. We note that the correlation (.574) is positive moderate, and statistically significant (less than 0.01). This suggests that the power to detect a difference between the two means is substantial
REFERENCES
Ac Kenzie, M .I. S. and Soukoreff, R. W. 2013. Text entry for mobile computing: Models and methods, theory and
Table 1. Paired Samples Statistics
Mean N Std. Deviation Std. Error Mean
Pair 1 Before 74.900 50 32.1744 4.5502
[image:5.595.92.505.270.428.2]After 10.860 50 5.0910 .7200
Table 2. Paired Samples Correlations
N Correlation Sig.
Pair 1 Before & After 50 .574 .000
Table 3. Paired Samples Test
Paired Differences t df Sig. (2-tailed)
Mean Std. Deviation
Std. Error Mean
95% Confidence Interval of the Difference
Lower Upper
practice. Human-Computer Interaction, 17, pp. 147-198. (Online)Available at: (Accessed 12 12 2013].
Cadcam Integration, 2013. SuiteMDI. A Manual Data Inputing Application with Support for Suite Monitoring. (Online)Available at: (Accessed. 15 November 2013]. Handbook, QA. Vol II, Section 14 Revision: 1 Date: 12/08
Page 1 of 3.
Lubomir lengyel, 2013. production data acquisition and analysis management system: an example based on a study of automotive supplier solution, quality innovation prosperity/kvalita inovácia PROSPERITA XVII/2 –ISSN 1335-1745 (print) / ISSN 1338-984X (online) 103, DOI: 10.12776/QIP.V17I2.260.
Moore, J. and Whinston, A. 1987) A model of decision-making with sequential information-acquisition (Part 2),
Decision Support Systems, 3(1), 47-73 Moore, J. C., H. R.
Rao, A.
Pegasie Technologies, 2013. Intelligent data entry automation. Available at: (Accessed 15 October 2013].
Rieder, HL. and Lauritsen, JM. 2011. Quality assurance of data: ensuring that numbers reflect operational definitions and contain real measurements. Int J Tuberc Lung Dis, Mar; 15(3) pp 296-304.
Robbins, K. 2013. Problems with the Manual Entry of Data. Available at: (Accessed 10 October 2013].
Wahi, M.M., Parks,D.V., Skeate, R.C. and Goldin, S.B. 2008. Reducing errors from the electronic transcription of data collected on paper forms: a research data case study. J Am
Med Inform Assoc., May-Jun; 15(3), pp. 386–389. doi:
10.1197/jamia.M2381.
Whinston, K., Nam,T. S. and Raghu, 1997. Information acquisition policies for resources allocation among multiple agents. Information Systems Research, 8 (2), 151-181.
Zheng, A.G. and Balaji Padmanabhan, 2006. Selectively Acquiring Customer Information: A New Data Acquisition Problem and an Active Learning Based Solution" Published Online: May 1, 2006.