Full Length Research Article
THE EFFECTS OF INDIGENIZED TEACHING AND MICROSOFT EXCEL WORKSHEET MATERIAL ON
STUDENTS ACHIEVEMENT LEVELS IN STATISTICS AND THEIR RESULTING ATTITUDES
*Rodelio M. Garin
Pangasinan State University, Bayambang, Pangasinan, Philippines
ARTICLE INFO ABSTRACT
On this modern era, teachers must consider instructional materials that would be used in teaching. One possible factor that hinders performance improvement is the type of material utilized by the learners. This study aims to observe the effects of the Indigenized teaching and Microsoft–Excel Worksheet as teaching material in Statistics on the performance of the students’. The study carried out using pretest-post-test control group; single blind experimental research design. One College of Teacher Education class divided into two groups was used in this study. There are twelve students’ exposed to teaching Statistics using Indigenized teaching and Microsoft–Excel Worksheet as teaching material and seventeen students’ exposed to notindigenize teaching and calculator as teaching material. The respondents’ group assignment was done by purposive and simple random sampling. The attitude score of the respondents were measured using average weighted mean and described using fuzzy clustering. Analysis of Covariance (ANCOVA) was utilized to compare the pretest and post-test performance of the two groups. Regarding the results, the students’ attitude score towards Statistics is increase after their exposure to the different strategies and the attitude score of experimental group is higher than the control group. It was also found out that the performance of the experimental group is significantly different to the performance of the control group. The study recommends that, Indigenized teaching with the support of Microsoft – Excel worksheet material is an effective teaching strategy to enhance students’ performance in Statistics.
Copyright©2016, Rodelio M. Garin. This is an open access article distributed under the Creative Commons Attribution License, which permits unrestricted use, distribution, and reproduction in any medium, provided the original work is properly cited.
INTRODUCTION
It is difficult to avoid large values and large cardinality of the data if a teacher employs Indigenized data in teaching statistics. Resolving problems in statistics containing large values and large cardinality of the data require a long solution and used up more time along the limited length of the discussion. These are some of the reasons why teachers avoid giving real world data as an example, assignments or activities. However, teaching real world data relevant to the learners is a hopeful direction for accelerating the progress of academically underprepared students (Perin, 2011). In this study, a researcher devises a remedy of such problems by integrating Microsoft– Excel Material to solve statistics problems which involve indigenized data faster and accurately. Every student is different because all of them have different backgrounds. According to Freire (as cited by Lee et al., 2012) teachers need to see the different backgrounds of the students because this difference may bring the diversity to the classroom.
*Corresponding author: Rodelio M. Garin
Pangasinan State University, Bayambang, Pangasinan, Philippines
To address this problem to the students the teacher need to be conscious of their cultural background so as to benefit everyone in the classroom. According to Ozele (as cited by Hee Kap Lee and Ivy Yee-Sakamoto, 2012), cultural contextualize education motivates students to know more about their cultural heritage in order to appreciate and understand other cultural heritage. According to Mouraz, A. and Leite, C. (2013) contextualization is a prerequisite in addressing the content and organization of activities to be undertaken in the classroom. Students' engagement in their schoolwork increases significantly when they are taught, why they are learning the concepts and how those concepts can be used in real-world contexts (Center for Occupational Research and Development [CORD], 2012). This study grasp the attention of the researcher because of the following reasons: (1) Indigenizing and contextualizing the lesson is a promising strategy for teaching (Dolores Perin, 2011). (2) Promote appreciation in the region products, tourist spots, cultural presentation, festivals, and similar activities. (3) Statistics are part of the everyday language of sociology and other social sciences (including political science, social work, public
ISSN: 2230-9926
International Journal of Development Research
Vol. 06, Issue, 10, pp.9703-9708, October, 2016
DEVELOPMENT RESEARCH
Article History:
Received 22ndJuly, 2016
Received in revised form 19thAugust, 2016
Accepted 17thSeptember, 2016
Published online 31stOctober, 2016
Key Words:
administration, urban studies, and gerontology) (Healey, 2014). (4) Indigenized teaching and learning is considered beneficial for student success (Rolka, Christine and Remshagen, Anja 2015). This contextualization of the problem is shown to hinder the student achievement when students are not sufficiently familiar with the contexts (Walkington & Sherman, 2012). Integrating computer assisted instruction in teaching and learning is highly appreciated in the field of education. There are anecdotal evidences on the positive effect of utilizing computer assisted instruction on the
academic achievement of the learners. (Karakış, Karamete,
Okçu, 2016; Öztürk, 2011) their study shows that computer assisted instruction increases the academic achievement level and improve the attitude of the students. Dogan M., Icel R., (2011), found out that a group of students taught by dynamic mathematics software as teaching material significantly
increased students’ success. Üstün and Ubuz (2005) performed
an experimental study to compare traditional educational environments with the dynamic learning environments (Geometer's Sketchpad used). According to the results of the study, there was a significant difference in favor of the experimental group on the recall (permanence) test. The most important reason for this significant difference is identified as
students’ explorations of geometrical shapes to see possible
connections by manipulating the computer based environment.
Framework of the Study
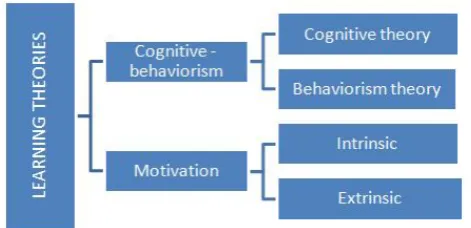
The following discussion presents the theories, concepts, insights, generalizations, and ideas which aided and inspired the researcher to conduct this study. This paper anchor on the effect of Indigenized teaching and Microsoft Excel Worksheet teaching material on the students’ performance and attitudes to
[image:2.595.45.281.479.593.2]Basic Statistics Subject. The diagram below shows the theories displayed in the form of a diagram (see Figure 1 below) were covered in established the theoretical framework of the study.
Figure 1. Learning Theories and concepts
Learning: According to Shuell (2013) learning is the most
important of the activities of humans. Learning may happen in school or outside the school. It is at the very core of the educational process, although most of what people learn occurs outside of school.
Cognitive-behaviorism theory: In this study, the following
learning theories served as a guide for the researcher. One of these theories is the Cognitive-behaviorism theory. Innovative Learning-Behaviorism, (2013) as cited in Walker, S. & Moore,
S. (2013) behaviorism theories define learning as “semi
-permanent change in behavior”. In other words, if the behavior
of the learners substantially changes positively, then learning has evidently happened. Innovative Learning-Cognitivism
(2013) states that learning is an “internal processes”. This
entails that learning will be acquired more if the learners have higher interest to learn. A cognitive-behaviorism is an interaction between the mind and behavior. The learner will behave accordingly if the learner thinks that he/she, his/her family, and other human being will be benefited by what he/she is doing. Every human being is different in terms of objectives, ambitions, principles and they like. All of these things are based on what is on our thought, feelings and behavior. According to Fritscher, (2014) if our thoughts, feeling and behavior are satisfied this may change our reaction. According to Badura, A., Beck, A., Ellis, H., Lazaras, A., Meichenbaum, D., Pavlov, I., Wolpe, J. (2010) cognitive and behavioral approach is an important approaches in understanding and determining the human being needs. In this study, the researcher utilized Indigenized examples and exercises which means that it is related to the learner's environment and Microsoft – Excel Worksheet as a teaching Material. The researcher believes that utilizing effective material and documented information that related to the learners will develop positive reaction, and then they will easily understand the lesson.
Motivation theory: Learning theories are diversified in scope,
but relates closely to Indigenized teaching and learning. Another type of learning theory which gives highlight on contextualize teaching and learning is motivation theory. According to Barbuto, (2006) the most important component
of any instructional design is Motivation. Teaching students’
with Microsoft – Excel Worksheet material in a learning
environment is designed to motivate students’. According to Biehler and Snowman (as cited in Annick M. Brennen, 2016), to enhance the students' interest the school should find a way to motivate the students. To motivate the students the teacher should give an interesting problem and materials as the basis of instruction (Hannum, 2015). According to Kelemen, G. (2014) the reasons that make the child to come to school, to hear the teachers and to learn is divided into two main groups.
Extrinsic motivation
When the student falls into school discipline without a direct interest in what is taught, but to receive, directly or indirectly, certain rewards, especially moral ones.
Intrinsic motivation
Where the learning and acquiring knowledge, interest directly
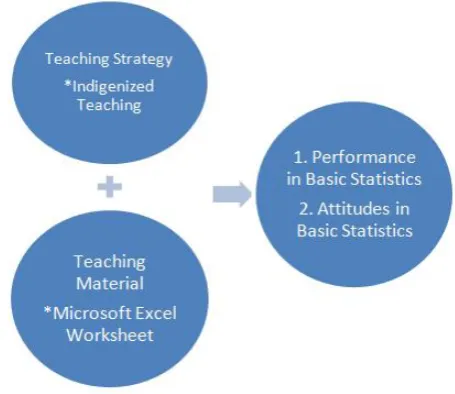
Figure 2. Research Paradigm
This study aims to examine the effect of Integrating Microsoft
– Excel Worksheet material and Indigenized teaching, on the
students’ attitudes and on their success in Statistics. To do this,
the researcher defined the problems and sub problems of the research:
What are the effects of Indigenized teaching and Microsoft – Excel Worksheet as material on the
students’ attitude and on the students’ performance in
Basic Statistics?
What are the pre and post-test scores in regards to attitudes toward learning Basic Statistics of the experimental and control group?
What are the pre and post-test performance in Basic Statistics of the experimental and control group?
Is there any statistical difference between the pre and post-test scores in regards to students’ attitudes toward
learning basic statistics, after teaching presentation and summarizing data and data description across groups?
Is there any statistical difference between the pre and post-test performanceof the students’, after teaching
presentation and summarizing data and data description across groups?
MATERIALS AND METHOD
The Research Design
This study used the single – blind experimental method of research, particularly the pre and post-test control group design and focused on finding out the effect Indigenized teaching with the support of Microsoft– Excel Worksheet material on the performance of the students in Statistics. According Shuttleworth, (2013) the investigation may result to experimental flaws (bias) if both or each group knows that they are belonging to the investigation. The idea is that both experimental and control groups are not aware that they are the respondents of the study.
Respondents of the study
The subjects of the study were the students enrolled in Basic Statistics during the School Year 2015-1016. This study used one class of Bachelor of Secondary Education students
enrolled in the Pangasinan State University, Bayambang, Pangasinan. The class was divided into two groups to measure the effect of the Indigenized teaching and Microsoft Excel
worksheet material on the students’ performance: one group
exposed to Indigenized teaching with the support of Microsoft Excel Worksheet materials, in learning statistics (experimental group) while the other group were exposed to the traditional approach of teaching (control group). This was done using simple random sampling. Six students with laptop were assigned to the experimental group, while the other six students assign to experimental group was selected using random sampling.
Instrumentation and Data Collection
The topics and objectives were the same in both groups except for the teaching approach. The topics used covers two chapters of basic statistics (Presentation and Summarizing data and data description). Each group will take an examination using the test questionnaire constructed by the researcher. The test questionnaire is composed of twenty five problems in each chapter. The test questionnaire instrument was trial–tested to 15 randomly selected BSE second year math major, students who are not the subjects to calculate its reliability. Kuder Richardson Formula 20 revealed a reliability coefficient of 0.76 which denotes that the test has high internal consistency. The result of the examinations of each group was analyzed to draw conclusion about the effect of the contextualized and localized teaching on the performance of the students. The attitudes of the students were measured using 4 point likert–
scale questionnaire. The questionnaire was constructed by the researcher and addressed to content validity and reliability. The questionnaire instrument was trial–tested to 15 randomly selected BSE second year math major also. Cronbach alpha revealed a reliability coefficient of 0.83. The content validity of the questionnaire garnered average, weighted mean of 4.61 with a descriptive value of Highly valid.
Analysis of Data
To obtain the validity and reliability of the results of the study, appropriate statistical tools were used. The following statistical tools were used in the study. To determine the level of
performance of the students’ mean percentage score will be
used. The mean percentage score is the quotient of the raw score and the total number of points times 100%. The attitude score of the respondents was measured using average, weighted mean (AWM). The mean responses of the respondents will be grouped using fuzzy clustering. Fuzzy clustering because, the weak points of each cluster were numerically set by the researcher. Each mean has a degree of belonging to clusters, rather than belonging completely too just one cluster. Thus, the points nearer on the edge between the two clusters may be in a cluster to a lesser degree. The mean responses of the respondents as narrated below.
Below was the algorithm used to determine the cluster I (1, 2, 3, 4) of belonging for mean x.
Step1: Fix the cluster, which is defined as Cluster1=Disagree,
Agree, whose range beginning with 3.25 ( 3) and end with 4.00 ( 3).
Step 2: Choose an element x
Step 3: If < 1, then x lies in cluster 1 only
Step 4: If 2 < ≤ 1, compute 1 −
. . The result is
the degree of belonging of in cluster 1. The degree of belonging of in cluster 2 will be determined using 1 −
. .
Step 5: If 1 < ≤ 2, then belongs to cluster 2 only
Step 6: If 3 ≤ < 4, then belongs to cluster 3 only
Step 7: If 4 ≤ ≤ 3, compute 1 −
. . The result is
the degree of belonging of in cluster 3. The degree of belonging of in cluster 4 will be determined using1 −
. .
Step 8: If 3 < ≤ 4, then belongs to cluster 4 only.
To answer problem 3 and 4, Analysis of covariance (ANCOVA) was used. The pretest score and pretest performance were used as covariate of post-test score with regards to attitude and post-test performance respectively.
RESULTS AND DISCUSSION
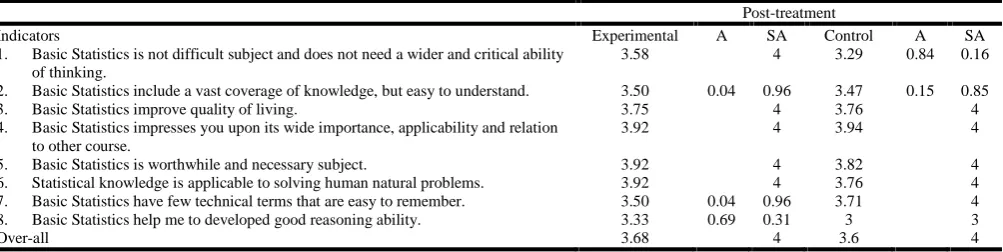
Degree of membership of the indicators concerning the attitudes of the experimental group is found using the constructed fuzzy clustering is shown in table 1a. Indicators 1, 2, 7 and 8 with a mean rating 2.92, 2.92, 3.17, and 2.92 respectively, are entirely with a membership value of 3 in cluster 3 is Agree. Attributes,4, 5, 6 with a mean rating 3.58, 3.58, 3.67 are entirely with a membership value of 4 is strongly Agree. Indicator 3 with a mean rating of 3.33 belong to 68% in cluster 3 and 32% in cluster 4. The degree of membership of the indicators 1, 2, 3, 5, 6, 7, 8 concerning the attitudes of the control group is entirely with a membership of 3 is Agree. Indicator 4 with a mean rating of 3.35 belong to 62% in cluster 3 and 38% in cluster 4. Generally, the membership of the experimental and control group with a mean rating of 3.07 and 3.05 respectively, both entirely with membership value of 3 is Agree. The degree of membership of the post attitude score of the experimental group is found using the constructed fuzzy clustering shown in table 1b. Indicators 1, 3, 4, 5 and 6 with a mean rating of 3.58, 3.75, 3.92, 3.92, and 3.92 respectively, are entirely with a membership value of 4 in cluster 4 is Strongly Agree.
Table I. Level of 4–Clusters
[image:4.595.58.533.416.459.2]Cluster 1 Cluster 2 Cluster 3 Cluster 4 Range 1.0–1.75 1.50–2.50 2.51–3.50 3.25–4.00 Classification Disagree Undecided Agree Very Much Agree
Table II. Weak Points of Each Cluster
Cluster 1 Cluster 2 Cluster 3 Cluster 4 Range 1.5 -1.74 (1.5-1.74) 3.25–3.5 3.25–3.5 Classification x% Disagree and (1-x) %
Undecided
x% Disagree and (1-x) % Undecided
x% Agree and (1-x) %Very Much Agree
[image:4.595.46.551.491.615.2]x% Agree and (1-x) % Very Much Agree
Table 1a. Membership of the Pre–Attitude Score of Respondents
Pre-treatment
Indicators Experimental A SA Control A SA
1. Basic Statistics is not difficult subject and does not need a wider and critical ability of thinking.
2.92 3 2.65 3
2. Basic Statistics includes a vast coverage of knowledge, but easy to understand. 2.92 3 2.65 3 3. Basic Statistics improves quality of living. 3.33 0.68 0.32 3.18 3 4. Basic Statistics impresses you upon its wide importance, applicability and relation to
other course.
3.58 4 3.35 0.62 0.38
5. Basic Statistics is worthwhile and necessary subject. 3.58 4 3.24 3 6. Statistical knowledge is applicable to solving human natural problems. 3.67 4 3.24 3 7. Basic Statistics has few technical terms that are easy to remember. 3.17 3 3.06 3 8. Basic Statistics helps me to developed good reasoning ability. 2.92 3 2.59 3
[image:4.595.48.550.647.773.2]Over-all 3.07 3 3.05 3
Table 1b. Membership of the Post–Attitude Score of Respondents
Post-treatment
Indicators Experimental A SA Control A SA
1. Basic Statistics is not difficult subject and does not need a wider and critical ability of thinking.
3.58 4 3.29 0.84 0.16
2. Basic Statistics include a vast coverage of knowledge, but easy to understand. 3.50 0.04 0.96 3.47 0.15 0.85 3. Basic Statistics improve quality of living. 3.75 4 3.76 4 4. Basic Statistics impresses you upon its wide importance, applicability and relation
to other course.
3.92 4 3.94 4
5. Basic Statistics is worthwhile and necessary subject. 3.92 4 3.82 4 6. Statistical knowledge is applicable to solving human natural problems. 3.92 4 3.76 4 7. Basic Statistics have few technical terms that are easy to remember. 3.50 0.04 0.96 3.71 4 8. Basic Statistics help me to developed good reasoning ability. 3.33 0.69 0.31 3 3
Indicators2, 7, and 8 with amean rating of 3.50, 3.50, 3.33 are 4%, 4%, and 69% belong to cluster 3 and 96%, 96%, and 31% belong to cluster 4 respectively. The degree of membership of the pre attitude score of the control group on the indicators 3, 4, 5, 6, and 7 are entirely with a membership of 4 is Strongly Agree. Indicator 8 with a mean rating of 3.33are entirely with a membership of 3 is Agree. Indicators 1 and 2 mean rating 3.29 and 3.47 are 84% and 15%belong to cluster 3 respectively, and 16% and 85% in cluster 4 respectively. Generally, the membership of the experimental and control group with a mean rating of 3.67 and 3.6 respectively, both entirely with a membership value of 4 is Strongly Agree.
Table 2a. Pretest Performance of the Respondents
Experimental Control Frequency Percent Frequency Percent Below 50 11 91.7 16 94.1
50-59 1 8.3 1 5.9
Total 12 100.0 17 100.0 Average 34.33 29.76
[image:5.595.312.554.196.256.2]Table 2a shows that most of the respondents mean percentage scores in statistics about both groups is below 50. There are eleven (11) out of twelve (12) students in the experimental group have a mean percentage score below 50. Whereas, sixteen (16) out of seventeen (17) students in the control group got a mean percentage score below 50. The mean percentage score of the experimental group (34.33) is slightly higher than the mean percentage score of the control group (29.76). Each group performed unsatisfactory on the Statistics test.
Table 2b. Post-test Performance of the Respondents
Experimental Control Frequency Percent Frequency Percent
Below 50 0 0 5 29.4
50-59 1 8.3 4 23.5
60-69 6 50.0 4 23.5
70-79 3 25.0 3 17.6
80-89 1 8.3 1 5.9
90 above 1 8.3 0 0
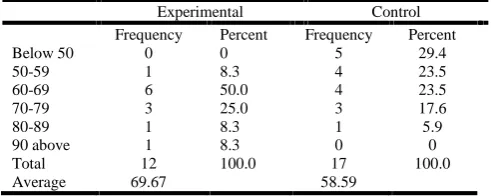
Total 12 100.0 17 100.0 Average 69.67 58.59
Table 2b shows that the prevalent mean percentage score of the experimental and control group is 60 – 69 and below 50 respectively. The distribution of the percentage score of the experimental group is approaching normally distributed while the control is apparently skewed to the right. In this view, we can conclude that the experimental group performs better than the control group on the post-test statistics test. This observation was reinforced by the computed mean percentage score of the experimental group (69.67) which is obviously higher than the control group (58.59) as shown on the table.
Table 3 shows that the pre-attitude of the experimental and the control group which were used as covariate garnered 0.000 obviously less than 0.05. This means that Analysis of Covariance can be used to test the differences between the post-test score attitude of each group. Table 3 revealed that the F–value of the post-test score of the each group is 1.869 with p - value of 0.183 is higher than 0.05. This implies that the
null hypothesis that the “post-test score attitude of each group
is not significantly different from each other” must be
accepted. This means that the attitude of each group after the exposure on the different teaching strategy is the same.
Table 3. Ancova Test of difference between the post attitude score of the experimental and control group
Source Type III Sum
of Squares
Df Mean
Square
F Sig.
Pre-attitude .514 1 .514 22.637 .000
Treatment .042 1 .042 1.869 .183
Error .590 26 .023
Total 371.118 29
Table 4. Ancova Test of difference between the post-test mean percentage score of the experimental and control group
Source Type III Sum
of Squares
Df Mean
Square
F Sig.
Pretest score 1042.393 1 1042.393 9.000 .006
Treatment 521.311 1 521.311 4.501 .044
Error 3011.332 26 115.820
Total 119948.000 29
Table 4 shows that the pretest score, which is used as covariate garnered 0.006 obviously less than 0.05.This implies that Analysis of Covariance can be used to test the differences between the post-test mean percentage score of each group. Based on the table, the computed F-value is 4.501 with p-value of 0.044 which is less than 0.05. This implies that the null
hypothesis “there is no significant difference between post-test
mean percentage score of each group” must be rejected. Table 2.b shows that the post-test performance of the experimental group is higher than the control group. In this view, we can conclude that the post-test mean percentage score of the experimental group is significantly different (higher) than the control group.
Conclusion
Based on the findings the following conclusions are drawn:
The post-test attitude score of each group is higher than the pretest score attitude. The cluster of the attitude score of each group after the treatment is changed from Agree to Strongly Agree. This implies that the treatment used in each group affects positively their behavior and perception after their exposure. Additionally, the post-test attitude scores of each group not significantly different from each other.
The post-test performance of each group is obviously higher than their pretest performance. This implies that there is a positive significant effect of the two teaching methods on the performance of the students. Moreover, the post-test performance of the experimental group is significantly higher than the post-test performance of the control group.
Recommendation
Based on the findings, this study recommends that Indigenized teaching with the support of Microsoft – Excel worksheet material is an effectiveteaching strategy to enhance students’
performance in Statistics. There should be a computer laboratory for Basic Statistics subjects. There are some obstacles and confounding variables that are observed in the implementation of this study. First, the ways of assigning
students’ group not all students in the experimental group were
[image:5.595.49.276.224.288.2] [image:5.595.39.285.437.535.2]they were discriminated, because they think that they had a poorer material to use. Second, the number of respondents in the experimental group is small. This is not a natural number
of students’ in each class. The teacher can easily address the
needs of smaller class than the larger class. Third, in the experimental group there are two students in one computer. The students could cooperatively work from the activities and exercises given. Cooperative learning might affect the findings of this study. To receive more profound research data, future researchers can consider these obstacles and confounding variables when they will do parallel investigations.
REFERENCES
Center for Occupational Research and Development, 2012. hat
is contextualize teaching. Retrieved February 5, 2016, from
http://www.cord.org/contextual-learning-definition/ Dolores Perin, 2011. Facilitating student learning through
contextualization. Community College Research Center.
Fritscher, L. 2014. Learning theory and phobiasfrom behaviorism to cognitive theory. Retrieved December 27,
2016, from Phobias.about.com/od/causeand development/ a/learningtheory.html.
Hannum, W. 2015.Motivation….. Retrieved January 23, 2016, from http://www.theoryfundamentals.com/motivation.htm. Joseph F. Healey, 2012. Statistics a tool for social research 9th
Ed. Wadsworth, Cengage Learning.
HeeKap Lee and Ivy Yee-Sakamoto, 2012. Contextualized
pedagogy: New educational approach in the postmodern era. The Journal of Multiculturalism in Education Volume
8.
Karakış H., Karamete A., Okçu A. 2016. The Effects of a
Computer-Assisted Teaching Material, Designed According to the ASSURE Instructional Design and the ARCS Model of Motivation, on Students’ Achievement Levels in a Mathematics Lesson and Their Resulting Attitudes. European Journal of Contemporary Education,
Vol. (15), Is. 1.
Kelemen, G., 2014. Didactica învăţământului primar şi preşcolar, Editura Universităţii .“Aurel Vlaicu”, Arad
Lee, et al., 2012. Contextualized pedagogy: New educational
approach in the postmodern era. The Journal of Multiculturalism in Education Volume 8.
Moldovan, Ignat, Bălaş-Timar, 2011. Fundamentele psihologiei II, Mecanisme stimulator energizante, reglatoare şi integratoare. Editura Universităţii “Aurel Vlaicu”, Arad.
Mouraz et al., 2013. Putting knowledge in Context: Curriculum contextualization in history classes. Teaching and Learning Journal Vol 6 issue 3.
Mustafa Doğan, Rukiye Içel, 2011. The role of dynamic
geometry software in the process oflearning: GeoGebra example about triangles. International Journal of Human Sciences, Volume: 8 Issue: 1 Year: 2011.
Öztürk, M. 2011. The effect of computer assisted instruction
method on academic achievement on instruction of topics of ratio ? proportion. Master‘s Thesis, Primary Education Department of Elementary Mathematics Education Department of the Ataturk University Institute of Educational Sciences, Erzurum.
Prat-Sala, M. and Redford, P. 2010. The interplay between
Motivation, self-efficacy, and approaches to studying. British Journal of Education Psychology, 80(2), 283-305.
Rolka, C. and Remshagen, A. 2015. Showing up is half the
battle: Assessing different contextualized learning tools to increase the performance in introductory computer science courses. International Journal for the Scholarship of Teaching and Learning, 9, 1-10.
Shuell, T. 2013. Evolving theories of learning therelationship
between theory and practice differenttypes of learning.
Retrieved January 24, 2016, from http://www. education.com/ reference/article/theories-of-learning/ Shuttleworth, M. 2013. Double blind experiment. Retrieved
February 23, 2016 from https://explorable.com/double-blind-experiment.
Üstün, I., ve Ubuz, B., 2005. Geometrik Kavramların Geometer’s Sketchpad Yazılımı ile Geliştirilmesi. The
Turkish Online Journal of Educational Technology –
TOJET. 4 (3), 14–23.
Walkington, C. and Sherman, M. 2012. Using adaptive
learning technologies to personalize instruction: The impact of interest-based scenarios on performance in algebra. Proceedings of the 10thInternational Conference of the Learning Sciences. Sydney, Australia.
Walker, S. & Moore, S. 2013. Learning theories essay. Retrieve February 23, 2016 from http://swalkerced505. wikispaces.com/Learning+Theorists+Essay.