Development 140, 2835-2846 (2013) doi:10.1242/dev.094631 © 2013. Published by The Company of Biologists Ltd
INTRODUCTION
A deeper understanding of developmental and neurobiological processes requires high-resolution visualization of cell lineages and assemblies. The accessibility and translucency of zebrafish make it an ideal system for dissecting the cellular basis of vertebrate development. Indeed, substantial progress has been made in labeling zebrafish cells and following their trajectory through development. Initial advances based on cell labeling with organic dyes resulted in the establishment of fate maps, lineage diagrams and neural circuits (Kimmel and Law, 1985). The discovery of genetically encoded fluorescent proteins in conjunction with novel transgenic and microscopy technologies allowed for visualization of different cell types and subcellular compartments (Distel et al., 2006; Kawakami, 2004; Keller et al., 2008; Megason, 2009).
Despite these significant developments, current technologies still have several limitations. When a large number of cells are labeled, individual cells are often difficult to distinguish. In the nervous system, overlapping axons and dendrites cannot be resolved with conventional fluorescence microscopy, rendering it difficult to trace the precise connectivity of individual neurons. Similar problems arise during time-lapse visualization owing to the low speed and
resolution of current confocal and multiphoton technologies. To circumvent this challenge, two or three fluorescent colors (Distel et al., 2006; Hatta et al., 2006; Megason, 2009; Teddy et al., 2005) or faster imaging techniques (Dunsby, 2008; Huisken and Stainier, 2007; Keller et al., 2008) have been used. In these studies, however, each cell is labeled with the same set of colors (for example membrane in red and nuclei in green), which provides no distinction between adjacent cells.
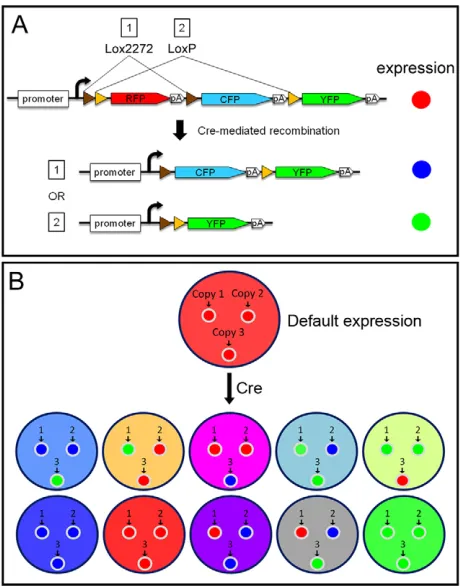
One potential solution to this problem involves labeling adjacent cells with many different colors, which was achieved by the development of Brainbow (Lichtman et al., 2008; Livet et al., 2007). The Brainbow construct contains a promoter followed by three fluorescent proteins: RFP, CFP and YFP (Fig. 1A). Expression of one and only one of these three proteins (per one copy of the construct) is achieved by the use of Lox sites, the recognition sites for Cre recombinase. Remarkably, transgenic mice that carried multiple reporter insertions showed a large variety of colors owing to stochastic recombination and combinatorial expression of fluorescent proteins in each cell (Fig. 1B). The unique combination provides each cell a distinct color, allowing resolution of individual cell boundaries. In addition to enhancing visual resolution, Brainbow can also be used as a multi-lineage marker (Buckingham and Meilhac, 2011; Kretzschmar and Watt, 2012). The stochastic recombination events in individual progenitor cells are inherited by their progeny, resulting in clones marked by different colors (Gupta and Poss, 2012; Snippert et al., 2010; Tabansky et al., 2012).
Previous studies have applied the Brainbow technology to zebrafish and have shown that Cre induction can generate many distinct colors from microinjected Brainbow plasmid DNA (Pan et al., 2011) or β-actin-2:Brainbowtransgenes (Gupta and Poss, 2012). These studies were restricted to early embryogenesis and heart tissue, respectively, and have not addressed several key questions: 1Department of Molecular and Cellular Biology, Harvard University, 16 Divinity
Avenue, Cambridge, MA 02138, USA. 2Program in Developmental & Stem Cell Biology, The Hospital for Sick Children, Toronto, Ontario, M5G 1X8, Canada. 3Center for Brain Science, Harvard University, Cambridge, MA 02138, USA. 4Broad Institute of MIT and Harvard, Cambridge, MA 02142, USA. 5Harvard Stem Cell Institute, Harvard University, Cambridge, MA 02138, USA.
*Authors for correspondence ([email protected]; [email protected])
‡Present address: Institute of Molecular Medicine and Genetics, Medical College of Georgia, Georgia Regents University, Augusta, GA 30912, USA
Accepted 2 May 2013 SUMMARY
Advances in imaging and cell-labeling techniques have greatly enhanced our understanding of developmental and neurobiological processes. Among vertebrates, zebrafish is uniquely suited for in vivoimaging owing to its small size and optical translucency. However, distinguishing and following cells over extended time periods remains difficult. Previous studies have demonstrated that Cre recombinase-mediated recombination can lead to combinatorial expression of spectrally distinct fluorescent proteins (RFP, YFP and CFP) in neighboring cells, creating a ‘Brainbow’ of colors. The random combination of fluorescent proteins provides a way to distinguish adjacent cells, visualize cellular interactions and perform lineage analyses. Here, we describe Zebrabow (Zebrafish Brainbow) tools for in vivomulticolor imaging in zebrafish. First, we show that the broadly expressed ubi:Zebrabowline provides diverse color profiles that can be optimized by modulating Cre activity. Second, we find that colors are inherited equally among daughter cells and remain stable throughout embryonic and larval stages. Third, we show that UAS:Zebrabowlines can be used in combination with Gal4 to generate broad or tissue-specific expression patterns and facilitate tracing of axonal processes. Fourth, we demonstrate that Zebrabow can be used for long-term lineage analysis. Using the cornea as a model system, we provide evidence that embryonic corneal epithelial clones are replaced by large, wedge-shaped clones formed by centripetal expansion of cells from the peripheral cornea. The Zebrabow tool set presented here provides a resource for next-generation color-based anatomical and lineage analyses in zebrafish.
KEY WORDS: Brainbow, Zebrafish, Clonal analysis, In vivoimaging, Lineage, Microscopy
Zebrabow: multispectral cell labeling for cell tracing and
lineage analysis in zebrafish
Y. Albert Pan1,*,‡, Tom Freundlich1, Tamily A. Weissman1, David Schoppik1, X. Cindy Wang1, Steve Zimmerman1, Brian Ciruna2, Joshua R. Sanes1,3, Jeff W. Lichtman1,3and Alexander F. Schier1,3,4,5,*
D
E
V
E
LO
P
M
E
N
can Brainbow be used in a wide variety of tissues? What are the optimal strategies to achieve broad or tissue-specific labeling? How can color diversity be maximized? How stable are colors over time and through cell divisions? Can Brainbow be used for clonal analysis in multiple organs? Here, we address these issues and describe tools and methods that will allow for the broad application of the Brainbow technology in zebrafish (Zebrabow): we describe new transgenic lines for ubiquitous or tissue-specific multicolor labeling; we show that multicolor labeling facilitates axonal tracing; we maximize color diversity by optimizing Cre activity; we show that colors are stable over time and after cell divisions; and we demonstrate that Zebrabow can be used for long-term clonal analysis in a wide variety of tissues. Long-term time-lapse imaging shows that the zebrafish corneal epithelium undergoes dramatic changes in clonal structures during development and suggests that late-born corneal clones are formed by centripetal expansion from the periphery. The Zebrabow tools and methods reported here provide an important resource to facilitate multicolor fluorescent labeling in a wide variety of applications.
MATERIALS AND METHODS Zebrafish husbandry and strains
Zebrafish from the TL/AB strain were maintained using standard procedures (Westerfield, 2000). Embryos were raised at 28.5°C in embryo water containing 0.1% Methylene Blue hydrate (Sigma, St Louis, MO, USA) and 0.03% Instant Ocean sea salt (United Pet Group, Cincinnati, OH, USA). At 24 hours post-fertilization (hpf), embryos were transferred to water with 0.003% 1-phenyl-2-thiourea (PTU; Sigma) to inhibit pigment formation. Developmental stages were determined as described previously (Kimmel et al., 1995). The pax2a:CreER19transgenic was obtained from the
Brand laboratory (Biotechnologisches Zentrum, Dresden, Germany) (Hans et al., 2009). The cmlc2:CreERtransgenic was obtained from the Poss laboratory (Duke University, Durham, NC, USA) (Kikuchi et al., 2010). The ubi:CreERtransgenic was obtained from the Zon laboratory (Boston Children’s Hospital, Boston, MA, USA) (Mosimann et al., 2011). The
s1102t Gal4 driver line was obtained from the Zebrafish International Resource Center (Eugene, OR, USA). The s1020tGal4 driver line was obtained from the Baier (Max Planck Institute of Neurobiology, Martinsried, Germany) and Isacoff (University of California, Berkeley, CA, USA) laboratories (Scott and Baier, 2009; Scott et al., 2007).
Quantitative PCR for genomic DNA
Genomic DNA was prepared with a modified HotSHOT method (Meeker et al., 2007). Embryos or fin clips were digested with 100 µl 50 mM sodium hydroxide (Sigma), incubated at 95°C for 20 minutes and then chilled to 4°C. 10 µl 1 M Tris-HCl (pH 7.5) (Sigma) was then added to each sample. Genomic DNA was mixed with primers and GoTaq qPCR Master Mix (Promega) and reactions were run on an Opticon 2 Real-Time Cycler (Bio-Rad). Primers for genomic DNA control are: 5⬘TCAG -TCAACCATTCAGTGGCCCAT-3⬘ and 5⬘CAGGAAAGGGAATG -CAGGGTTTGT-3⬘. Primers for Zebrabow are: 5⬘ -ACCTGGTGGA-GTTCAAGACCATCT-3⬘ and 5⬘TCGTACTGTTCCACGATGGTGT -AGTC-3⬘. Copy number was determined with the comparative Ct method (Tesson et al., 2010). Genomic DNA from ubi:Zebrabow-Sheterozygote was used as single-copy reference. Δ(Ct)=(Ct for Zebrabow PCR) – (Ct for control PCR); ΔΔCt=Δ(Ct, sample) – Δ(Ct, reference). Copy number in the sample=2–ΔΔCt.
Generation of transgenic lines
Zebrabow transgenesis constructs were generated with an upstream Gateway selection cassette (Life Technologies) (Zebrabow-GateDest; supplementary material Fig. S1A). The Gateway selection cassette allows insertion of promoter elements upstream of Zebrabow via homologous recombination (Kwan et al., 2007; Villefranc et al., 2007). The Zebrabow vectors have flanking Tol2 transposase and I-SceI meganuclease recognition sites to enhance transgenesis efficiency (Kikuta and Kawakami, 2009;
Thermes et al., 2002). Tol2-mediated transgenesis mediates high efficiency single insertions into the genome, whereas meganuclease-mediated transgenesis mediates lower efficiency, but multicopy, insertions into a single genomic locus. Completed constructs were tested by plasmid DNA injection into embryos (Pan et al., 2011).
ubi:Zebrabow-S andubi:Zebrabow-M
The ubi:Zebrabowtransgenic construct was generated by inserting the
ubiquitin bpromoter (Mosimann et al., 2011) into the Zebrabow-GateDest vector by homologous recombination. Plasmid DNA was isolated with QIAprep Spin Miniprep Kit (Qiagen) and repurified with QIAquick PCR purification Kit (Qiagen) to remove residual RNase. To generate transgenic lines, 35 pg Tol2mRNA and 20 pg plasmid DNA were co-injected into one-cell stage embryos. Eighty percent (18/22) of crosses between injected breeders gave rise to Zebrabow-expressing F1s. The Tg(ubi:Zebrabow-Sa132)line (referred to as ubi:Zebrabow-Sor line S) shows Mendelian
inheritance consistent with a single transgene. Using inverse PCR, the insertion site was mapped to chromosome 7 (chr7:27,259,360), in the first intron of an uncharacterized gene.
The Tg(ubi:Zebrabow-Ma131)line (referred to as ubi:Zebrabow-Mor line
M) had higher expression than ubi:Zebrabow-S. Using quantitative PCR of genomic DNA with ubi:Zebrabow-Sheterozygote as a single copy control, 16-32 copies of ubi:Zebrabowtransgene were found in this line. Expression starts between 6 and 9 hpf, and was present in all cell types examined. As
ubi:Zebrabowinsertions segregate in each generation, it is necessary to raise larvae with the brightest RFP expression. Quantitative PCR is then used to select for adult animals that harbor high numbers of transgenic insertions. Despite these measures, some insertions are lost in each generation. Sperm from F2 ubi:Zebrabow-Mmales was cryogenically preserved, allowing replenishment of the repertoire of Zebrabow transgenes by in vitro
fertilization. Additionally, the high rate of transgenesis with Tol2 transposase allows individual investigators to generate ubi:Zebrabow
multiple insertion lines easily.
UAS:Zebrabow-V andUAS:Zebrabow-B
The Tg(UAS:Zebrabow-Va130)line (referred to as UAS:Zebrabow-Vor line
V) was generated using the UAS:Brainbowconstruct described previously (Pan et al., 2011). The 14⫻UAS-E1B promoter (Köster and Fraser, 2001) was used, and transgenesis was performed with I-SceI meganuclease (New England BioLabs, MA, USA) (Thermes et al., 2002). F1 progeny from potential founders were injected with Gal4mRNA and screened by RFP expression. Quantitative PCR of genomic DNA showed that there are two insertions (likely in the same locus) in this line.
The Tg(UAS:Zebrabow-Ba133)line (referred to as UAS:Zebrabow-Bor
line B) was generated using the non-repetitive 4×UAS promoter (Akitake et al., 2011). Plasmid DNA was co-injected with Tol2mRNA into a Gal4 transgenic line with strong expression in the brain, skin and notochord (D.S. and A.F.S., unpublished). Potential founders were screened by RFP expression and a single line was identified. Quantitative PCR suggests 9-31 inserts per fish in this line. The UAS:Zebrabow-Bline was maintained in the background of the s1102tGal4 line; embryos with strong expression in the trigeminal ganglion were selected in each generation. Quantitative PCR was performed to select for adult animals harboring high numbers of transgenic insertions.
hsp:Cre
The Tg(hsp:Crea134)line (referred to as hsp:Cre) was generated by inserting
the zebrafish hsp70promoter and the Cregene into a plasmid containing flanking I-SceI meganuclease sites (a gift from Y. Rong, NIH, Bethesda, MD, USA). Plasmid DNA was injected into one-cell stage embryos and potential founders were screened by fin-clip PCR with transgene specific primers. hsp:Crelines were maintained separately from Zebrabow lines to avoid sporadic recombination in the germline. Some heat-induced recombination in superficial structures can occur if embryos are exposed to larger volumes of low-melting point agarose. This can be avoided by using small volumes of low-melting point agarose (that cool quickly) or by using alternative mounting methods, e.g. methylcellulose.
D
E
V
E
LO
P
M
E
N
Microscopy and image processing
Fish were anesthetized with ethyl 3-aminobenzoate methane sulfonate salt solution (Mesab, Sigma) and mounted in 1.0-1.5% low-melting point agarose on glass-bottomed culture dishes (P35G-0-14-C, MatTek). Confocal images were acquired with a 20× objective (Olympus XLUMPFL, NA=0.95) on an upright Olympus FV1000 microscope (Olympus, USA). The following laser lines and emission filters were used. RFP (dTomato): 561 nm laser and 585-685 nm band-pass filter. YFP: 515 nm laser and 535-565 nm band-pass filter. CFP (Cerulean): 440 nm laser and 465-495 nm band-pass filter.
For time-lapse imaging, settings were kept identical, except for the confocal pinhole. In the ubi:Zebrabow-Mline, fluorescence intensity gradually increases during development. To prevent image saturation, the confocal pinhole was reduced to decrease the amount of captured photons without changing the ratio of different fluorophores. For Hue and saturation analysis, tif image files were processed with Photoshop software (Adobe, USA). In Photoshop, color display mode was set to Hue-Saturation-Brightness (HSB) by selecting the ‘HSB sliders’ option in the ‘Color’ window. Using the eye dropper tool with sample size set at 5×5 pixels, an area at the center of a cell was selected. The average color values of the selected area was displayed in the ‘Color’ window and recorded manually. Single z-sections were used for color measurement. In cases where cells are less than 5 pixels wide in a single z-section, maximal intensity projection of two to three z-sections was used. Outlines of clones were determined by manually marking boundaries of cells in optical sections. For two-photon imaging, a Zeiss 710 NLO two-photon system with a 20× objective (W Plan-Apochromat, NA=1.0) was used (Zeiss, Germany). A Chameleon Ti:Sapphire laser (Coherent, USA) was tuned to 850 nm for CFP excitation and 930 nm for RFP and YFP excitation. Axonal tracing was carried out manually using the NeuronJ plugin in the ImageJ software (Schneider et al., 2012).
Cre expression Cre protein injection
Purified Cre protein was obtained from the Liu lab (Harvard University, Cambridge, MA, USA). Wild-type Cre was fused with a C-terminal 6×His tag and purified from bacterial lysate with Ni-NTA agarose resin, eluted and dialyzed (Cronican et al., 2010). For injection, 50 μM Cre protein was diluted 1:20 or 1:40 in 0.1 M potassium chloride (Sigma) and 1 nl of solution was injected into a single blastomere between the one- and eight-cell stages.
hsp:Cretransgenic line
12 hpf embryos were transferred with 1 ml of embryo water into 1.5 ml Eppendorf tubes and put into a 37°C heat block for 2.5, 5, 10, 15 or 20 minutes. Tubes were then left in 28.5°C incubator to cool down for 20 minutes before being transferred back into a Petri dish.
CreERtransgenic lines
Trangenics containing ubi:CreERwere treated with tamoxifen (25 μg/ml, Sigma) or 4-hydroxy-tamoxifen (5-10 μM) at late gastrulation stage (between 6 and 12 hpf). After treatment, tamoxifen or 4-hydroxy-tamoxifen was washed out with embryo water three times. Tamoxifen treatments for
pax2a:CreERand cmlc2:CreERwere performed as previously described (Hans et al., 2009; Kikuchi et al., 2010).
RESULTS
Generation of ubiquitously expressed and inducible Zebrabow transgenic lines
For Zebrabow transgenesis, we used the Brainbow1.0L DNA cassette (Fig. 1A) (Livet et al., 2007). The default expression is RFP, but Cre-mediated recombination switches expression to either CFP or YFP. The arrangement of two pairs of mutually incompatible Lox sites ensures that recombination occurs only once and is irreversible. These three fluorescent proteins have non-overlapping excitation/ emission profiles and their colors can be separated with commonly used optical filters (Livet et al., 2007; Pan et al., 2011; Weissman et
al., 2011). We generated two types of Zebrabow transgenic lines: ubi:Zebrabowand UAS:Zebrabow(Table 1).
ubi:Zebrabow
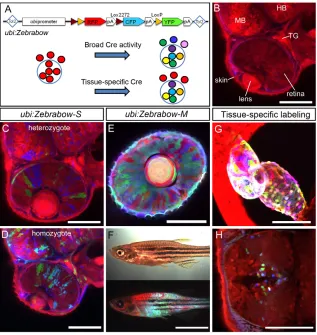
[image:3.612.322.554.60.353.2]To create Zebrabow lines with ubiquitous and sustained expression from embryonic to adult stages, we used the promoter from the zebrafish ubiquitin B(ubi) gene (Fig. 2A) (Mosimann et al., 2011). The ubi promoter drives ubiquitous and persistent transgenic expression and labels many cell types that are not labeled by other broad activity promoters, including the β-actin-2promoter used in the priZmBrainbow line (Gupta and Poss, 2012). We characterized two high-expressing lines: line S (ubi:Zebrabow-S) with a single mapped ubi:Zebrabowinsertion; and line M (ubi:Zebrabow-M) with multiple independent insertions (Fig. 2). Without Cre recombination, both lines express only RFP (Fig. 2B). In line S, Cre recombination generates three colors (in heterozygotes) or six colors (in homozygotes) (Fig. 2C,D). In line M, Cre recombination results in stochastic, combinatorial expression of RFP, CFP and YFP (Fig. 2E). Most cells express all three fluorophores, and more than 30 colors were commonly observed in a single optical section (see below). Expression before 24 hours post-fertilization (hpf) is relatively weak but quickly increases afterwards. Strong fluorescence was observed both in juvenile and adult animals (Fig. 2F; supplementary material Fig. S1).
Fig. 1. Stochastic multicolor labeling.(A) Arrangement of fluorescent proteins and Lox sites. Cre recombinase can recognize either Lox2272 (brown arrowheads) or LoxP (yellow arrowheads) sites, resulting in excision of sequences flanked by Lox sites. Because Lox2272 and LoxP are mutually incompatible, recombination occurs only between identical Lox sites (event 1 or 2). Expression is determined by whether and which recombination event occurs. (B) In a cell with multiple transgenic inserts, each insert is recombined stochastically with three possible outcomes (red, blue or green).
D
E
V
E
LO
P
M
E
N
We tested ubi:Zebrabow-M with different Cre expression methods to achieve either broad or tissue-specific multicolor labeling (Tables 2 and 3). For broad labeling, we found three approaches that generated consistent multicolor labeling: (1) Cre protein microinjection at the blastula stage (Fig. 2E); (2) crossing to a heat shock-inducible Cre line (hsp:Cre; Fig. 5C); and (3) crossing to a tamoxifen-inducible Cre line (ubi:CreER; Fig. 5F) (Mosimann et al., 2011). To test whether ubi:Zebrabow-Mcould be used for tissue-specific labeling, we crossed ubi:Zebrabow-Mto two tissue-specific Cre lines: (1) cmlc2:CreER, which is expressed in cardiomyocytes (Kikuchi et al., 2010); and (2) pax2a:CreER19, which is expressed in the forebrain diencephalon (Hans et al., 2009). Multicolor labeling was observed in Cre-expressing tissues, whereas other tissues only expressed RFP (default expression) (Fig. 2G,H). Therefore, multiple methods of Cre-mediated recombination can be used to generate ubiquitous or tissue-specific labeling.
UAS:Zebrabow
To render Zebrabow expression Gal4-inducible, we generated two UAS:Zebrabowreporter lines, one with standard 14×UAS repeats and
[image:4.612.50.560.71.130.2]more variegated expression (line V, UAS:Zebrabow-V), and the other with 4× non-repetitive UAS and broader expression (line B, UAS:Zebrabow-B) (Table 1 and Fig. 3) (Akitake et al., 2011; Köster and Fraser, 2001). UAS:Zebrabow-Vhas two non-segregating copies of Zebrabow (determined by quantitative PCR of genomic DNA, see Materials and methods) and shows robust expression. In the presence of Gal4 but without Cre recombination, the UAS line behaves like a RFP reporter line (Fig. 3B). After Cre recombination, we observed six colors in UAS:Zebrabow-Vheterozygous animals (consistent with expression of two copies of UAS:Zebrabow) (Fig. 3C) and more than ten colors in the progeny of heterozygous parents (Fig. 3D). The UAS:Zebrabow-B line has more than ten independent inserts (determined by quantitative PCR), which results in a wide variety of fluorescent colors after Cre injection (Fig. 3F). Both lines are compatible with multiple Gal4 lines (Fig. 3; data not shown), but UAS:Zebrabow-Blabels many more cells than the UAS:Zebrabow-V line for a given Gal4 driver (Fig. 3E,F). Some Gal4 lines, e.g. atoh7:Gal4(expressed in retinal ganglion cells) (Del Bene et al., 2010), are able to drive Zebrabow expression only in line B and not line V (C. Riegler and F. Engert, personal communication). These Table 1. Zebrabow transgenic lines
Fish lines Transgenesis method Insertion type Expression (heterozygous)
ubi:Zebrabow-S Tol2 Single insertion* Three colors
ubi:Zebrabow-M Tol2 Multiple independent insertions‡ Approximately 30 colors UAS:Zebrabow-V I-SceI Two copies into single locus‡ Six colors; strong and variegated UAS:Zebrabow-B Tol2 Multiple independent insertions‡ Over 10 colors; broader expression
*Determined by insertion mapping, expression and inheritance pattern (see Materials and methods).
‡Determined by quantitative PCR of genomic DNA (see Materials and methods).
Fig. 2. Ubiquitous and persistent Zebrabow expression with ubi:Zebrabowtransgenic fish. (A) Top, diagram of the ubi:Zebrabowconstruct; bottom, schematic of ubi:Zebrabowexpression. Small black circles indicate cells in the entire animal, and the large blue circle indicates an organ of interest. Recombination can be induced either broadly or in a tissue-specific manner. (B-D) Confocal images of ubi:Zebrabow-Stransgenic at 2 dpf. In the default state, RFP is expressed (B). With Cre protein injection, three colors are observed in heterozygotes (red, green, blue) (C) and increased color diversity is detected in homozygotes (D). (E,F) Combinatorial Zebrabow expression in ubi:Zebrabow-Mtransgenic injected with Cre. (E) Confocal section of the eye of a 2 dpf embryo. (F) Juvenile fish (30 dpf ) viewed under bright-field illumination (top) or fluorescent illumination (bottom). (G) Heart-specific
recombination in cmlc2:CreER;ubi:Zebrabow-Mlarvae. (H) Diencephalon-specific recombination in pax2a:CreER19;ubi:Zebrabow-Mlarvae. MB, midbrain;
HB, hindbrain; TG, trigeminal ganglion. Scale bars: 100 μm in B-E,G,H; 5 mm in F.
D
E
V
E
LO
P
M
E
N
[image:4.612.52.369.405.740.2]results suggest that line B is more permissive to Gal4-induced expression and might have a lower threshold for Gal4 activation. The sparse labeling and strong expression in UAS:Zebrabow-V is therefore best suited for tracking a few cells (see below), whereas the broader expression and more diverse colors in UAS:Zebrabow-Bmay be better suited for analyses of large cell populations.
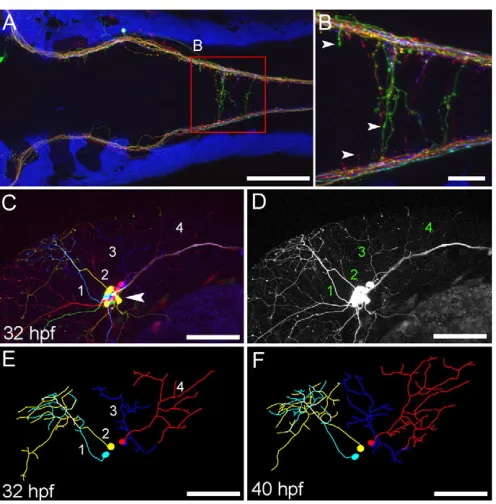
Different Gal4 and Cre expression methods were tested in UAS:Zebrabow-Bfor broad and tissue-specific labeling (Tables 2 and 3). Broad Zebrabow expression can be induced by Gal4mRNA and Cre protein co-injection at the blastula stage (Fig. 3G,H). Labeling density can be controlled by injecting Gal4mRNA at the one-cell stage (ubiquitous labeling) or into one of the blastomeres at the four- to eight-cell stage (sparse labeling). Expression starts between 5 and 8 hpf and is very robust by 14 hpf, in contrast to the relatively weak embryonic expression of ubi:Zebrabowat this stage. However, fluorescence gradually declines as Gal4 is degraded. For tissue-specific labeling with Gal4 driver lines, both hsp:Cre transgenic or Cre protein injection were suitable. Somatosensory axons labeled with UAS:Zebrabow-Vshowed normal development, suggesting that strong Zebrabow expression does not affect axonal outgrowth or formation of presynaptic terminals (Fig. 4) (Pan et al., 2012; Sagasti et al., 2005). Fluorescent colors are consistent at different points along the axon and in the cell body (supplementary material Fig. S2). The strong expression and relatively sparse labeling in UAS:Zebrabow-Vis well suited for time-lapse imaging, and color diversity facilitates tracing of overlapping axonal arbors (Fig. 4C-F; supplementary material Movies 1 and 2).
Optimization of color diversity
To compare color diversity under different experimental conditions, we measured the hue and saturation of individual cells. Hue describes the visible light spectrum, from red to violet, and is measured in degrees, with red at 0°, green at 120° and blue at 240° (Fig. 5A). Saturation is the purity of color, describing the percentage of a given hue that is mixed with neutral color (white or gray). Pure red has 100% saturation, pink has intermediate saturation and white has 0% saturation (Fig. 5A). Fluorescence brightness also contributes to color, but brightness is significantly influenced by differences in expression level, cellular topography and light scattering at different depth of imaging. We therefore focused our analysis on hue and saturation.
Using the heat-shock inducible hsp:Creline, we found that the extent of recombination could be controlled by the duration of heat shock. With a brief heat shock (2.5 minutes), very few cells underwent recombination. These cells were mostly magenta (red+blue) and yellow (red+green), with very similar hue and saturation values (Fig. 5B). With an intermediate heat shock (5 minutes), color diversity increased both visually and on the Hue-Saturation graph (Fig. 5C). Based on hue and saturation we estimated that there were ~30 distinct colors in a single optical section. A longer heat shock (20 minutes) resulted in a reduction in color variety, as most cells were different shades of blue and green (Fig. 5D).
Optimization of color was also possible with pharmacological induction of Cre using the ubi:CreERtransgenic line (Fig. 5E,F) (Mosimann et al., 2011). A low dose of tamoxifen (10 μg/ml) produced limited color diversity, whereas a high dose of tamoxifen (25 μg/ml) produced a similarly high level of color variety, as generated by intermediate length of heat shock. These results demonstrate that Zebrabow color diversity can be optimized by varying Cre levels and activity.
Inheritance and stability of color
[image:5.612.53.558.71.206.2]Stably maintained and inherited colors allow lineage tracing and fate mapping. Characterization of color profile of cells at an early time point allows re-identification of the cells with the same color profile at a later time point. This approach is ideally suited to determining the lineages of different progenitor populations or the clonal origins of organs or tumors. Zebrabow and Brainbow techniques rely on genomic rearrangements that are stably passed on from progenitor to progeny. It has been thus assumed that color would also be stable and identical among cells with the same clonal origin (Gupta and Poss, 2012; Tabansky et al., 2012). However, this assumption has not been directly validated. Changes in gene expression could conceivably occur without further Cre-mediated genomic modification, e.g. by gene silencing or other epigenetic mechanisms (Shilatifard, 2006; Vastenhouw and Schier, 2012). Color changes within a lineage could erroneously split single lineages into several distinct lineages (Walsh and Cepko, 1992). To address this issue, we followed a small cluster of cells from embryonic to post-embryonic stages and asked whether color Table 2. Schemes for broad labeling
Zebrabow expression Cre delivery Cre activity Advantages Disadvantages
ubi:Zebrabow Injection of purified Cre Broad Early recombination; broad Activity not temporally controlled
protein or sparse labeling by
injecting at one-cell or eight-cell stage, respectively
ubi:Zebrabow Cross tohsp:Cre Heat shock induced; Temporal control: strong Cre Cre is expressed without heat broad activity can be induced in shock in some tissues (e.g. skin)
older larvae
ubi:Zebrabow Cross to ubi:CreER* Tamoxifen induced; Temporal control of activity Lower Cre activity after 24 hpf broad
UAS:Zebrabow with Injection of purified Cre Broad Strong expression, particularly at Expression declines at larval
Gal4mRNA injection protein early embryonic stages stage (>3 dpf)
*Mosiman et al., 2011
Table 3. Schemes for tissue-specific labeling
Zebrabow expression Cre delivery Advantages Disadvantages
ubi:Zebrabow Cross to tissue-specific Cre line Stable Weak early expression UAS:Zebrabow + tissue-specific Cre injection or cross to hsp:Cre Strong expression; sparse labeling Variegated expression in line V
Gal4 line in line V
D
E
V
E
LO
P
M
E
N
[image:5.612.49.570.690.739.2]remained stable over time and was faithfully inherited by daughter cells. The Hue-Saturation plot is a convenient way of evaluating color inheritance and stability. If colors remained the same, measurements from different time points would form a cluster on the Hue-Saturation graph; if not, data points would be dispersed.
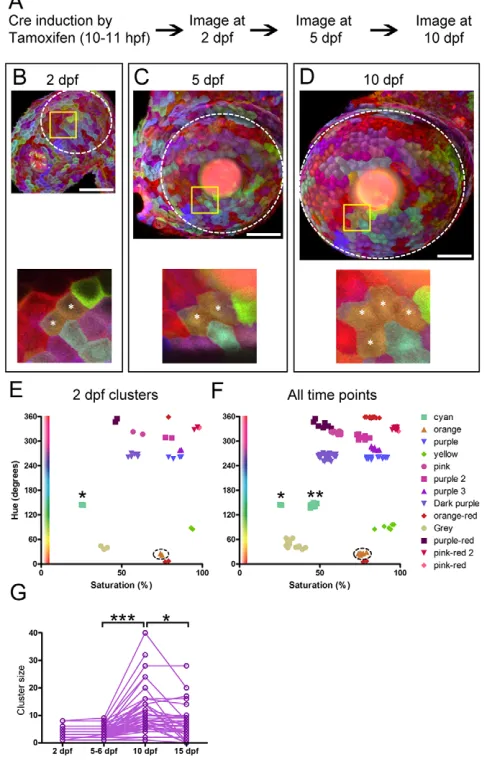
We focused on the epithelial cells on the surface of the eye (the cornea), which are large and superficial. The corneal epithelium is also an important model system for stem cell biology and lineage analysis (see next section). Ubi:Zebrabow-M;ubi:CreERembryos were treated with tamoxifen at gastrulation stage (10-11 hpf) and corneal epithelial cells were followed over time (Fig. 6A). At 2 days post-fertilization (dpf), epithelial cells form single-color clusters that tile the corneal surface (Fig. 6B). Cells within a cluster have very similar Hue-Saturation profiles, suggesting that cells within a cluster share common lineage (Fig. 6E). Movement of cells between clusters was negligible, which allowed us to use relative location in addition to color to track clusters from embryonic to larval stages (Fig. 6B-D). Between 5 and 10 dpf, the number of cells per cluster increased almost threefold (3.4 cells/cluster to 9.4 cells/cluster, Fig. 6C,D,G), but the Hue-Saturation profile of individual cells stayed remarkably consistent (Fig. 6E,F). In very rare cases, the color profile did change slightly between 2 and 5 dpf (asterisks, Fig. 6E,F), probably owing to the time needed for mature fluorescent protein to accumulate. These results strongly suggest
that color is faithfully inherited among the large majority of daughter cells and is stable over time. The combination of time-lapse imaging and color analyses suggest that single-color clusters in the cornea are likely to be formed by clonally derived cells and we will refer to them as clones in the following sections.
Long-term clonal analyses in the cornea
[image:6.612.52.369.58.463.2]To test whether Zebrabow would be suitable for long-term clonal analyses, we investigated the developmental changes in the corneal epithelium. In the mammalian cornea, epithelial cells with strong proliferative capacity and stem cell-like properties are initially distributed across the entire cornea (Chung et al., 1992; Collinson et al., 2002; Davies et al., 2009). As the embryo develops, corneal stem cells become restricted to the peripheral edge of the cornea, the limbus (Davies and Di Girolamo, 2010). This shift in corneal stem cell location is reflected in the clonal composition of the cornea during the course of development. Random cell labeling in transgenic mice using the lineage marker lacZresults initially in small scattered clones that are then gradually replaced by large wedge-shaped clones (Collinson et al., 2002). The zebrafish cornea is structurally similar to mammalian cornea, but developmental changes in clonal structures have not been investigated (Soules and Link, 2005; Zhao et al., 2006). The cornea is therefore an excellent system to test the extent to which Zebrabow can reveal complex clonal relationships and dynamics.
Fig. 3. Gal4 inducible expression with
UAS:Zebrabowtransgenic fish.(A) Top, diagram of the UAS:Zebrabowconstructs; bottom, schematic of UAS:Zebrabowexpression. (B-D) Trigeminal sensory neurons labeled with UAS:Zebrabow-Vand a somatosensory neuron-specific Gal4 driver, s1102t. In the absence of Cre, only RFP is expressed (B). When Cre is provided, six colors are observed in
heterozygotes (C) and more than ten colors are observed in the progeny of crosses between heterozygous parents (D). (E,F) Using the s1020tGal4 line, spinal cord labeling in line V is sparse (E), whereas labeling in line B is significantly broader (F). (G,H) Broad labeling can be achieved by co-injecting Gal4mRNA and Cre protein. Expression is strong from embryonic stage (G, 24 hpf ) to larval stage (H, 3 dpf ). Scale bars: 50 μm.
D
E
V
E
LO
P
M
E
N
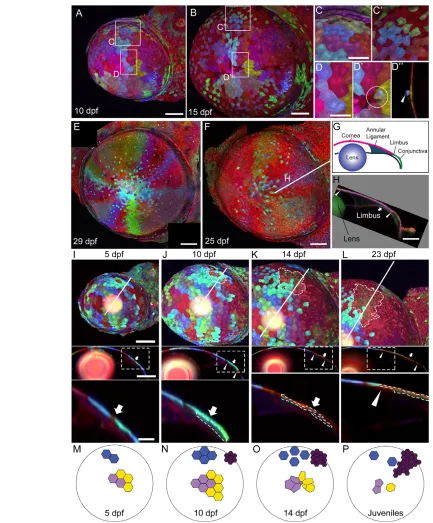
To label clones, we induced Cre at 6-12 hpf in ubi:Zebrabow-M;ubi:CreER embryos. Confocal z-stacks of the cornea were acquired in a time series. At embryonic and early larval stages (2-10 dpf), the corneal surface was covered by the same cohort of embryonic epithelial clones (Fig. 6B-D). From 10 to 15 dpf, several notable changes began to reshape clone structure (Fig. 7A-D). In the peripheral cornea, clones were scattered and interspersed by smaller cells (Fig. 7C,C⬘); in the central cornea, rosette-like structures were frequently observed, accompanied by the presence of extruded epithelial cells (Fig. 7D-D⬙). This is reminiscent of the extrusion and death of surface epithelial cells in other systems (Eisenhoffer et al., 2012; Eisenhoffer and Rosenblatt, 2011). Consistent with the idea of cell extrusion, the number of cells per clone decreased significantly between 10 and 15 dpf (Fig. 6G).
[image:7.612.336.534.54.656.2]At juvenile stage (3-4 weeks), clone structure becomes markedly different. Large wedge-shaped clones are seen, interspersed with scattered embryonic epithelial cells (Fig. 7E,F). This clonal structure is maintained in adults, similar to the clones seen in the adult mammalian cornea (data not shown). Indeed, the peripheral borders of the clones overlay the limbus and expand to the neighboring conjunctiva (Fig. 7G,H). To explore how clones are formed over time, we followed individual animals over the span of several weeks (5-23 dpf or 10-30 dpf) (Fig. 7I-L; supplementary material Fig. S3). We found that nascent clones were often found in the peripheral cornea by 10 dpf, underneath embryonic epithelial cells (Fig. 7J). Fig. 4. Axon labeling and tracing.The s1102t;UAS:Zebrabow-V
transgenic line labels somatosensory neurons and their axons. (A,B) Central axons in the hindbrain at 5 dpf, viewed dorsally. Axonal varicosities (presynaptic terminals) are visible in individual axons (B, arrowheads). (C-F) Somatosensory neuron cell bodies are located in the trigeminal ganglion (C, arrowhead). Each neuron forms an axonal arbor that branches extensively in the skin. Four neurons (numbered) were traced and are shown in E. The same image in the absence of color information is more difficult to trace (D). Axonal morphology was imaged every 2 hours from 28 to 44 hpf. Two time points are shown (E,F). Scale bars: 100 μm in A,C-F; 25 μm in B.
Fig. 5. Optimization of color diversity.(A) Hue-Saturation plot, with colors displayed according to their color profile. Pure colors (red, green, blue) are highlighted. 0° hue is equivalent to 360° hue. (B-F) Confocal images of the eye of a ubi:Zebrabow-Mtransgenic larva under different Cre activity levels. Cre was induced by heat shock (B-D) or by addition of tamoxifen (E,F). Heat-shock duration and tamoxifen concentration are as indicated. Each data point represents the color profile of a single cell
within one optical section. Scale bars: 50 μm.
D
E
V
E
LO
P
M
E
N
[image:7.612.52.300.58.310.2]From 10-23 dpf, clones expand peripherally into the conjunctiva and centrally towards the central cornea. At 30 dpf, some clones have reached the center of the cornea. These results are consistent with the model that corneal epithelial cells are derived from the limbus (Collinson et al., 2002; Nagasaki and Zhao, 2003; Sun et al., 2010). A working model of clonal development in the corneal epithelium is shown in Fig. 7M-P. These results demonstrate that dynamic clonal structures can be observed via long-term Zebrabow clonal analysis.
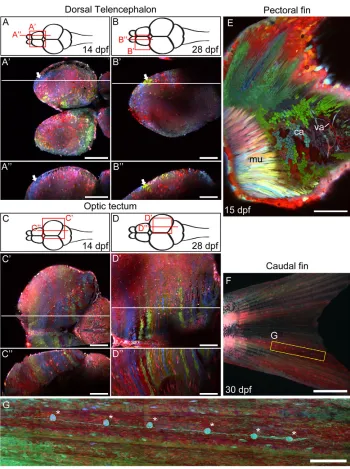
Zebrabow labeling in different organ systems Last, we asked whether single-color cell clusters such as those seen in the cornea can be observed in other organ systems. As cells within these clusters are likely to be clonally related, the size and shape of single-color clusters provide clues about the extent of progenitor cell proliferation and cell migration during organogenesis. We used ubi:Zebrabow-M transgenic fish and generated embryonic clones by pulsed tamoxifen-induced Cre recombination or Cre protein injection. We first examined the nervous system, specifically in regions of the dorsal telencephalon and optic tectum that undergo robust post-embryonic neurogenesis (Grandel and Brand, 2012; Ito et al., 2010; Kizil et al., 2012; Mueller and Wullimann, 2003; Wullimann, 2009; Zupanc et al., 2005). In the dorsal telencephalon, single-color clusters of various shapes can be seen near the ventricular (dorsal) surface starting at 14 dpf (Fig. 8A). This is consistent with active neurogenesis in the ventricular surface and suggests that large areas of the forebrain are formed by clonally related cells (Zupanc et al., 2005). By contrast, the dorsal optic tectum is mostly composed of medial-lateral clusters at 14 dpf (Fig. 8C). This structure is consistent with recent evidence showing that tectal stem cells are located medially and their progeny migrate laterally (Ito et al., 2010). These clone-like clusters were also observed at 28 dpf, despite the significant increase in brain size, suggesting that the observed structures are stable (Fig. 8B,D). Overall, these results suggest that clustering of clonally related cells might be a prominent feature of the mature dorsal telencephalon and optic tectum.
We also observed single-color clusters in other organ systems. In the pectoral fin, chondrocytes (cartilage cells) form small and scattered clusters, suggesting that local and dispersed proliferation is the predominant mode of growth (Fig. 8E) (Dewit et al., 2011). In the caudal fin, proximal-distal arrays of lateral line organs were seen, consistent with previous descriptions of clones of lateral line cells (Fig. 8F,G) (Tu and Johnson, 2011). These results demonstrate the potential of Zebrabow for long-term lineage analyses in different tissues.
DISCUSSION
The results presented here demonstrate the strength and versatility of multicolor genetic labeling in zebrafish and provide well-characterized tools and validated methods that can be readily adopted. The ubi:Zebrabowand UAS:Zebrabowlines are suitable for both broad and tissue-specific multicolor labeling: color is faithfully inherited between daughter cells and is stable over time, and clone-like structures can be identified in tissues ranging from the cornea and forebrain to caudal fin and cartilage. As different Zebrabow and Cre combinations have distinct advantages (Tables 2 and 3), investigators can select from a wide array of approaches to suit their imaging needs. Thus, Zebrabow provides the resources necessary for systematic anatomical and lineage studies during zebrafish development.
Optimizing color stability and diversity
[image:8.612.53.297.67.449.2]Our results show that Zebrabow colors remain stable over time. However, colors only become stable after color establishment and maturation. First, Cre needs to be expressed and then recombine the Lox sites. Second, fluorescent protein concentration needs to reach a steady state. The non-default fluorophores (CFP and YFP) need time to accumulate, whereas the default fluorophore (RFP) needs time to degrade. Thus, the color maturation rate depends on the timing of Cre recombination, the amount of residual RFP, and accumulation of mature CFP and YFP. One way to minimize Fig. 6. Inheritance and stability of color.(A) Experimental procedure
for time-lapse imaging. (B-D) A Ubi:Zebrabow-M;ubi:CreERtransgenic animal imaged from 2 to 10 dpf. Images are shown at the same scale at each developmental stage. Yellow boxed regions are shown at higher magnification in the bottom panels. (E,F) Color profiles for individual cells are plotted. At 2 dpf, single-color cell clusters are plotted on the Hue-Saturation graph (E). The orange cluster shown in B-D (asterisks) is circled. We re-identified individual clusters at 5 and 10 dpf, and plotted all of the cells from all clusters from all time points (2, 5 and 10 dpf ) (F). The orange cluster showed highly similar color profiles at all time points, as do most other clusters. One exception is a cyan cluster (asterisk), which showed an increase in saturation from 2 dpf to 5 dpf. (G) Analysis of cluster size (number of cells within a cluster) at different time points. Cluster size increases between 5-6 dpf and 10 dpf (***P<0.001) and decreases thereafter (*P<0.05). Significance calculated by one-way analysis of variance with Bonferroni post hoctest. Sample size: 2 dpf, n=33; 5-6 dpf, n=86; 10 dpf, n=86; 15 dpf, n=48. Scale bars: 50 μm.
D
E
V
E
LO
P
M
E
N
Fig. 7. Long-term clonal analyses in the cornea.(A,B) Corneal clones at 10 and 15 dpf. (C,C⬘) Peripheral cornea clones become scattered and interspersed by smaller cells. (D-D) Rosette-like structures are seen in the central cornea (compare D with D⬘, circle marks a rosette). In optical cross-section at the center of the rosette (D⬙), a cell that has been extruded from the corneal surface can be seen (arrowhead). (E,F) Two examples of wedge-shaped clones in juvenile stage fish. (G) The anterior segment of the eye, shown in cross-section. The limbus marks the boundary of the cornea (pink) and the conjunctiva (green). (H) Optical cross-section at the plane indicated by the white line in F. Arrowheads indicate the peripheral and central boundaries of the clone. Arrow marks the limbus. (I-L) Top panels show lateral view of the cornea, with an olive-colored, late-born clone outlined (clone is not found at 5 dpf ). Part of the olive-colored clone is underneath cyan-colored cells, which become more dispersed over time. Middle panels show optical cross-sections at the plane indicated by the white line in the top panels. Bottom panels show the region outlined in the box in the middle panels. The olive-colored clone is outlined. Arrows indicate the limbus; arrowheads mark the peripheral and central boundaries of the clone.
(M-P) Model of clone development in the corneal epithelium. Large circle indicates the cornea and small polygons indicate cells. (M) At 5 dpf, clones are small and cohesive. (N) At 10 dpf, cells proliferate and remain cohesive. Small clones at the limbus region are formed (dark purple cluster). (O) At 14 dpf, early formed clones are scattered in the peripheral cornea (blue cluster) and form rosettes in the central cornea (light purple and yellow clusters). Cells in the late-formed purple cluster proliferate and migrate towards the center. (P) Early-formed clusters are further dispersed. Late-formed clusters begin to form wedge-shape structures. Scale bars: 100 μm in A,B; 50 μm in C,D; 200 μm in E,F,H; in I-L, 100 μm in the top and middle panels, and 25 μm in the
bottom panels.
D
E
V
E
LO
P
M
E
N
maturation time is to induce Cre-mediated recombination prior to the significant accumulation of RFP. To maintain color stability, it is also essential that Cre activity is transient so that RFP expression is not continuously changed to CFP or YFP expression.
Imaging conditions also impact color stability. Different fluorescent proteins have different photostability profiles, excitation and emission spectra, and abilities to withstand fixation (Shaner et al., 2008; Shaner et al., 2005; Weissman et al., 2011). These factors can impact color after sample preparation and imaging. For example, in deeper tissues, longer wavelength light (emitted by RFP) will be scattered less than shorter wavelength light. We have focused on more superficial structures because imaging beyond the depth of 200-300 μm remains challenging. It will be interesting to test whether recent advances in microscopy or tissue clearing techniques will improve Zebrabow imaging in deeper structures (Hama et al., 2011; Kaufmann et al., 2012; Keller et al., 2008; Kuwajima et al., 2013). Intense laser excitation may also skew the relative ratio of the three fluorophores because
RFP and CFP are less photostable than YFP (Weissman et al., 2011). Our results show the ability of Zebrabow to generate stable colors, but color establishment and stability need to be tested empirically.
[image:10.612.52.402.58.527.2]Color diversity is another important variable in multicolor imaging. High color diversity makes each cell more traceable and reduces the chance that different clones have identical colors. Our results show that Zebrabow color profiles change in a predictable trajectory in response to increasing Cre levels and activity. As long as Cre activity is tunable (with heat shock or tamoxifen), it is possible to generate optimal color diversity. We also found that the number of cells that have undergone recombination increases with increasing Cre activity. Recombination takes place in fewer cells under low color diversity conditions and in more cells under high diversity conditions. In applications in which both sparse labeling and high color diversity are required, transplantation approaches (e.g. ubi:Zebrabowinto wild type) can be used to reduce labeling density (data not shown).
Fig. 8. Zebrabow labeling in different organ systems. (A-D⬙) Two-photon image of the dorsal telencephalon and optic tectum at late larval stage (14 dpf, A-A⬙and C-C⬙) and juvenile stage (28 dpf, B-B⬙and D-D⬙). A-D show diagrams of the zebrafish brain, viewed dorsally. A⬘-D⬘ show horizontal optical sections of the areas highlighted in the diagrams above. A⬙-D⬙show sagittal optical sections along the horizontal lines in the middle panel. Clusters of single-colored cells are seen at different regions of the dorsal telencephalon (white arrows). (E) The pectoral fin of a 15 dpf animal, viewed from the side. Muscle (mu), cartilage (ca) and vasculature (va) can be seen in this view. (F,G) In the caudal fin, an array of lateral line organs (asterisks) extend from the base of the tail to the edge of the caudal fin (G). Scale bars: 100 μm in A-E; 1 mm in F; 250 μm in G.
D
E
V
E
LO
P
M
E
N
Clonal analyses
Our study demonstrates that Zebrabow has the potential for clonal analysis in a wide variety of tissues, including the cornea, brain, muscle, cartilage and vasculature. The diversity of clone-like clusters in different organs suggests different modes of progenitor expansion during organogenesis. For example, the presence of large cohesive clusters suggests not only rapid proliferation of a small pool of progenitor cells but also limited dispersal of daughter cells from their site of origin. Such aspects of cell behavior can be studied readily with the techniques used here.
Putative clones can be identified not only by the shared colors of cohesive clusters, but color may also be used to determine whether dispersed cells might be clonally related. Compared with single or double labeling, the wide diversity of color in Zebrabow reduces the likelihood that unrelated cells have the same color. However, extensive dispersal of cells with similar color can hinder the unambiguous assignment of clonal relationships. One approach to help identify clones would be to compare the number of cells per single-color clone (clone size) at different labeling density: if cells with the same color are clonally related, clone size will be the same regardless of labeling density. By contrast, if many unrelated cells share the same color, clone size would increase with labeling density. Such calculations have been performed in retroviral clonal analysis and could be applied to color analysis (Galileo et al., 1990). In the cornea, it has long been believed that epithelial stem cells are located exclusively in the limbus and that corneal clones are formed by centripetal growth from the limbus (Davies and Di Girolamo, 2010; Lavker et al., 2004). Interestingly, new evidence suggest that corneal stem cells might be scattered over the entire cornea and that corneal clones may be formed by centrifugal, rather than centripetal, growth (Majo et al., 2008). We find that many zebrafish corneal clones are derived from the peripheral cornea, a region analogous to the limbus. Although our results do not exclude the possibility that a subset of clones might originate from the central cornea, time-lapse imaging of single clones suggests that corneal clones form by centripetal expansion of limbus-derived clones. These results demonstrate that the Zebrabow resource described here is ideally suited to address fundamental questions in organogenesis and tissue homeostasis.
Acknowledgements
We thank D. Cai for helpful suggestions; C. Mosimann and L. Zon for suggestions and the ubi:CreERtransgenic; K. Cerveny for help with inverse PCR and adult zebrafish histology; J. Cronican and D. Liu for providing purified Cre protein; M. Brand for the pax2a:CreERtransgenic; K. Poss for the
cmlc2:CreERtransgenic; H. Baier and E. Isacoff for the s1020tGal4 driver line; Y. Rong for the pBSII-KS-I-SceI plasmid; Z. Tobias for analyses on the onset of Zebrabow expression; J. Miller and K. Hurley for fish care; J. Gagnon, K. Rogers and A. Pauli for comments on the manuscript; and members of the Schier laboratory for discussion.
Funding
This work was supported by a National Research Service Award postdoctoral fellowship [NS578702 to Y.A.P.] and a research grant [R01 HD067140 to A.F.S.] from the National Institutes of Health. D.S. was supported by a Helen Hay Whitney Foundation fellowship. Deposited in PMC for release after 12 months.
Competing interests statement
The authors declare no competing financial interests.
Author contributions
Y.A.P. and A.F.S. conceived the study, with input from J.W.L and J.R.S. Y.A.P. and T.F. performed the experiments. Y.A.P., T.F. and A.F.S. analyzed the data. Y.A.P. generated the Zebrabowtransgenic lines, with help from T.F., T.A.W., D.S. and X.C.W. S.Z. and B.C. generated the hsp:Cretransgenic line. Y.A.P. and A.F.S wrote the manuscript, with contributions from J.R.S.
Supplementary material
Supplementary material available online at
http://dev.biologists.org/lookup/suppl/doi:10.1242/dev.094631/-/DC1
References
Akitake, C. M., Macurak, M., Halpern, M. E. and Goll, M. G.(2011). Transgenerational analysis of transcriptional silencing in zebrafish. Dev. Biol.
352, 191-201.
Buckingham, M. E. and Meilhac, S. M.(2011). Tracing cells for tracking cell lineage and clonal behavior. Dev. Cell21, 394-409.
Chung, E. H., Bukusoglu, G. and Zieske, J. D.(1992). Localization of corneal epithelial stem cells in the developing rat. Invest. Ophthalmol. Vis. Sci.33, 2199-2206.
Collinson, J. M., Morris, L., Reid, A. I., Ramaesh, T., Keighren, M. A., Flockhart, J. H., Hill, R. E., Tan, S. S., Ramaesh, K., Dhillon, B. et al.(2002). Clonal analysis of patterns of growth, stem cell activity, and cell movement during the development and maintenance of the murine corneal epithelium. Dev. Dyn.224, 432-440.
Cronican, J. J., Thompson, D. B., Beier, K. T., McNaughton, B. R., Cepko, C. L. and Liu, D. R.(2010). Potent delivery of functional proteins into Mammalian cells in vitro and in vivo using a supercharged protein. ACS Chem. Biol.5, 747-752.
Davies, S. B. and Di Girolamo, N.(2010). Corneal stem cells and their origins: significance in developmental biology. Stem Cells Dev.19, 1651-1662.
Davies, S. B., Chui, J., Madigan, M. C., Provis, J. M., Wakefield, D. and Di Girolamo, N.(2009). Stem cell activity in the developing human cornea. Stem Cells27, 2781-2792.
Del Bene, F., Wyart, C., Robles, E., Tran, A., Looger, L., Scott, E. K., Isacoff, E. Y. and Baier, H.(2010). Filtering of visual information in the tectum by an identified neural circuit. Science330, 669-673.
Dewit, J., Witten, P. E. and Huysseune, A.(2011). The mechanism of cartilage subdivision in the reorganization of the zebrafish pectoral fin endoskeleton. J. Exp. Zool. 316B, 584-597.
Distel, M., Babaryka, A. and Köster, R. W.(2006). Multicolor in vivo time-lapse imaging at cellular resolution by stereomicroscopy. Dev. Dyn.235, 1100-1106.
Dunsby, C.(2008). Optically sectioned imaging by oblique plane microscopy. Opt. Express16, 20306-20316.
Eisenhoffer, G. T. and Rosenblatt, J.(2011). Live imaging of cell extrusion from the epidermis of developing zebrafish. J. Vis. Exp.52, 2689.
Eisenhoffer, G. T., Loftus, P. D., Yoshigi, M., Otsuna, H., Chien, C. B., Morcos, P. A. and Rosenblatt, J.(2012). Crowding induces live cell extrusion to maintain homeostatic cell numbers in epithelia. Nature484, 546-549.
Galileo, D. S., Gray, G. E., Owens, G. C., Majors, J. and Sanes, J. R.(1990). Neurons and glia arise from a common progenitor in chicken optic tectum: demonstration with two retroviruses and cell type-specific antibodies. Proc. Natl. Acad. Sci. USA87, 458-462.
Grandel, H. and Brand, M.(2012). Comparative aspects of adult neural stem cell activity in vertebrates. Dev. Genes Evol.223, 131-147.
Gupta, V. and Poss, K. D.(2012). Clonally dominant cardiomyocytes direct heart morphogenesis. Nature484, 479-484.
Hama, H., Kurokawa, H., Kawano, H., Ando, R., Shimogori, T., Noda, H., Fukami, K., Sakaue-Sawano, A. and Miyawaki, A.(2011). Scale: a chemical approach for fluorescence imaging and reconstruction of transparent mouse brain. Nat. Neurosci.14, 1481-1488.
Hans, S., Kaslin, J., Freudenreich, D. and Brand, M.(2009). Temporally-controlled site-specific recombination in zebrafish. PLoS ONE4, e4640.
Hatta, K., Tsujii, H. and Omura, T.(2006). Cell tracking using a photoconvertible fluorescent protein. Nat. Protoc.1, 960-967.
Huisken, J. and Stainier, D. Y.(2007). Even fluorescence excitation by multidirectional selective plane illumination microscopy (mSPIM). Opt. Lett.32, 2608-2610.
Ito, Y., Tanaka, H., Okamoto, H. and Ohshima, T.(2010). Characterization of neural stem cells and their progeny in the adult zebrafish optic tectum. Dev. Biol.342, 26-38.
Kaufmann, A., Mickoleit, M., Weber, M. and Huisken, J.(2012). Multilayer mounting enables long-term imaging of zebrafish development in a light sheet microscope. Development139, 3242-3247.
Kawakami, K.(2004). Transgenesis and gene trap methods in zebrafish by using the Tol2 transposable element. Methods Cell Biol.77, 201-222.
Keller, P. J., Schmidt, A. D., Wittbrodt, J. and Stelzer, E. H.(2008). Reconstruction of zebrafish early embryonic development by scanned light sheet microscopy. Science322, 1065-1069.
Kikuchi, K., Holdway, J. E., Werdich, A. A., Anderson, R. M., Fang, Y., Egnaczyk, G. F., Evans, T., Macrae, C. A., Stainier, D. Y. and Poss, K. D.
(2010). Primary contribution to zebrafish heart regeneration by gata4(+) cardiomyocytes. Nature464, 601-605.
Kikuta, H. and Kawakami, K.(2009). Transient and stable transgenesis using
tol2 transposon vectors. Methods Mol. Biol.546, 69-84.
D
Kimmel, C. B. and Law, R. D.(1985). Cell lineage of zebrafish blastomeres. III. Clonal analyses of the blastula and gastrula stages. Dev. Biol.108, 94-101.
Kimmel, C. B., Ballard, W. W., Kimmel, S. R., Ullmann, B. and Schilling, T. F.
(1995). Stages of embryonic development of the zebrafish. Dev. Dyn.203, 253-310.
Kizil, C., Kaslin, J., Kroehne, V. and Brand, M.(2012). Adult neurogenesis and brain regeneration in zebrafish. Dev. Neurobiol.72, 429-461.
Köster, R. W. and Fraser, S. E.(2001). Tracing transgene expression in living zebrafish embryos. Dev. Biol.233, 329-346.
Kretzschmar, K. and Watt, F. M.(2012). Lineage tracing. Cell148, 33-45.
Kuwajima, T., Sitko, A. A., Bhansali, P., Jurgens, C., Guido, W. and Mason, C.
(2013). ClearT: a detergent- and solvent-free clearing method for neuronal and non-neuronal tissue. Development140, 1364-1368.
Kwan, K. M., Fujimoto, E., Grabher, C., Mangum, B. D., Hardy, M. E., Campbell, D. S., Parant, J. M., Yost, H. J., Kanki, J. P. and Chien, C. B.(2007). The Tol2kit: a multisite gateway-based construction kit for Tol2 transposon transgenesis constructs. Dev. Dyn.236, 3088-3099.
Lavker, R. M., Tseng, S. C. and Sun, T. T.(2004). Corneal epithelial stem cells at the limbus: looking at some old problems from a new angle. Exp. Eye Res.78, 433-446.
Lichtman, J. W., Livet, J. and Sanes, J. R.(2008). A technicolour approach to the connectome. Nat. Rev. Neurosci.9, 417-422.
Livet, J., Weissman, T. A., Kang, H., Draft, R. W., Lu, J., Bennis, R. A., Sanes, J. R. and Lichtman, J. W.(2007). Transgenic strategies for combinatorial expression of fluorescent proteins in the nervous system. Nature450, 56-62.
Majo, F., Rochat, A., Nicolas, M., Jaoudé, G. A. and Barrandon, Y.(2008). Oligopotent stem cells are distributed throughout the mammalian ocular surface. Nature456, 250-254.
Meeker, N. D., Hutchinson, S. A., Ho, L. and Trede, N. S.(2007). Method for isolation of PCR-ready genomic DNA from zebrafish tissues. Biotechniques43, 610, 612, 614.
Megason, S. G.(2009). In toto imaging of embryogenesis with confocal time-lapse microscopy. Methods Mol. Biol.546, 317-332.
Mosimann, C., Kaufman, C. K., Li, P., Pugach, E. K., Tamplin, O. J. and Zon, L. I.(2011). Ubiquitous transgene expression and Cre-based recombination driven by the ubiquitin promoter in zebrafish. Development138, 169-177.
Mueller, T. and Wullimann, M. F.(2003). Anatomy of neurogenesis in the early zebrafish brain. Brain Res. Dev. Brain Res.140, 137-155.
Nagasaki, T. and Zhao, J.(2003). Centripetal movement of corneal epithelial cells in the normal adult mouse. Invest. Ophthalmol. Vis. Sci.44, 558-566.
Pan, Y. A., Livet, J., Sanes, J. R., Lichtman, J. W. and Schier, A. F.(2011). Multicolor Brainbow imaging in zebrafish. Cold Spring Harb. Protoc.2011, pdb.prot5546.
Pan, Y. A., Choy, M., Prober, D. A. and Schier, A. F.(2012). Robo2 determines subtype-specific axonal projections of trigeminal sensory neurons. Development139, 591-600.
Sagasti, A., Guido, M. R., Raible, D. W. and Schier, A. F.(2005). Repulsive interactions shape the morphologies and functional arrangement of zebrafish peripheral sensory arbors. Curr. Biol.15, 804-814.
Schneider, C. A., Rasband, W. S. and Eliceiri, K. W.(2012). NIH Image to ImageJ: 25 years of image analysis. Nat. Methods9, 671-675.
Scott, E. K. and Baier, H.(2009). The cellular architecture of the larval zebrafish tectum, as revealed by gal4 enhancer trap lines. Front. Neural Circuits3, 13.
Scott, E. K., Mason, L., Arrenberg, A. B., Ziv, L., Gosse, N. J., Xiao, T., Chi, N. C., Asakawa, K., Kawakami, K. and Baier, H.(2007). Targeting neural circuitry in zebrafish using GAL4 enhancer trapping. Nat. Methods4, 323-326.
Shaner, N. C., Steinbach, P. A. and Tsien, R. Y.(2005). A guide to choosing fluorescent proteins. Nat. Methods2, 905-909.
Shaner, N. C., Lin, M. Z., McKeown, M. R., Steinbach, P. A., Hazelwood, K. L., Davidson, M. W. and Tsien, R. Y.(2008). Improving the photostability of bright monomeric orange and red fluorescent proteins. Nat. Methods5, 545-551.
Shilatifard, A.(2006). Chromatin modifications by methylation and ubiquitination: implications in the regulation of gene expression. Annu. Rev. Biochem.75, 243-269.
Snippert, H. J., van der Flier, L. G., Sato, T., van Es, J. H., van den Born, M., Kroon-Veenboer, C., Barker, N., Klein, A. M., van Rheenen, J., Simons, B. D. et al.(2010). Intestinal crypt homeostasis results from neutral competition between symmetrically dividing Lgr5 stem cells. Cell143, 134-144.
Soules, K. A. and Link, B. A.(2005). Morphogenesis of the anterior segment in the zebrafish eye. BMC Dev. Biol.5, 12.
Sun, T. T., Tseng, S. C. and Lavker, R. M.(2010). Location of corneal epithelial stem cells. Nature463, E10-E11.
Tabansky, I., Lenarcic, A., Draft, R. W., Loulier, K., Keskin, D. B., Rosains, J., Rivera-Feliciano, J., Lichtman, J. W., Livet, J., Stern, J. N. et al.(2013). Developmental bias in cleavage-stage mouse blastomeres. Curr. Biol.23, 21-31.
Teddy, J. M., Lansford, R. and Kulesa, P. M.(2005). Four-color, 4-D time-lapse confocal imaging of chick embryos. Biotechniques39, 703-710.
Tesson, L., Rémy, S., Ménoret, S., Usal, C. and Anegon, I.(2010). Analysis by quantitative PCR of zygosity in genetically modified organisms. Methods Mol. Biol.597, 277-285.
Thermes, V., Grabher, C., Ristoratore, F., Bourrat, F., Choulika, A., Wittbrodt, J. and Joly, J. S.(2002). I-SceI meganuclease mediates highly efficient transgenesis in fish. Mech. Dev.118, 91-98.
Tu, S. and Johnson, S. L.(2011). Fate restriction in the growing and regenerating zebrafish fin. Dev. Cell20, 725-732.
Vastenhouw, N. L. and Schier, A. F.(2012). Bivalent histone modifications in early embryogenesis. Curr. Opin. Cell Biol.24, 374-386.
Villefranc, J. A., Amigo, J. and Lawson, N. D.(2007). Gateway compatible vectors for analysis of gene function in the zebrafish. Dev. Dyn.236, 3077-3087.
Walsh, C. and Cepko, C. L.(1992). Widespread dispersion of neuronal clones across functional regions of the cerebral cortex. Science255, 434-440.
Weissman, T. A., Sanes, J. R., Lichtman, J. W. and Livet, J.(2011). Generating and imaging multicolor Brainbow mice. Cold Spring Harb. Protoc.2011, 763-769.
Westerfield, M.(2000). The Zebrafish Book. A Guide for the Laboratory Use of Zebrafish (Danio rerio). Eugene, OR: University of Oregon Press.
Wullimann, M. F.(2009). Secondary neurogenesis and telencephalic organization in zebrafish and mice: a brief review. Integr Zool4, 123-133.
Zhao, X. C., Yee, R. W., Norcom, E., Burgess, H., Avanesov, A. S., Barrish, J. P. and Malicki, J.(2006). The zebrafish cornea: structure and development. Invest. Ophthalmol. Vis. Sci.47, 4341-4348.
Zupanc, G. K., Hinsch, K. and Gage, F. H.(2005). Proliferation, migration, neuronal differentiation, and long-term survival of new cells in the adult zebrafish brain. J. Comp. Neurol.488, 290-319.