Camp, Joanne and Karmiloff-Smith, Annette and Thomas, Michael S.C.
and Farran, E. (2016) Cross-syndrome comparison of real-world executive
functioning and problem solving using a new problem-solving questionnaire.
Research in Developmental Disabilities 59 , pp. 80-92. ISSN 0891-4222.
Downloaded from:
Usage Guidelines:
Please refer to usage guidelines at or alternatively
Author’s accepted manuscript
© 2016. This manuscript version is made available under the CC-BY-NC-ND 4.0 license http://creativecommons.org/licenses/by-nc-nd/4.0/
Link to publication: http://dx.doi.org/10.1016/j.ridd.2016.07.006
Cross-syndrome comparison of real-world executive functioning and problem solving using a new problem-solving questionnaire
Joanne S. Campa, c, Annette Karmiloff-Smithb, Michael S. C. Thomasb, Emily K. Farrana
aPsychology and Human Development, UCL Institute of Education
University College London, 25 Woburn Square, London WC1H 0AA
bCentre for Brain and Cognitive Development
Department of Psychological Sciences, Birkbeck, Malet Street
London WC1E 7HX
cPresent address: Department of Psychology, School of Psychology and Clinical Language
Sciences, University of Reading, RG6 7BE, UK
Corresponding author: J. S. Camp
Department of Psychology,
School of Psychology and Clinical Language Sciences, University of Reading,
Abstract
Background. Individuals with neurodevelopmental disorders like Williams syndrome and
Down syndrome exhibit executive function impairments on experimental tasks (Lanfranchi, Jerman, Dal Pont, Alberti, & Vianello, 2010; Menghini, Addona, Costanzo, & Vicari, 2010), but the way that they use executive functioning for problem solving in everyday life has not
hitherto been explored. The study aim is to understand cross-syndrome characteristics of everyday executive functioning and problem solving.
Methods. Parents/carers of individuals with Williams syndrome (n=47) or Down syndrome (n=31) of a similar chronological age (m =17 years 4 months and 18 years respectively) as
well as those of a group of younger typically developing children (n=34; m=8 years 3
months) completed two questionnaires: the Behavior Rating Inventory of Executive Function (BRIEF; Gioia, Isquith, Guy, & Kenworthy, 2000) and a novel Problem-Solving
Questionnaire.
Results. The rated likelihood of reaching a solution in a problem solving situation was lower
for both syndromic groups than the typical group, and lower still for the Williams syndrome group than the Down syndrome group. The proportion of group members meeting the criterion for clinical significance on the BRIEF was also highest for the Williams syndrome
group. While changing response, avoiding losing focus and maintaining perseverance were important for problem-solving success in all groups, asking for help and avoiding becoming
emotional were also important for the Down syndrome and Williams syndrome groups respectively. Keeping possessions in order was a relative strength amongst BRIEF scales for the Down syndrome group.
while for individuals with Williams syndrome, emotional reactions disrupt their problem-solving skills. This paper highlights the importance of identifying syndrome-specific
problem-solving strengths and difficulties to improve effective functioning in everyday life.
Keywords
Problem solving, Executive functioning, Everyday life, Williams syndrome, Down syndrome
Highlights
Parents/carers rated problem solving for individuals with Williams and Down
syndromes
Solution reaching likelihood was lower in Williams syndrome than in Down
syndrome
Help seeking was only associated with solution reaching in Down syndrome
Emotional reactions may disrupt problem-solving in Williams syndrome
Real-world executive functioning difficulty levels were high in Williams
syndrome
What this paper adds
This is the first cross-syndrome comparison of everyday executive functioning and problem solving in Williams and Down syndrome. Asking for help was uniquely associated with
reaching the solution for the Down syndrome group, pointing to the utility of this strategy for this group when solving problems. Their propensity for keeping possessions in order
(measured by the BRIEF) played a large part in differentiating them from the other two
Cross-syndrome comparison of real-world executive functioning and problem solving
using a new problem-solving questionnaire
1. Introduction
Problem solving is a ubiquitous part of life, whether it involves moving house or choosing lunch: in short, whenever there is a goal to be reached. Goal-directed behaviour relies on executive functioning. Whilst problem solving and executive functioning have been well
investigated experimentally, much less is known about them in the context of everyday life.
One of the groups of society perhaps most in need of support with everyday activities are individuals with intellectual disabilities. Williams syndrome (WS) and Down syndrome (DS) are two genetic neurodevelopmental disorders with a similar level of overall cognitive
impairment but different cognitive profiles. Both groups struggle with everyday
independence. While their executive and adaptive functioning have begun to be investigated
(e.g., Carney, Brown, & Henry, 2013; Pennington, Moon, Edgin, Stedron, & Nadel, 2003), little (if anything) is known about their problem-solving skills. In this study we address these gaps in the literature by collecting parent reports of everyday executive functioning and
problem solving for groups of adolescents and young adults with WS or DS, and comparing them to parental ratings for typically developing children using a cross-syndrome
comparison.
Everyday independence for individuals with WS and DS has been addressed in existing
individuals aged between 11 and 19 years (Pennington et al., 2003) as well as in several longitudinal interview studies with parents/carers of individuals with DS, aged between 15
months and 40 years (Carr, 2008). Carr noted that, at age 40, 53% of the group were not allowed outside the garden alone and 69% were not left alone at home for more than an hour.
Of 34 participants, 11 had become lost at some point, and on some of these occasions had been escorted home by police after a failed public transport journey. Regarding WS, 92% of a sample of 92 adults aged 19-55 years either lived with their parents/carers or in residential
care (Elison, Stinton, & Howlin, 2010). Most could perform self-care tasks with little or no help (77%) but could not carry out household chores (59%). Almost half did not travel
independently (49%). In another study. Rhodes, Riby, Park, Fraser and Campbell (2010) report that their sample of 11 individuals with WS all scored within the abnormal range (T > 60) for at least two of the four indexes of the Conners Parent Rating Scale (Conners, 1997).
Patterns of responses on the Strengths and Difficulties Questionnaire (SDQ; Goodman, 2001) was similar, with ten out of 11 achieving a total difficulty score that was in the abnormal
range and the remaining participant achieving a borderline score. To take the failed public transport journeys described by Carr (2008) as a case in point, it is reasonable to attribute this to a failure in the problem-solving process. The everyday difficulties often experienced by
both groups clearly warrant further investigation, with respect to problem solving. By
conducting a cross-syndrome comparison of real-life problem-solving skills, this study allows
conclusions to be drawn about syndrome specificity between WS and DS as well considering abilities in comparison to typically developing individuals.
1.1 Problem solving
Psychological problem-solving research is rooted in cognitive science and neuropsychology.
goal state, operators (moves) and constraints. For example, in the Tower of London (TOL) task (Shallice, 1982), three beads are moved between three posts in order to match a goal
state, whilst certain rules are followed, including only moving one piece concurrently. Such laboratory tasks are well-controlled and abstract, facilitating examination of each
problem-solving step from start to finish.
However, problem characteristics change when we shift focus from a well-controlled testing
situation to the less predictable everyday world. A distinction drawn in the literature is between ‘well-defined’ tasks like the TOL, and ‘ill-defined’ problems (Reitman, 1965). In an
ill-defined problem, the solver may not initially possess all the necessary information: that is, the goal state, operators or constraints might be ambiguous, or there could be more than one correct solution (Kahney, 1986; Pretz, Naples, & Sternberg, 2003). Ill-defined problems are
more likely to be encountered in everyday life than in the laboratory (Dunbar, 1998). The public transport journey scenario above (Carr, 2008) is one instance of an ill-defined
problem: consider, for example, if the bus were to break down, presumably, one’s goal would change from reaching a particular destination to simply getting somewhere safely. This is one example of how everyday problems are more complex and demanding than the types of
problems which are generally investigated in experimental settings.
Ill-defined problem solving is less well understood, and has received less attention, than well-defined problem solving (Dunbar, 1998; Reed, 2015). Although some tests exist that measure performance on tasks resembling the real world, such as the Multiple Errands Test (Shallice
of an individual’s patterns of responding must, by definition, be lost to the structure provided
by the test. One method of sidestepping this issue is by asking directly about individuals’
problem solving in their own everyday lives. In this paper, we address real-life problem solving from a parental perspective. We ask how individuals’ responses to situations in which
a difficulty is encountered with an everyday task relate to their ability to solve such a problem.
1.2 Executive functioning
A concept closely related to problem solving is that of executive functioning (EF). Problem
solving, or goal-directed behaviour, relies on a collection of lower-level EFs (e.g., Banich, 2009). EFs include inhibition, attention shifting and working memory (e.g., Miyake et al., 2000), which work together to guide our actions towards a goal. EFs are mainly attributed to
activation of the prefrontal cortex (PFC; see Jurado & Rosselli, 2007) which undergoes a slow, gradual period of development (O’Hare & Sowell, 2008, cited in Best & Miller, 2010).
In typically developing (TD) children, different EFs develop at different rates over the lifespan, with inhibition emerging relatively early, while more complex EF skills, such as shifting, develop later (e.g., Best & Miller, 2010; Carlson, 2005).
In experimental tasks, EFs are impaired in both WS and DS in relation to chronological age
(CA) and, sometimes, to mental age (MA) expectations (Carney et al., 2013; Costanzo et al., 2013; Lanfranchi, Jerman, Dal Pont, Alberti, & Vianello, 2010; Menghini, Addona,
Costanzo, & Vicari, 2010; Pennington et al., 2003; Rhodes et al., 2010). Costanzo et al.
EF measures. The WS group scored more poorly on the Tower of London task than the other two groups. Both atypical groups scored more poorly than controls on a variety of measures.
The WS group outperformed the DS group on both verbal memory tasks and nonword repetition, on the Stroop task, and on one verbal and one visuospatial shifting measure (with
the remaining visuospatial shifting measure showing equivalent WS/DS performance), while no group differences were seen for visuospatial inhibition. Therefore, syndrome-specific findings have been identified in experimental EF settings.
However, the importance of considering real-world EFs has also been recognised. Whilst
acknowledging some association between laboratory and everyday EF measures, the ecological validity of experimental EF tasks has been called into question with respect to their generalisability and representativeness (Burgess, Alderman, Evans, Emslie, & Wilson,
1998; Burgess et al., 2006). Indeed, experimental EF tests and everyday EF rating scales are thought to tap different processes (Toplak, West, & Stanovich, 2013). Although the way in
which EFs contribute to higher level processes has been addressed experimentally (e.g., Bull, Espy, & Senn, 2004; Phillips, Wynn, McPherson, & Gilhooly, 2001; Unterrainer et al., 2004), there is a gap in the literature concerning how everyday EFs might be used for goal-directed
behaviour in an everyday context. Furthermore, although EF comparisons between WS and DS groups have been conducted experimentally, the two groups’ everyday ratings of EF have
not previously been compared.
The Behavioural Rating Inventory of Executive Function (BRIEF; Gioia, Isquith, Guy, &
are obtained on eight EF scales (Inhibit; Shift; Emotional Control; Working Memory; Plan/Organize; Organization of Materials; Monitor; Initiate), which combine to produce two
indices: the Behavioral Regulation Index (BRI) and the Metacognition Index (MI). Small numbers of studies have employed the BRIEF with WS or DS groups. John and Mervis
(2010) demonstrated that children with WS aged 6-10 years with greater sensory impairment, measured by the Short Sensory Profile (SSP: McIntosh, Miller, Shyu, & Dunn, 1999), had more severe scores on six out of eight BRIEF scales than those with lower sensory
impairments. Woodruff-Borden, Kistler, Henderson, Crawford, and Mervis (2010)
investigated anxiety and EF as measured by the BRIEF: while children with WS with and
without an additional diagnosis of an anxiety disorder scored equivalently on the
Metacognition Index (MI) of the BRIEF, the group without anxiety disorder diagnoses scored better on the Behavioral Regulation Index (BRI) than those children who had received a
diagnosis. In the DS literature, the BRIEF (Preschool version) was used in just one study, with parents/carers of children aged 4-10 years. Lee et al. (2011) calculated standardised
scores on the basis of mental age (MA). Relative to these MA-based TD norms, the Working Memory and Plan/Organize scales were impaired for the DS group, but not the Inhibitory self-control and Flexibility indices.
In summary, whilst some progress has been made in investigating everyday EFs, little is
known about how individuals approach real-life, everyday problem solving/ goal-directed behaviour in typical development or in atypical development. Parental questionnaires provide an efficient way of gaining insight into an individual’s functioning. Thus, we have designed a
new parental questionnaire for the purpose of understanding real-world problem solving in TD children and in individuals with neurodevelopmental disorders. By investigating and
success or failure on a task for these groups. In addition, by gathering parallel ratings of individuals’ everyday EF abilities, using the BRIEF, we aim to not only address the gap in
the literature of an ecologically valid cross-syndrome comparison of EF in WS and DS, but to address whether and how everyday EFs relate to everyday problem solving success.
The aims of the present study were to:
1) Conduct a cross-syndrome comparison of real-world EF ratings across WS, DS and
TD groups;
2) Compare parental ratings of real-life problem-solving success in individuals with WS
and DS, compared to TD children;
3) Identify how responses to a problem-solving task by individuals with WS and DS
might relate to their success or failure on the task, as judged by parents and in
comparison to patterns in typical development;
4) Examine whether and how EFs might be used for problem solving in WS, DS and TD
participants.
2. Method and materials
2.1 Participants
The project gained ethical approval from the Institute of Education. Respondents were 78
parents/carers of a son or daughter with either WS or DS, and 34 parents/carers of TD children. The sons/daughters of the respondents are hereafter referred to as participants. Parents/carers of individuals with WS or DS were either recruited through the Williams
children were recruited through a primary school in Greater London. Chronological age (CA) and demographic characteristics are displayed in Table 1.
Table 1
Participant Demographics
Note. CA = chronological age. TD = typically developing. DS = Down syndrome. WS = Williams syndrome.
We recruited a typically developing sample who were likely to be at a similar stage to our
WS and DS groups in terms of acquiring everyday problem-solving abilities. This was based on knowledge (e.g., Joffe & Varlokosta, 2007) that mental age in DS and WS is typically half
their CA. The groups differed significantly in terms of chronological age (CA; F(2,109) = 79.047, p <. 001, partial η2 = .592), with the WS and DS groups being of equivalent age (p =
.787) while the TD group were younger than each atypical group (p < .001 for both). As the DS group’s CA was below 30 years, they were unlikely to have been showing signs of
early-onset dementia (cf., Lott & Head, 2001). Group
CA (y:m)
n
male:
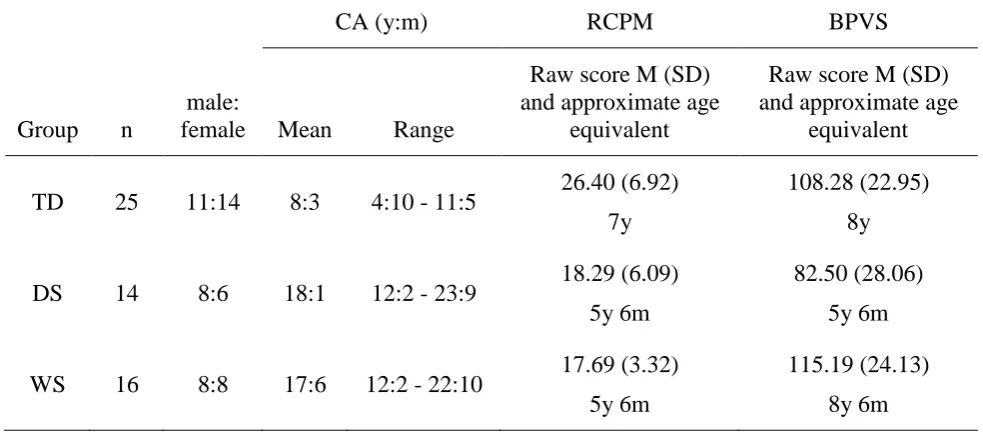
Two parents/carers (one DS; one WS) only completed the PSQ, giving n=30 (DS) and n=46 (WS) for the BRIEF. For a subset of participants (n=55), background data were also available
regarding their cognitive ability because they had taken part in a wider investigation of problem solving in atypical development (Camp, 2014). For this subset, nonverbal ability was measured using the Raven’s Coloured Progressive Matrices (Raven, 2004) and receptive
[image:14.595.64.556.402.620.2]vocabulary using the British Picture Vocabulary Scale, 3rd edition (Dunn et al., 2009). These data are presented in Table 2.
Table 2
Demographics of participant subset providing mental age data
Note. RCPM = Raven’s Coloured Progressive Matrices; BPVS = British Picture Vocabulary Scale.
The BPVS raw score differed significantly across the groups (F(2,52) = 7.346, p = .002,
partial η2 = .220) with poorer scores for the DS group compared to each of the other groups Group
CA (y:m) RCPM BPVS
n
male:
female Mean Range
Raw score M (SD) and approximate age
equivalent
Raw score M (SD) and approximate age
equivalent
TD 25 11:14 8:3 4:10 - 11:5 26.40 (6.92) 7y
108.28 (22.95) 8y
DS 14 8:6 18:1 12:2 - 23:9 18.29 (6.09) 5y 6m
82.50 (28.06) 5y 6m
WS 16 8:8 17:6 12:2 - 22:10 17.69 (3.32) 5y 6m
(WS: p = .006; TD: p = .020), while the WS and TD groups’ scores were equivalent (p = .637). Scores on the RCPM were also reliably different across groups (F(2,52) = 14.061, p <
.001, partial η2 = .351), this time due to the poorer performance of each atypical group
compared to the TD group (DS: p = .002; WS: p < .001), while the DS and WS scores did not
differ significantly (p = .943). The age ranges of this subset of participants for whom BPVS and RCPM data are available is broadly similar to that of the entire questionnaire group. Thus we assume that the RCPM and BPVS scores are representative of the larger sample. 1
Development and rationale of the PSQ
The PSQ asks parents/carers about seven specific scenarios that their children might encounter in everyday life. Parents/carers at a Williams Syndrome Foundation convention were consulted during the design phase, suggesting difficulty with tidying bedrooms as a
particular problem in WS, which was included as one of the scenarios. Tooth brushing was included for the same reason with respect to the DS group, based on a suggestion from a
practitioner involved with individuals with DS.
Tasks encountered in everyday life will, by nature, involve some familiarity and routine,
while in contrast, problems to be solved in experimental work are generally novel. These tasks which are novel require greater attentional and/or executive resources than routine tasks
(Rabbitt, 1997; Shallice & Burgess, 1991). Thus, we addressed performance on everyday routine problems as well as their more novel counterparts. PSQ scenarios were classified as novel if they included a variable element. For example, when packing a bag for the day, what
should be packed would vary depending on the planned activities, the weather, etc. (in
1 The overall patterns for group comparisons for the BRIEF and PSQ scores were verified to hold for the subset
contrast, brushing one’s teeth would generally follow a more predictable pattern and was
classed as a routine problem). We asked for a report of an individual’s response when
something goes wrong with the task (based on Beck, 2011, personal communication). For example, in the ‘Putting items away’ scenario, we asked for ratings of how likely the participant would be to react in certain ways to “If something goes wrong (for example a drawer will not close)”. In this way, even for the routine tasks, there is a non-routine problem
to be solved.
2.2 Design and Procedure
Parents/carers completed two questionnaires (Camp, 2014): the Behavioral Rating Inventory of Executive Function (BRIEF; Gioia et al., 2000) and our novel Problem-Solving
Questionnaire (PSQ).
2.3 Measures
Behavioural Rating Inventory of Executive Functioning (BRIEF)
The BRIEF (Gioia et al., 2000) is a standardised questionnaire (aged 5-18 years) which examines EF in everyday life across eight scales: Inhibit, Shift (being flexible in the
allocation of attention), Emotional Control, Working Memory, Plan/Organize, Organization of Materials (keeping possessions in order), Monitor (keeping track of one’s own
performance and behaviour), and Initiate (producing ideas or starting an activity). In the Parent version of the BRIEF, for each of 86 item statements, parents/carers select whether the particular behaviour described has Never, Sometimes or Often been a problem for their child,
(the Behavioral Regulation Index; BRI and the Metacognition Index; MI) which combine again to produce the Global Executive Composite (GEC) measure of executive functioning.
Problem-Solving Questionnaire (PSQ)
The PSQ (see Camp, 2014) included seven questions for parents/carers about how their child approached and responded to routine (four questions) and novel (three questions) problem-solving situations. The routine questions covered: Getting dressed; Brushing teeth; Making a
sandwich; Making a telephone call. The novel questions targeted: Finding a lost possession; Packing a bag for the day; Putting items away in a wardrobe/chest of drawers. First,
parents/carers rated how easy their child found it to deal with different aspects of a scenario (such as doing steps in the right order). Then, five possible responses of the child to a problem with the task were listed and parents/carers gave a rating ranging from 1 (very
likely) to 5 (very unlikely) to each action that they thought their child would most likely do. Due to space limitations, this ‘response’ section of the questionnaire is focused on here. The
responses were common to every scenario: Change what they have been doing in response to the problem; Ask for help; Become Emotional; Lose Focus; Stop their efforts through lack of perseverance. Hereafter the responses are referred to in abbreviated form (Change; Ask;
Become Emotional; Lose Focus; Lack Perseverance). Parents/carers also rated how likely their child was to ultimately Reach the solution to the problem, using the same rating scale.
2.4 Data handling
Scoring
For each statement, ratings of ‘Never’, ‘Sometimes’ and ‘Often’ on the BRIEF score 1, 2 and
3 points respectively. The eight scales comprise different numbers of statements, so mean statement scores were calculated for each scale, for each participant, to facilitate comparison.
The sum of the scores for each scale was also used to calculate standard scores for the Global Executive Composite (GEC) BRIEF measure. The GEC provides a total score on the BRIEF as a T score, standardised around a mean of 50 and a standard deviation of 10, with a cut-off
for potential clinical significance of 65. For the purpose of obtaining T scores, the maximum standardised age (18 years) was assigned to the participants who were older than this. While acknowledging Gioia and colleagues’ cautionary note regarding calculating the GEC when
there are discrepancies between indices (sums of scales), the GEC was nevertheless calculated in order to produce a percentage of each group that would meet the cut-off for
potential clinical significance. For two of the participants with WS, the GEC was so high (i.e., executive functioning so poor) that it was beyond the reference table of the BRIEF
manual. In these cases, the highest raw score from the table was used.
Missing data
The BRIEF, aimed at individuals between 5 and 18 years of age, includes some items related to school life. Many of the atypically developing participants were older than 18 years. Thus,
parents/carers were asked to omit any items which they did not judge as relevant for their son/daughter. For this reason, more than 2 items were omitted on the Plan/Organize scale for 5 participants with DS (16.6% of the group), and 12 participants with WS (26.1%). Missing
and thus is a conservative approach to replacing missing data. Although the BRIEF
professional manual states that a scale score cannot be calculated should more than two items
from a scale be omitted, we considered our method the most suitable for the groups employed.
PSQ
Scoring
On the PSQ parents/carers were asked to choose one of five options best describing their child’s behaviour in response to a problem, on a scale of 1 (very likely) to 5 (very unlikely).
Scores were calculated from these responses, reversing where necessary so that a higher score
always indicated more proficient performance. In this way, higher scores were awarded when participants were rated as more likely to: Change their response to a problem; Ask for help; or Reach the solution, and when they were less likely to: Become Emotional; Lose Focus; or
give up through a Lack of Perseverance.
Missing data
On the PSQ, questions 3 and 4 (Making a sandwich; Making a telephone call) were answered less frequently than the others (73% and 82%, compared to > 98% of respondents for other
questions) predominantly because participants never attempted those activities. As such questions 3 and 4 were excluded from the PSQ analysis. The remaining questions (1, 2, 5, 6
2.4 Data analysis
Data not meeting the assumption of sphericity are reported according to the Greenhouse
Geisser correction. Post hoc tests for between-group comparisons are conducted using the Games-Howell test due to its suitability for unequal sample sizes (Field, 2009). As data can
be classified as Likert-style, which is associated with potential difficulties in using parametric analyses (Grace-Martin, 2008; Nevill & Lane, 2007), nonparametric analyses are also
reported where nonparametric outcomes differ from parametric analyses in terms of
significance.
Our analysis of data proceeds in three main parts. First, to address study aim (1), we will compare EF ratings on the BRIEF across TD, DS and WS groups. Aim (2) will be addressed by comparing parent-rated success on everyday problem solving across the groups, as
indicated by the PSQ. To target aims (3) and (4), correlations will be conducted: firstly, between types of responses to problems on the PSQ and the rated likelihood of reaching the
solution; and secondly, between EF scores on subscales of the BRIEF and reaching the solution on the PSQ.
3. Results
3.1 Executive Functioning in Everyday Life (the BRIEF)
______________________________________________________________________
Figure 1 about here
_______________________________________________________________________
As the GEC score comprises the sum of the eight BRIEF subscales, we have addressed group
differences on the BRIEF in the analysis below.
3.3.1 BRIEF subscale scores by group
_______________________________________________________________________
Figure 2 about here
_______________________________________________________________________
ANOVA of subscale scores was conducted with Group as the between-subjects variable (TD, DS, WS) and Scale as the within-subjects variable. The main effect of Group was significant
(F(2,107) = 52.141, p < .001, partial η2 = .494) with poorer performance in the WS group than the other two groups (p < .001 for each) and poorer DS than TD performance (p = .001).
The main effect of Scale was also significant (F(5.31,568.63) = 27.455, p < .001, partial η2 = .204), as was the Scale by Group interaction (F(10.63,568.63) = 5.966, p < .001, partial η2 = .100). Whilst WS performance was poorer than both DS and TD performance for every scale
(p <.05 for all), DS performance was only weaker than TD performance for Shift, Working
Memory, Plan/Organize, Monitor and Initiate scales (p <.05 for all). This reflected
differences in the profiles of scale across groups (main effects of scale: TD: F(4.57,150.64) = 18.384, p < .001, partial η2 = .358; DS: F(4.29,124.20) = 8.734, p < .001, partial η2 = .231; WS: F(5.08,228.38) = 15.870, p < .001, partial η2 = .261). Most noticeably, as shown in
group (p < .001 for all), but for the DS group, with the exception of Inhibit which received better ratings than Organization of Materials (p = .012), the Organization of Materials scale
was scored better (p < .05) or equivalent (p > .05) to every other scale (For the WS group, Organisation of Materials was poorer (p < .05) or equivalent (p > .05) to all other scales).
Thus, this could be a scale which reflects a particular strength in DS.
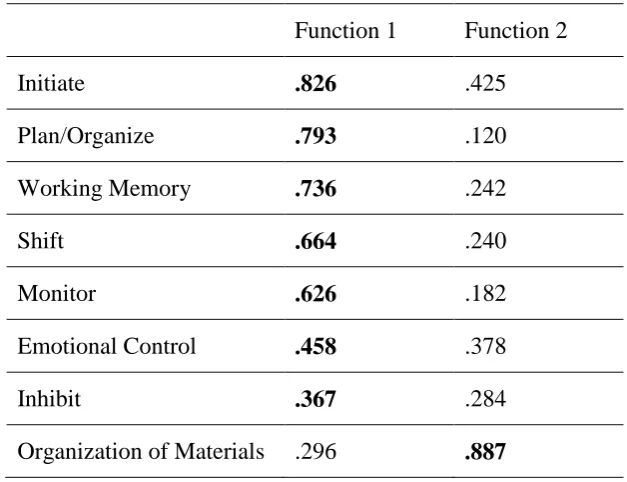
In order to establish whether the DS group’s pattern of performance was indeed different to
that of the TD and WS groups, Discriminant Function Analysis (DFA) was conducted on the BRIEF scale scores. Two functions were identified, explaining 84.9% and 15.1% of the
variance respectively (canonical R2 = .624; .228). Together, the functions successfully discriminated the groups (L = .290, X2(16) = 128.224, p < .001), as did function 2 after removing function 1 (L = .772, X2(7) = 26.771, p < .001). Whilst seven of the eight scales
loaded most highly onto function 1, the Organization of Materials scale had its highest loading on function 2. This suggests that this scale was indeed measuring a different
construct within the BRIEF scores compared to the other scales, which serves to partially explain the source of the interaction in the ANOVA. In Table 3, the highest correlation coefficients between the scale and the function for a scale are presented in bold type.
Table 3
Function 2 discriminated the DS group from the other two groups; function 1 discriminated
the TD group from the clinical groups. This is represented in Figure 3.
[image:23.595.140.454.104.345.2]_______________________________________________________________________
Figure 3 about here
_______________________________________________________________________
3.4 Problem solving in everyday life
For PSQ analyses, sample sizes were 34 (TD), 31 (DS) and 47 (WS). Function 1 Function 2
Initiate .826 .425
Plan/Organize .793 .120
Working Memory .736 .242
Shift .664 .240
Monitor .626 .182
Emotional Control .458 .378
Inhibit .367 .284
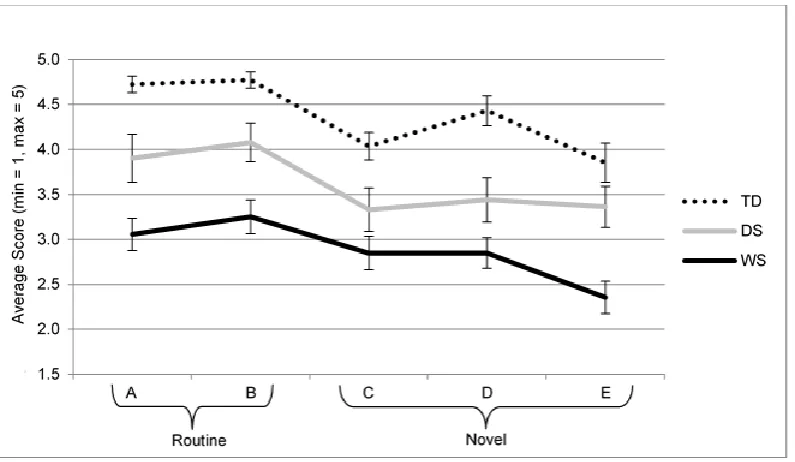
3.4.1 Reaching the Solution
Problem-solving success was indicated by how likely an individual was to Reach the solution
to a problem. Group means of these success scores by question are displayed in Figure 4.
_______________________________________________________________________
Figure 4 about here
_______________________________________________________________________
A Question (A, B, C, D, E) by Group (TD, DS, WS) ANOVA yielded a significant main effect of Group (F(2,109) = 36.474, p < .001, partial η2 = .401), with better TD than DS
scores (p = .001), better DS than WS scores (p = .001), and better TD than WS scores (p < .001). There was also a significant main effect of Question (F(4,436) = 13.504, p < .001, partial η2 = .110). For the two routine problems (getting dressed and brushing teeth), the
solution was reported as being reached with equal likelihood (p = .257). For novel problems, equal likelihood also applied to questions C (Finding a lost possession) and D (Packing a bag
for the day) (p = .155). Question E (Putting items away in a wardrobe/chest of drawers) also did not differ in significance from question C (p = .097) but was scored lower than question D (p = .003). Each routine problem attracted a better score than each novel problem (p < .05
for all). Question and Group did not interact (F<1).
3.4.2
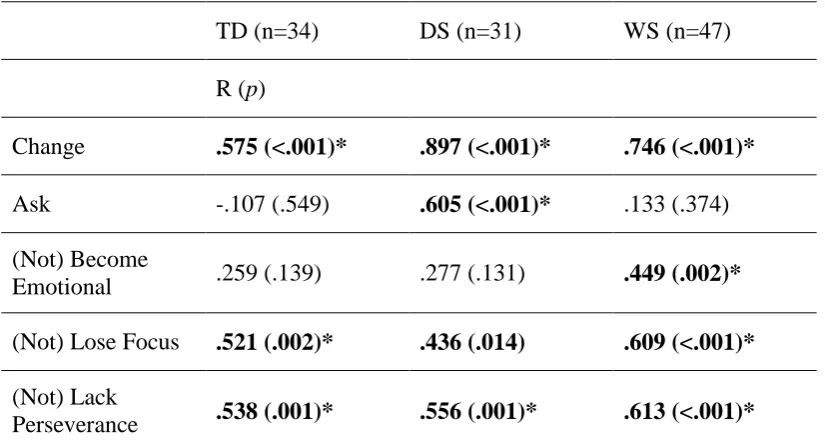
Relationships between Response types and Reaching the solutionCorrelations between each Response type and the reach-the-solution score were conducted in order to understand the reasons for success or otherwise with everyday problem solving. As
was broadly similar across questions A-E, scores were collapsed across question. Correlations are displayed in Table 4.
Table 4
Correlations between response type and rated likelihood of reaching the solution by group
TD (n=34) DS (n=31) WS (n=47)
R (p)
Change .575 (<.001)* .897 (<.001)* .746 (<.001)*
Ask -.107 (.549) .605 (<.001)* .133 (.374) (Not) Become
Emotional .259 (.139) .277 (.131) .449 (.002)* (Not) Lose Focus .521 (.002)* .436 (.014) .609 (<.001)*
(Not) Lack
Perseverance .538 (.001)* .556 (.001)* .613 (<.001)*
Note. Pearson’s correlations (r, with p value in parentheses). TD = typical development; DS = Down
syndrome; WS = Williams syndrome. Significant correlations are presented in bold type. Correlations surviving a Bonferroni correction (α = .003) are marked with an asterisk*.
Table 4 indicates that significant correlations hold between reaching the solution and:
Changing their response, not Losing Focus and not giving up (through Lack of Perseverance)
for all groups. However, the (Not) Become Emotional correlation with reaching the solution only reaches significance for the WS group, while the Ask for help correlation only reaches
Becoming Emotional and between reaching the solution and Asking for Help. For (Not) Becoming Emotional, neither the difference between the TD and WS group’s correlations (p = .352) or between the WS and DS group’s correlations (p = .512) reached significance. For
Asking for help, the difference between the DS and TD group’s correlations (p = .006) and between the DS and WS group’s correlations (p = .019) both reached significance: thus, the DS group’s correlation between Asking for help and reaching the solution was significantly
stronger than that of the other groups.
3.5 Correlations between Executive Functions and Reaching the Solution
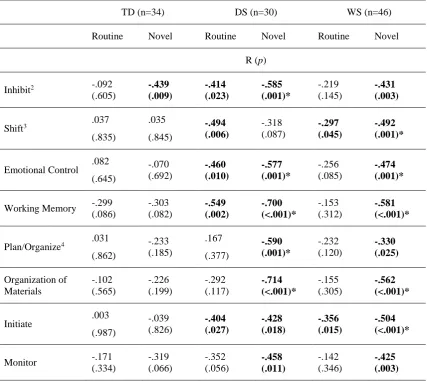
As novel problems are recognised as drawing on more EFs than routine tasks (Rabbitt, 1997) correlations were conducted between each scale score on the BRIEF and the likelihood of reaching the solution, collapsed across routine and novel problems separately, because the
Table 5
Correlations between BRIEF scale scores and rated likelihood of reaching the solution score
on the PSQ for routine and novel problems,
TD (n=34) DS (n=30) WS (n=46)
Routine Novel Routine Novel Routine Novel
R (p)
Inhibit2 -.092
(.605) -.439 (.009) -.414 (.023) -.585 (.001)* -.219 (.145) -.431 (.003)
Shift3 .037
(.835) .035 (.845) -.494 (.006) -.318 (.087) -.297 (.045) -.492 (.001)*
Emotional Control .082 (.645) -.070 (.692) -.460 (.010) -.577 (.001)* -.256 (.085) -.474 (.001)*
Working Memory -.299 (.086) -.303 (.082) -.549 (.002) -.700 (<.001)* -.153 (.312) -.581 (<.001)*
Plan/Organize4 .031
(.862) -.233 (.185) .167 (.377) -.590 (.001)* -.232 (.120) -.330 (.025) Organization of Materials -.102 (.565) -.226 (.199) -.292 (.117) -.714 (<.001)* -.155 (.305) -.562 (<.001)*
Initiate .003 (.987) -.039 (.826) -.404 (.027) -.428 (.018) -.356 (.015) -.504 (<.001)*
Monitor -.171 (.334) -.319 (.066) -.352 (.056) -.458 (.011) -.142 (.346) -.425 (.003)
Note. Pearson’s correlations (r, with p value in parentheses). TD = typical development; DS = Down syndrome;
WS = Williams syndrome. Significant correlations are presented in bold type. Correlations surviving a
Bonferroni correction (α = .001) are marked with an asterisk*.
2 The Inhibit, Routine correlation for the DS group did not reach significance for a Spearman’s correlation,
conducted due to Likert-style data (r = -.316, p = .089).
3 The Shift, Routine correlation for the WS group did not reach significance for a Spearman’s correlation,
conducted due to Likert-style data (r = -.268, p = .072).
4 The Plan/Organize, Novel correlation for the WS group did not reach significance for a Spearman’s
Table 5 indicates that significant relationships between parent-rated EFs and reaching the solution to a problem-solving task are present more often for individuals with DS and WS
than for TD children (on 12 and 10 out of 16 possible correlations respectively, compared to only one for the TD sample). In total, 16 correlations for novel problems were significant,
compared to 7 correlations for routine problems. Even with the risk of Type 1 errors, this discrepancy between typical and atypical groups is notable.
4. Discussion
The aims of the study were to compare ratings of real-world EF and problem solving across
WS, DS and TD groups, to ascertain potential mechanisms for success or failure on everyday problem-solving tasks, and to establish whether and how EFs were drawn on for everyday
problem solving in these groups. Parents/carers of individuals with WS or DS and parents/carers of TD children completed the BRIEF (Gioia et al., 2000) and the newly developed Problem-Solving Questionnaire (PSQ) as part of a wider study investigating
problem-solving abilities in typical and atypical development.
Compared to the DS group, the parents/carers of the individuals with WS rated them as less likely to reach the solution on the PSQ, and as showing greater executive difficulties on the BRIEF (as indicated both by the significantly poorer BRIEF scores as well as the high
percentage of group members meeting the criterion for clinical significance on the BRIEF). For both clinical groups, ratings on both measures were poorer than ratings for a group of TD
children some nine years younger on average. This not only points to impairments on
to a DS group of a similar age and nonverbal cognitive ability (as indicated by the equivalent RCPM score). To the best of our knowledge this is the first study to compare ratings of
everyday problem-solving and executive functioning for WS and DS groups.
The better DS than WS ratings are consistent with the adaptive functioning literature (pertaining to everyday life skills including daily living skills, socialisation and
communication). Whilst adaptive functioning is below CA expectations in both WS and DS
groups (e.g., Greer, Brown, Pai, Choudry, & Klein, 1997), and poor in WS in relation to full-scale IQ (Howlin, Elison, Udwin, & Stinton, 2010), Pennington et al. (2003) found that it
compared favourably to mental age (MA) in children with DS, measured using the school age version of the Differential Abilities Scale (Elliott, 1990). Interestingly, the better BRIEF and PSQ scores for the DS group occurred even though the nonverbal ability (RCPM) measures
for the subsets were equivalent. This suggests that nonverbal ability indexed by the RCPM scores did not account for the differences in real-world ratings. As the vocabulary of the WS
group was larger than that of the DS group and comparable to that of the TD group, their poor parental ratings serve to highlight the gulf between their vocabulary and problem-solving skills. This is in line with previous descriptions of the uneven nature of the WS
cognitive profile (e.g., Mervis et al., 2000).
Keeping possessions in order (indicated by the Organization of Materials EF parental rating) was a relative strength for the DS group and played a strong role in differentiating the DS group from the other groups. Individuals with DS exhibit difficulties with flexible behaviour
Speculatively, keeping possessions in order could reflect a compensatory strategy for such difficulties.
As with any study of this kind, the subjective nature of indirect reporting measures should be
noted. This is a disadvantage of methods that nevertheless facilitate the gathering of information about the complex and ill-defined nature of the everyday world. This is a
pertinent consideration with regard to EF research. As noted in the Introduction, tasks which
measure EFs in experimental settings have been questioned in terms of their ecological validity (Burgess et al., 1998; 2006). In EF research, dual issues arise: first, of relying on
subjective questionnaire reports in order to index behaviour outside the laboratory, and second, of measuring abilities which may actually qualitatively differ between experimental and everyday contexts: indeed, Toplak et al. (2013) proposed them to be measuring different
constructs entirely.
Nevertheless, the relative difficulty of novel problems (compared to routine problems) was reflected in the parents/carers’ ratings: not only were solutions to novel problems judged as less likely to be reached, but ratings produced a greater number of correlations with BRIEF
EF scale scores, than for routine problems. This is consistent with the body of previous literature describing the greater EF demands of novel, than routine, tasks (e.g., Shallice &
Burgess, 1991; Stuss, 1992). Furthermore, reaching the solution to novel problems was only associated with several EF ratings for the clinical groups and not the typical children,
suggesting that EF was a limiting factor for reaching the solution to a problem for the clinical
DS groups placed solutions to some problems beyond their reach: hence, problem-solving abilities may have relied upon EF skills for these individuals. With the exception of the
Inhibit scale, the lack of significant association between EFs and novel problem solving in TD children is consistent with the findings of a recent study of tool innovation (Beck,
Williams, Cutting, Apperly, & Chappell, 2016). Interestingly, a role for episodic memory in ill-defined problem solving has been suggested (Sheldon et al., 2011; Vandermorris et al., 2013) which may prove to be a fruitful avenue for future research in this area.
Similarities across groups were revealed in the associations between response types and rated
likelihood of reaching the solution: namely, reaching the solution was significantly related to Changing their response, avoiding Losing Focus and avoiding giving up through a Lack of Perseverance for every group. Syndrome-specific differences also emerged: for the DS group
only, being rated as more likely to ask for help was reliably associated with being rated as more likely to reach the solution. Fidler, Philofsky, Hepburn, and Rogers (2005) noted a
similar association in DS, i.e., between the frequency of nonverbal requests for help from toddlers with DS on the Early Social Communication Scales (Mundy, Zigman, & Kasari, 1990) and the efficiency of their reaching strategy on an object retrieval task (while their DS
group exhibited fewer requests for help than MA-matched controls).
In contrast, avoiding becoming emotional was related to being more likely to reach the solution for the WS group alone, although the difference between the WS group’s correlation and that of the other two groups did not reach significance, and this should be taken into
Questionnaire (SDQ) and planning and attentional flexibility EF performance in WS. Woodruff-Borden et al. (2010) also found that children with WS who met the criteria for an
anxiety disorder on the Anxiety Disorders Interview Schedule (Silverman & Albano, 1996) scored more poorly on the BRIEF Behavioural Regulation Index (BRI) than children who did
not meet anxiety disorder criteria. Individuals with WS experience high levels of anxiety and fear, compared to both the general population and other groups with intellectual disabilities (Dykens, 2003; Leyfer, Woodruff-Borden, Klein-Tasman, Fricke, & Mervis, 2006; Leyfer,
Woodruff-Borden, & Mervis, 2009; Stinton, Elison, & Howlin, 2010). In the typical population, subclinical anxiety is known to disrupt goal-directed behaviour and attentional
control (e.g., Eysenck, Derakshan, Santos, & Calvo, 2007). Links between emotion and problem solving are not unique to WS (e.g., Eysenck and colleagues, above) but reduced problem-solving success in this group could be partly attributed to difficulties with emotional
processing.
5. Conclusions
Whilst we acknowledge the limitations in using parent ratings rather than observable behaviour, and in using a new non-standardised questionnaire, our findings have clear
implications for our expectations for problem solving of individuals with neurodevelopmental disorders. First, solving a problem is likely to be very difficult for individuals with DS and
WS, and something with which they are likely to need support. Second, problem solving will almost certainly be out of step with verbal abilities in WS, so these should not be used to judge an individual’s competencies. Individuals with DS could be relying on help seeking for
the previously established tendency of individuals with WS to become emotional may be impacting negatively on their problem-solving success. Thus, it may be that interventions
which work to help people to manage anxiety or other emotions are beneficial for problem-solving success.
In summary, this cross-syndrome comparison is the first to compare real-world parental ratings of executive functioning and problem solving across individuals with Williams
syndrome, Down syndrome and typically developing children. It employed a new measure to examine everyday problem solving, and parental ratings reflected the relative difficulty of novel problems compared to routine problems. Participants with Williams syndromes’
perceived likelihood to become emotional was linked to their judged problem-solving success, whilst this was uniquely true for the Down syndrome group for asking for help. The
very high percentage of individuals with WS meeting the criteria for clinical significance on the BRIEF reveals the huge difficulties that individuals are encountering. Moreover, their
problem-solving success was rated as less likely than that of the DS group, who may be able to use compensatory strategies such as keeping their possessions in order, to cope more effectively with everyday challenges.
Acknowledgements
This research was conducted as part of the PhD studies of the first author, funded by a Bloomsbury Colleges Scholarship. Thanks go to the Williams Syndrome Foundation, the Down Syndrome Association and Branfil Primary School, as well as to Sarah Beck for her
References
Banich, M. T. (2009). Executive Function: The Search for an Integrated Account. Current Directions in Psychological Science, 18, 89-94.
Beck, S. R., Williams, C., Cutting, N., Apperly, I. A., & Chappell, J. (2016). Individual differences in children's innovative problem-solving are not predicted by divergent thinking or executive functions. Philosophical Trnasactions of the Royal Society B,
371(1690), 20150190.
Best, J. R., & Miller, P. H. (2010). A Developmental Perspective on Executive Function.
Child Development, 81(6), 1641-1660. doi: 10.1111/j.1467-8624.2010.01499.x
Bruininks, R. K., Woodcock, R. W., Weatherman, R. F., & Hill, B. K. (1996). Scales of Independent Behavior-Revised (SIB-R). Itasca, IL: Riverside.
Bull, R., Espy, K. A., & Senn, T. E. (2004). A comparison of performance on the Towers of London and Hanoi in young children. Journal of Child Psychology and Psychiatry,
45, 743-754.
Burgess, P. W., Alderman, N., Evans, J., Emslie, H., & Wilson, B. A. (1998). The ecological validity of tests of executive function. Journal of the International
Neuropsychological Society, 4, 547-558.
Burgess, P. W., Alderman, N., Forbes, C., Costello, A., Coates, L. M., Dawson, D. R., …
Camp, J. S. (2014). The development of problem-solving abilities in typical and atypical development. University of London.
Capone, G., Goyal, P., Ares, W., & Lannigan, E. (2006). Neurobehavioral disorders in children, adolescents, and young adults with Down syndrome. In American Journal
of Medical Genetics Part C: Seminars in Medical Genetics (Vol. 142, pp. 158-172):
Wiley Online Library.
Carlson, S. M. (2005). Developmentally Sensitive Measures of Executive Function in
Preschool children. Developmental Neuropsychology, 28, 595-616.
Carney, D. P. J., Brown, J. H., & Henry, L. A. (2013). Executive function in Williams and
Down syndromes. Research in Developmental Disabilities, 34, 46-55.
Carr, J. (2008). The Everyday Life of Adults with Down Syndrome. Journal of Applied Research in Intellectual Disabilities, 21, 389-397.
Conners, C. K. (1997). Conners’ Rating Scales-Revised Technical Manual CTRS-R (S).
Multi-Health Systems, Inc, North Tonawanda, NY.
Costanzo, F., Varuzza, C., Menghini, D., Addona, F., Gianesini, T., & Vicari, S. (2013). Executive functions in intellectual disabilities: A comparison between Williams syndrome and Down syndrome. Research in Developmental Disabilities, 34,
1770-1780.
Dunbar, K. (1998). Problem solving. In W. Bechtel & G. Graham (Eds.), A companion to
cognitive science (pp. 289-298). Oxford, UK: Blackwell Publishing Ltd.
Dunn, L. M., Dunn, D. M., Sewell, J., Styles, B., Brzyska, B., Shamsan, Y., & Burge, B. (2009). The British Picture Vocabulary Scale (Third ed.). London: GL Assessment
Dykens, E. M. (2003). Anxiety, fears, and phobias in persons with Williams syndrome. Developmental Neuropsychology, 23, 291-316.
Elison, S., Stinton, C., & Howlin, P. (2010). Health and social outcomes in adults with Williams syndrome: Findings from cross-sectional and longitudinal cohorts. Research
in Developmental Disabilities, 31, 587-599.
Elliott, C. D. (1990). Differential Abilities Scales. San Diego, CA: Harcourt Brace Jovanovich.
Eysenck, M., Derakshan, N., Santos, R., & Calvo, M. G. (2007). Anxiety and cognitive performance: attentional control theory. Emotion, 7, 336.
Fidler, D., Philofsky, A., Hepburn, S., & Rogers, S. (2005). Nonverbal requesting and problem-solving by toddlers with down syndrome. American Journal on Mental Retardation, 110, 312-322.
Field, A. (2009). Discovering Statistics using SPSS (3rd ed.). London: Sage.
Gioia, G. A., Isquith, P. K., Guy, S. C., & Kenworthy, L. (2000). Behavior Rating Inventory
of Executive Function. USA: Psychological Assessment Resources, Inc.
Goodman, R. (2001). Psychometric properties of the strengths and difficulties questionnaire. Journal of the American Academy of Child and Adolescent Psychiatry, 40,
1337-1345.
Grace-Martin, K. (2008). Can Likert Scale Data ever be continuous? In
www.theanalaysisfactor.com (last accessed 26.08.2015).
Greer, M. K., Brown, F. R., Pai, G. S., Choudry, S. H., & Klein, A. J. (1997). Cognitive, adaptive, and behavioral characteristics of Williams syndrome. American Journal of
Howlin, P., Elison, S., Udwin, O., & Stinton, C. (2010). Cognitive, Linguistic and Adaptive Functioning in Williams Syndrome: Trajectories from Early to Middle Adulthood.
Journal of Applied Research in Intellectual Disabilities, 23, 322-336.
Joffe, V., & Varlokosta, S. (2007). Patterns of syntactic development in children with
Williams syndrome and Down's syndrome: Evidence from passives and wh‐questions.
Clinical linguistics & phonetics, 21(9), 705-727.
John, A. E., & Mervis, C. B. (2010). Sensory modulation impairments in children with
Williams syndrome. American Journal of Medical Genetics Part C: Seminars in Medical Genetics, 154C, 266-276.
Jurado, M., & Rosselli, M. (2007). The Elusive Nature of Executive Functions: A Review of
our Current Understanding. Neuropsychology Review, 17, 213-233.
Kahney, H. (1986). Getting started on problem solving. In Problem solving: A cognitive
approach (pp. 18-23). Milton Keynes, UK: Open University Press
Lanfranchi, S., Jerman, O., Dal Pont, E., Alberti, A., & Vianello, R. (2010). Executive function in adolescents with Down Syndrome. Journal of Intellectual Disability
Research, 54, 308-319.
Lee, N. R., Fidler, D., Blakeley-Smith, A., Daunhauer, L., Robinson, C., & Hepburn, S.
(2011). Caregiver report of executive functioning in a population-based sample of young children with Down syndrome. American journal on intellectual and developmental disabilities, 116, 290-304.
Leyfer, O., Woodruff-Borden, J., Klein-Tasman, B. P., Fricke, J. S., & Mervis, C. B. (2006). Prevalence of psychiatric disorders in 4 to 16-year-olds with Williams syndrome.
American Journal of Medical Genetics Part B: Neuropsychiatric Genetics, 141B,
Leyfer, O., Woodruff-Borden, J., & Mervis, C. B. (2009). Anxiety disorders in children with williams syndrome, their mothers, and their siblings: implications for the etiology of
anxiety disorders. Journal of neurodevelopmental disorders, 1, 4-14.
Lott, I. T., & Head, E. (2001). Down syndrome and Alzheimer's disease: A link between
development and aging. Mental Retardation and Developmental Disabilities Research Reviews, 7, 172-178.
McIntosh, D. N., Miller, L. J., Shyu, V., & Dunn, W. (1999). Short sensory profile. New
York: The Psychological Corporation.
Menghini, D., Addona, F., Costanzo, F., & Vicari, S. (2010). Executive Functions in
Individuals with Williams Syndrome. Journal of Intellectual Disability Research, 54, 418-432.
Mervis, C. B., Robinson, B. F., Bertrand, J., Morris, C. A., Klein-Tasman, B. P., &
Armstrong, S. C. (2000). The Williams Syndrome Cognitive Profile. Brain and Cognition, 44, 604-628.
Miyake, A., Friedman, N. P., Emerson, M. J., Witzki, A. H., Howerter, A., & Wager, T. D. (2000). The Unity and Diversity of Executive Functions and Their Contributions to Complex "Frontal Lobe" Tasks: A Latent Variable Analysis. Cognitive Psychology,
41, 49-100.
Mundy, P., Zigman, M., & Kasari, C. (1990). A longitudinal study of joint attention and
language development in autistic children. Journal of Autism and Developmental Disorders, 20, 115-128.
Nevill, A., & Lane, A. (2007). Why self-report "Likert" scale data should not be
Newell, A., & Simon, H. A. (1972). Human Problem Solving. Englewood Cliffs, N. J.: Prentice-Hall, Inc.
Pennington, B. F., Moon, J., Edgin, J., Stedron, J., & Nadel, L. (2003). The Neuropsychology of Down Syndrome: Evidence for Hippocampal Dysfunction. Child Development, 74,
75-93.
Phillips, L. H., Wynn, V. E., McPherson, S., & Gilhooly, K. J. (2001). Mental planning and the Tower of London task. Quarterly Journal of Experimental Psychology A, Human
Experimental Psychology 54, 579-597.
Pretz, J. E., Naples, A. J., & Sternberg, R. J. (2003). Recognizing, defining, and representing
problems. In J. E. Davidson & R. J. Sternberg (Eds.), The psychology of problem solving (pp. 3-30). Cambridge: Cambridge University Press.
Rabbitt, P. (1997). (ed.) Methodology of frontal and executive function. Psychology Press.
Raven, J. (2004). Raven’s Coloured Progessive Matrices. London: Pearson.
Reed, S. K. (2015). The Structure of Ill-Structured (and Well-Structured) Problems
Revisited. Educational Psychology Review, 1-26.
Reitman, W. (1965). Cognition and thought. New York, NY: Wiley Eslinger Damasio.
Rhodes, S. M., Riby, D. M., Park, J., Fraser, E., & Campbell, L. E. (2010). Executive
neuropsychological functioning in individuals with Williams syndrome. Neuropsychologia, 48, 1216-1226.
Shallice, T., & Burgess, P. (1991). Higher-order cognitive impairments and frontal lobe lesions in man. In H. S. Levin, H. M. Eisenberg & A. L. Benton (Eds.), Frontal lobe
function and dysfunction (pp. 125–138). Oxford: Oxford University Press.
Sheldon, S., Vandermorris, S., Al-Haj, M., Cohen, S., Winocur, G., & Moscovitch, M.
(2015). Ill-defined problem solving in amnestic mild cognitive impairment: Linking episodic memory to effective solution generation. Neuropsychologia, 68, 168-175.
Silverman, W. K., & Albano, A. M. (1996). Anxiety Disorders Interview Schedule for
DSM-IV.: Parent interview schedule (Vol. 1): Oxford University Press.
Stinton, C., Elison, S., & Howlin, P. (2010). Mental health problems in adults with Williams
syndrome. American journal on intellectual and developmental disabilities, 115, 3-18.
Stuss, D. T. (1992). Biological and psychological development of executive functions. Brain and Cognition, 20, 8-23.
Toplak, M. E., West, R. F., & Stanovich, K. E. (2013). Do performance‐based measures and
ratings of executive function assess the same construct? Journal of Child Psychology and Psychiatry, 54, 131-143.
Unterrainer, J. M., Rahm, B., Kaller, C. P., Leonhart, R., Quiske, K., Hoppe-Seyler, K., … Halsband, U. (2004). Planning Abilities and the Tower of London: Is This Task
Measuring a Discrete Cognitive Function? Journal of Clinical and Experimental Neuropsychology, 26, 846-856.
Vandermorris, S., Sheldon, S., Winocur, G., & Moscovitch, M. (2013). Differential
contributions of executive and episodic memory functions to problem solving in younger and older adults. Journal of the International Neuropsychological Society, 19
Woodruff-Borden, J., Kistler, D. J., Henderson, D. R., Crawford, N. A., & Mervis, C. B. (2010). Longitudinal course of anxiety in children and adolescents with Williams
syndrome. American Journal of Medical Genetics Part C: Seminars in Medical Genetics, 154C, 277-290.
[image:41.595.72.331.287.488.2]Figures and captions
Figure 2. Mean (S.E) item score on the BRIEF scales by group.
[image:42.595.73.472.374.605.2]Figure 4. Group means (S.E) of reaching-the-solution score by question and group. Question A: Getting dressed; B: Brushing teeth; C: Finding a lost possession; D: Packing a bag