BIROn - Birkbeck Institutional Research Online
Filippetti, Andrea and Guy, Frederick and Iammarino, S. (2015) Does training
help in times of crisis? Training in employment in Northern and Southern
Italy. Working Paper. Birkbeck College, University of London, London, UK.
Downloaded from:
Usage Guidelines:
Please refer to usage guidelines at or alternatively
1
CIMR Research Working Paper Series
Working Paper No. 28
Does training help in times of crisis? Training in
employment in Northern and Southern Italy
by
Andrea Filippetti
National Research Council, Italy, London School of Economics and Political Science, and Centre for Innovation Management Research, Birkbeck College, University of London, UK
Via dei Taurini, 19 - 00185, Rome (Italy)
Phone: +39 (0)6 4993 7704; email: andrea.filippetti@cnr.it
Frederick Guy
Department of Management, Birkbeck, University of London Malet Street, Bloomsbury, London WC1E 7HX Phone: +44 (0) 207 631 6773; email: f.guy@bbk.ac.uk
Simona Iammarino
London School of Economics and Political Science, UK Houghton Street, London WC2A 2AE, UK; Phone: +44 (0)20 7405 7686; Email: s.iammarino@lse.ac.uk
29 December 2015
2 Abstract
The recent economic crisis has further exacerbated longstanding territorial imbalances in the Italian labour market, in particular with respect to the relative performance between regions of the Centre-North and those of the South, or Mezzogiorno. In this paper we investigate one particular aspect of this dualism: the relative effectiveness of training in securing continued employment in a time of economic downturn. We use a panel on 4,861 individuals for the period 2008-2011 and focus on how the effects of training differ between the South and the Centre-North of Italy, and also across workers with different levels of education. Consistent with previous findings, we find that workers with more education are more likely to receive training; not surprisingly, training increases the likelihood of remaining employed, with this effect stronger for less educated workers. What is striking is that the effect of training on continued employment is notably stronger in the South than in the Centre-North. This finding is robust to controls for various macroeconomic, human capital, institutional and cultural variables suggested by the literature.
Keywords: Training in employment, South and Centre-North of Italy, Education, Economic Crisis
JEL Codes: R1, R23, J2
Acknowledgements
The authors would like to thank for their helpful comments and suggestions the participants to the Workshop University-Industry Linkages: From Theory to Policy Università Roma Tre, Rome, 26-28 May 2014; the 2014 Eu-SPRI Conference, Manchester Institute of Innovation Research, 18-20 June 2014; the Scientific Labour Markets and Innovation Systems Workshop, Birkbeck Centre for Innovation Management Research (CIMR), Birkbeck University of London, July 4, 2014; the ERSA 54th Congress, Saint Petersburg, Russia, 26-29 August 2014; and the Works in Progress Seminars, Department of Geography & Environment, LSE, 20 May 2015. Andrea Filippetti gratefully acknowledges the Marie Curie Intra-European Fellowship project FP7-PEOPLE-2011-IEF-298167-REGIO_SPIN, under the EC Grant Agreement No: PIEF-GA-2011-298167.
3
1.
Introduction
The spatial dualism of the Italian economy – the long standing and stubborn differences between South and North – is complex in its causes and varied in its consequences. In this paper we address one particular aspect of that difference, the relative effectiveness of employee training in securing continued employment in the context of the economic downturn. By many measures, these differences have grown since the global financial crisis of 2008. Such uneven impacts of the crisis are
not unique to Italy, and have led some scholars to call for more economic geography-based perspectives on the consequences of economic crises (Martin, 2011).
Italy is characterized by profound geographical differences in the levels and quality of education and human capital, types of industrial specialization, and labour market performance. These differences – part of the historical socio-economic and institutional differentiation of the country as a nation
state (see, among the most recent, Trigilia and Burroni, 2009; De Blasio and Nuzzo, 2010; Mauro and Pigliaru, 2011; Dias and Tebaldi, 2012; Crescenzi et al., 2013; D’Agostino and Scarlato, 2015) – have in recent decades been exacerbated by internal migration of highly-educated labour force from the Southern to the Central and Northern regions (e.g. Piras, 2005 and 2006; D’Antonio and Scarlato, 2007; Etzo, 2011; Iammarino and Marinelli, 2011; Marinelli, 2013).
The economic crisis has exacerbated longstanding differences between North and South: the difference in employment rates has grown, along with the difference in the employment rates of workers with high (university degree) versus low (non-completion of secondary) educational attainments (e.g. Braga and Checchi, 2010; Cipollone et al., 2010). These trends are common to most
European countries; a recent study conducted by the European Central Bank on the labour market in Europe during the crisis (ECB, 2012) shows that low-skilled workers were more severely hit by the crisis, while high-skilled employment continued to grow.
By training, we mean relatively short-term instruction in some well-defined set of employment
related skills. The provision of training is a matter of growing public and policy concern for two main reasons. One is that the factors that shift demand – changes in consumer taste (the speed of the product life cycle), in production technology, and in the spatial organization of the division of labour – have accelerated. A serious economic downturn – as in the period 2008-2011 studied here – adds a further immediate demand shock, and can accelerate the ongoing structural changes; the impact
4 diminishing. In this context, territorial differences in the provision and effectiveness of training could play a role either in the erosion of Italy’s historic geographical dualism, or in its reproduction.
We use data from the PLUS survey (Survey on Labour Participation and Unemployment Survey) carried out by the Institute for the Development of Vocational Training for Workers (ISFOL) to shed light on the relationship between training and employment during a time of crisis. We use a panel on 4,861 individuals covering the years 2008, 2010 and 2011: we study the characteristics of people who receive training while employed, and estimate the effects of training on the likelihood of
staying employed. Our focus is in particular on how the effects of training differ between the South and the Centre-North of Italy, and across workers with different levels of education. Doing so requires to address the identification problem posed by the possible endogeneity of training, which we tackle by exploiting the unique richness of information contained in the dataset, that allows controlling for both job-level features and a wide variety of individual level characteristics – from
family and educational background to personality and attitude traits – and adopting an instrumental variable approach.
Our main findings indicate that not only training does help in times of crisis, but it is more effective in the peripheral regions of the Italian Mezzogiorno, compared to the Centre-North of the country.
Another interesting outcome arises by looking at the interplay between training, geography and education: the effectiveness of training in securing continued employment emerges as inversely correlated to the worker’s educational level, thus helping in particular those with low-education.
The paper is divided into 6 sections. The following section summarises some of the relevant literature on the relationship between training, education and geography, providing the conceptual
background for the empirical analysis; it also illustrates some relevant differences in labour market conditions and training across Italian regions. Section 3 presents the data and defines the variables used in the analysis, whilst Section 4 describes the estimation strategy. Section 5 discusses the results, while Section 6 offers some conclusive remarks, implications of the study and direction for future research.
2.
Background of the study
We review first the evidence on the incidence of training across employees by levels of education,
5
2.1 Incidence of training, and its effects on employment outcomes
A considerable body of research has addressed the relationship between training and earnings
and/or productivity (among many, Blundell et al., 1996; Dearden et al., 2006; for a review see Leuven, 2005; for Italy see, for instance, Conti, 2005; Colombo and Stanca, 2008); a somewhat smaller body has addressed training and employment outcome (e.g. Ok and Tergeist, 2003; Sanders and De Grip, 2004; Budría and Telhado-Pereira, 2009), but almost none of this latter has addressed sub-national differences and territorial specific patterns. Yet, from the evidence we do have on
territorial variance in labour market structures – as between the North and the South of the UK (e.g. Turok and Edge, 1999; Sunley et al., 2001; Gardiner et al., 2013), or the South and North of Italy (e.g. Brunello et al., 2001; Contini and Trivellato, 2005; ISFOL, 2014) – we should expect a substantial impact of geography on the provision and effect of training, even more so in a context of severe economic crisis, which is likely to display its effect particularly with respect to employment and
labour market outcomes (Fingleton et al., 2015).
Training provides human capital after schooling, and is often associated with some set of skills useful for a particular occupation or industry, or complementary to a particular set of technologies (Nelson and Phelps, 1966). It can be easy to think of training as something which compensates for deficient
human capital. Yet, a consistent finding in the literature is that there is a positive correlation between prior education and training while employed. According to the International Adult Literacy Survey, for example, employer-sponsor training courses is equal to 13 per cent in low-skilled occupations, compared to 38 per cent in high-skilled occupations (Bassanini et al., 2004). Many others have found the amount of training to be positively correlated with the level of formal
education (e.g. Acemoglu and Pischke, 1999; Heckman, 1999; Kuckulenz and Zwick, 2003; Hughes et al., 2004); that firms with a more highly qualified workforce and advanced work organization train more (Lynch and Black, 1998; Zwick, 2004); and that training incidence is higher in countries with more educated labour forces (Brunello, 2001). Jobs for which previous school-provided vocational training is important in selecting new hires tend to involve much more training on-the-job than jobs
for which previous school-provided training is not important (Bishop, 1996).
Fouarge et al. (2013) find that less educated workers have a significantly lower willingness to participate in training than more educated workers, because of different economic preferences (i.e. future orientation, preference for leisure) as well as personality traits (locus of control, exam
anxiety, and openness to experience).
6 amount of training compared to temporary contracts. In a comprehensive study on lifelong training in Europe, Arulampalam et al. (2004) find that, across countries, there is a negative association
between fixed-term contacts and training, while in most countries training is positively associated with public sector employment. Training is positively associated with firm size – workers in large firms receive almost twice as many hours of training as workers in small firms (Bassanini et al., 2004).
Training generally improves the likelihood of continued employment. In a cross-country study Ok
and Tergeist (2003) find that, after controlling for individual characteristics, training reduces the job-loss rate by 3.5 per cent. Interestingly, this effect is particularly large in Italy. They also find that the employment effect is mostly related to the fact that trained workers are also more likely to be re-employed. Sanders and De Grip (2004) find, however, that training of low-skilled workers contribute only to retention of existing jobs, while it does not contribute to their external employability.
Similarly, in a study on transition to the labour market in Portugal, Budría and Telhado-Pereira (2009) find that schooling and training are strongly complementary when it comes to remaining employed. Sianesi (2008) shows that programmes providing on-the-job training are more effective in terms of future labour market prospects than vocational classroom training courses.
The effects of both education and training on employment outcomes may vary with the unemployment rate. In an environment where unemployment puts workers with much different skill levels in competition for the same jobs, the more highly educated or better trained are favoured both in labour hoarding and in hiring, as well as in retaining current employment (Thurow, 1975; Teulings and Koopmanschap, 1989; van Ours and Ridder, 1995). Hoarding is more likely when the
skills are firm-specific, and so less easily replaced in the market (Filippetti and Guy, 2015).
2.2 Sub-national geographies of training and skill
The general complementarity of training with prior education suggests that the former would have a limited role, if any, in improving the relative performance of regions in which education is relatively poor, or of improving the lot of poorly educated workers. This raises an issue for scholars of regional
development, the literature of which is increasingly couched in terms of learning and the knowledge economy. In this literature, however, while skills are typically understood as an important variable, they are usually not theorized or problematized. As Rutherford (2001, 1874) observes, learning-region approaches view geographical labour markets ‘either as secondary or as analytically indistinct
7 regional development by the education and training of the broad labour force. Many have seen a need for a more geographically-specific perspective on both such labour market dynamics and the
consequences of economic crises (e.g. Shuttleworth et al., 2005; Martin, 2011). In addition, the skilled/unskilled dichotomy is increasingly seen as far too coarse to capture the complex relationship between training, education and employment (Acemoglu and Autor, 2011): this process of skill change has long been indicated as extremely ‘sensitive to the contingencies of place’ (Peck and Haughton, 1991, 829; see also Turok and Edge, 1999; Sunley et al., 2001).
What we do know suggests localized spillover, or agglomeration, effects of education on training, paralleling the individual, firm level and national effects noted in the previous section. Brunello and De Paola (2008) argue that the complementary relationship between skills and local externalities in Italian provinces may increase both investment in training and productivity of firms located in areas with higher spatial density of employment. However, higher wages and labour turnover in the same
denser areas may counterbalance the positive effects of spatial agglomeration and reduce training:
Brunello and De Paola’s analysis, restricted to off-the-job training provided by organisations external
to the firm, shows that training is lower in provinces with higher labour market density. In the same vein, Croce and Ghignoni (2012) examine the interaction between human capital in Italian local
labour markets and individual levels of education. They find that localised human capital increases
investment in training, particularly of workers with an upper secondary degree; interestingly, the
result does not hold for those with tertiary education. For such reasons, regions differ with respect to private returns to training and the level of training chosen by individuals and employers; it appears that regions with higher levels of human capital and higher densities of employment will
also engage in more training.
Regional differences in market structure can also affect returns to employers from to investments in training (Acemoglu and Pischke, 1999), and this may either reinforce or offset the agglomeration effects just noted. Firms are expected to invest more in training when product markets are imperfectly competitive, which in general would be more likely in regions with lower employment
density and/or larger firms. The same firms are more inclined to hoard skilled labour during times of slack demand (Sepulveda, 2002; Brunello, 2009); labour hoarding in times of slack should, in turn, promote further training, since the opportunity costs of training is lower when demand is slack. Even in the absence of hoarding, market structure can affect the nature of skills produced in a locality, as
8
2.3 The context: regional differences in labour markets and training in Italy
Italy has always inspired scholars from various disciplines interested in investigating territorial
differences within the same national context (see, for all, A’Hearn and Venables, 2013; Iuzzolino et al., 2013).1 The advantage of conducting an empirical analysis within the same country makes it possible to study the variation of the phenomenon of interest within an environment that shares the same formal institutional setting.
In this paper, we divide Italy into two areas, or macro-regions: South, or Mezzogiorno, and
Centre-North. Such a territorial division of Italy is customary adopted in the literature and can be justified on the basis of the historical background (most of the South was a colony of one foreign power or another throughout recorded history, until the creation of Italy in the late 19th century - see Iammarino, 2005, for a brief review); historical and recent social and economic statistics (e.g. Iuzzolino et al., 2013); and any of numerous measures of institutional quality (e.g. D’Agostino and
Scarlato, 2015). Overall, the South may be regarded as chronically less developed. In terms of human capital the areas are comparable in terms of levels of formal educational qualifications (Education, in Table 1, Section 3 below), but lower in terms of internationally standardized measures of literacy and numeracy (Pisa scores, Table 1).
There is an alternative territorial division reported in the literature in which the Centre-North is itself divided into two, the logic of being that some regions in the Centre are an institutionally and economically distinctive ‘Third Italy’, renowned for rich social capital (e.g. Putnam, 1993) and clusters of SMEs (e.g. Becattini, 1979; Pyke et al., 1990), in contrast to the supposed large firm prevalence in the North. Yet, the usefulness of this North-Centre distinction has been questioned on
the grounds that the SME networks of the Centre (including also, for these purposes, the Northeast) are in fact closely integrated with the larger multinational firms and business services of the North (or, more precisely, the Northwest: see Dunford and Greco, 2005). The South exists largely outside of these networks, except to the extent that it hosts branch plants of Centre-North firms (a decreasing presence over the past two decades, as many of such branch plants have been moved
abroad). Local networks are not as extensive in the South, which lacks ‘bridging’ social capital (Crescenzi et al., 2013); consequently, firms tend to internalize more functions and more stages of production, and thus to be larger than the networked SMEs of the Centre-North (Passaro 1994; Lazerson and Lorenzoni, 1999). The relatively stand-alone nature of southern firms – larger firms yet
located in areas of lower employment density - should increase their monopsony power in relation
1
9 to workers and, for the reasons discussed in section 2.1 above, should be a factor encouraging them both to provide more training and to retain skilled workers when demand is slack.
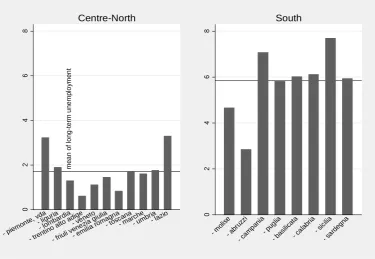
In the crisis period 2008-2013 the national GDP in Italy dropped by some 8 per cent. The national rate of unemployment rose from 6.7 per cent in 2008 up to 8.4 in 2011 and 12.7 in 2014, after nearly ten year of steady decline. Figures 1a and 1b display the rate of unemployment and long-term unemployment (> 1 year) in 2008 across the Italian regions. The vertical bars run from North-Centre on the left – the regions from Piemonte to Lazio – to South on the right – the regions from Molise to
Sardegna – and highlight the sharp division of the country into two different labour markets at the beginning of the crisis. The average rate of unemployment in the regions of the Centre-North was 4.5 per cent in 2008, compared with 12 per cent in the South; the difference is even sharper when looking at long-term unemployment, with rates of 1.7 and 6.5 per cent respectively. During the period 2008-11 unemployment grew slightly faster in the Centre North than in the South, reaching,
[image:10.595.74.433.376.636.2]in 2011, 6.2 and 13.5 per cent respectively in the two areas.2
Figure 1a – Rate of unemployment and average by Centre-North (left) and South (right), 2008
Source: our elaboration on ISTAT data
2
In 2014, unemployment was 9.4 per cent in the Centre-North and 20.7 per cent in the South.
0 5 10 15 m e a n o f u n e m p lo y 1
- piem onte,
vda - ligu
ria
- lomb ardia
- tren tino a
lto ad ige - ven
eto
- friul i ven
ezia giulia
- emi lia ro
magn a
- tosc ana - marc
he - umb
ria - lazio Centre-North 0 5 10 15 m e a n o f u n e m p lo y 1 - m olis e
- abr
uzzi
- cam
pani
a
- pug
lia
- bas
ilica
ta
- cal
abria
- sic
ilia
- sar
degn
10 Figure 1b – Rate of long-term unemployment and average by Centre-North (left) and South (right), 2008
Source: our elaboration on ISTAT data
Figure 2 presents the rates of training while employed (TWE) by region in 2008: this is the share of the employed who reported to have participated in training in the year prior to the PLUS survey used in the empirical analysis reported below.3 The Northern and Central regions show higher figures for TWE (with the notable exception of Marche) than the Southern ones.
Across groups of workers, the crisis has had a similar effect in Italy as registered elsewhere in Europe (ECB, 2012): less-educated workers have been hit hardest than those with higher levels of education; young workers (<25) are worse off compared to older ones; firms have shed mostly workers with temporary contracts. At the same time – as shown by ISTAT data reported in Figure 3 – the crisis has
exacerbated a process of territorial divergence in the rate of employment that was already unfolding since the early 2000s: in the period 2008-2011 the employment rate dropped dramatically in the Southern regions and this trend has been confirmed also more recently (CNEL, 2014).
3
See Section 3 below for the detailed description of the dataset.
0 2 4 6 8 m e a n o f lo n g -t e rm u n e m p lo ym e n t
- piem onte,
vda - ligu
ria
- lomb ardia
- tren tino a
lto ad ige - ven
eto
- friul i ven
ezia giulia
- emi lia ro
magn a
- tosc ana - marc
he - umb
ria - lazio Centre-North 0 2 4 6 8 m e a n o f lo n g -t e rm u n e m p lo ym e n t
- mol
ise
- abr
uzzi
- cam
pani
a
- pug
lia
- bas
ilica
ta
- cal
abria
- sic
ilia
- sar
degn
11 Figure 2 – Regional mean of Training_all, 2008 average by Centre-North (left) and South (right), 2008
Source: our elaboration on ISFOL PLUS data.
Figure 3 – Rate of employment (> 15-year old) in the Centre-North and South of Italy, 2000-2011
Source: ISTAT, Rilevazione sulle forze di lavoro; Indexes 2000=100
The dualism of the Italian labour market seems to have broadened by the crisis (ISFOL, 2014), reinforcing the case for analysing the impact of training on employment during this period.
0 .1 .2 .3 .4 m e a n o f T ra in in g _ a ll
- piem onte,
vda - ligu
ria
- lomb ardia
- tren tino a
lto ad ige - ven
eto
- friul i ven
ezia giulia
- emi lia ro
magn a
- tosc ana - marc
he - umb
ria - lazio
Centre-North 0 .1 .2 .3 .4 m e a n o f T ra in in g _ a ll - m olis e
- abr
uzzi
- cam
pani
a
- pug
lia
- bas
ilica
ta
- cal
abria
- sic
ilia
- sar
[image:12.595.75.434.452.674.2]12
3.
Dataset and main variables
In the empirical analysis we employ data from the PLUS Survey (Participation Labour Unemployment Survey), a sample survey on the Italian labour market supply developed and administered by ISFOL, a national research institute reporting to the Italian Ministry of Labour and Social Policy (see Gianmatteo, 2009, Meliciani and Radicchia, 2011, and Mandrone and Radicchia, 2012, for a detailed description of the survey). The Survey annually samples, on average, 40,000 individuals, contacted
through a dynamic CATI system without proxy interviews. The survey sample design is stratified over the Italian population aged 18-64: strata are defined by region (20 administrative regions), type of city (metropolitan/not metropolitan), age (5 classes), sex, and employment status of the individual (employed, unemployed, student, retired, other inactive/housewife). The reference population is derived from the annual averages of the ISTAT Labour Force Survey.4
In the present paper we use a 3-year panel – from the 2008, 2010, and 2011 survey waves – including 12,593 individuals in each wave. The survey is extremely rich in information on individual job features, employer characteristics, type of training activities both within and outside the workplace, income, and educational history, at the same time providing detailed information on other crucial aspects of the respondents such as, for instance, family background, residential
mobility, general skills (i.e. knowledge of English, information and communication technology (ICT) skills), geographical location, personal life satisfaction, and risk propensity. Our sample takes into account all individuals included in the 3-year panel that were employed in 2008, and were still in the labour force – either employed or unemployed – in 2011. This gives us a final sample of 4,861
individuals, of whom 512 (11%) became unemployed in 2011.5
In order to analyse the impact of training in employment on the probability of keeping the job during the crisis period 2008-11, our dichotomous dependent variable – Remaining employed – takes a value equal to 1 if the individual is employed in 2011, and 0 if unemployed.
Training takes the value 1 if the individual respondent reported to have received training while employed during the period 2008-2010, 0 otherwise.6 All specifications of our model were run with two versions of this variable. Training_All uses all forms of reported training – training courses in classroom, distance training courses, on-the-job (workplace) training, and shorter term modes such as seminars, conferences and fairs, and workshops; whilst Training_Long excludes all forms of
4
The ISFOL PLUS data are available online by accessing the open data section http://www.isfol.it/open-data-delle-ricerche/isfol-microdati
5
Our final sample thus includes those that were employed throughout the period 2008-11, and those who became unemployed either in 2010 and/or in 2011. For consistency in the construction of our dependent variable (see below) we excluded those individuals that lost their job in 2010 and found a new one in 2011 (who were just 1.3% of the sample).
6
13 term training.7 The results reported here use Training_All; results with Training_Long are similar, and are available from the authors.
We classify education as Edu_low (primary and middle school diploma), Edu_medium (high school diploma), and Edu_high (university degree or above).
For purposes of analysis, we divide Italy into two areas, or macro-regions: South, or Mezzogiorno, and Centre-North: the reasons for this division are discussed in section 2.3, above. We have also run our basic models on the alternative territorial division of three areas (South, Centre and North), but
we found little difference between North and Centre, so what is presented here is the South versus Centre-North partition.8
We also control for a large number of regional characteristics, and, as customary in the quantitative literature on training in employment, individual features – including not only traditional variables on demographic and educational aspects, but also on family background and personality attitude –, and
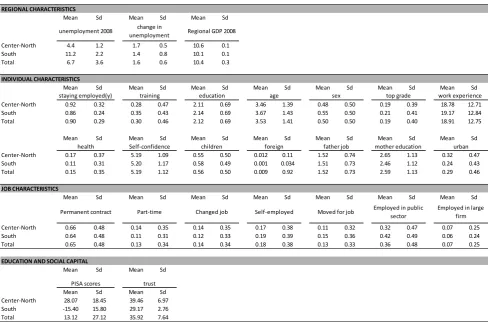
job-related characteristics. The complete list of variables used in the estimates, their description and source is reported in Appendix A. Summary statistics for the main variables are given in Table 1, and Tables 2a and 2b.
We see from Table 2a that training is far more prevalent for workers with higher levels of education
– about 60% of all university educated workers said they had received training; for those who had completed secondary school but not university, the figures were 38% in the North and 35% in the South, while for those who had not completed secondary school the figures were 19% in the North and only 14% in the South.
7
See Q #D176 in the ISFOL-PLUS Survey.
8
14 Table 1 - Summary statistics for the main variables used in the analysis
Table 2a - Mean participation in training, by educational level and region
Regions Education level
low-educated medium-educated high-educated
North 0.18 0.37 0.59
South 0.14 0.34 0.60
In Table 2b, we see differences, by macro region, in the proportion of those workers who remained employed who did not remain with the same employer. Workers in the South were substantially less likely to change employers, and that mobility between employers increased with levels of education.
Table 2b - Mean employer change, by education level and region, for those remaining employed
Regions Education level
low-educated medium-educated high-educated
North 0.12 0.13 0.16
South 0.08 0.09 0.12
REGIONAL CHARACTERISTICS
Mean Sd Mean Sd Mean Sd
Center-North 4.4 1.2 1.7 0.5 10.6 0.1
South 11.2 2.2 1.4 0.8 10.1 0.1
Total 6.7 3.6 1.6 0.6 10.4 0.3
INDIVIDUAL CHARACTERISTICS
Mean Sd Mean Sd Mean Sd Mean Sd Mean Sd Mean Sd Mean Sd
Center-North 0.92 0.32 0.28 0.47 2.11 0.69 3.46 1.39 0.48 0.50 0.19 0.39 18.78 12.71
South 0.86 0.24 0.35 0.43 2.14 0.69 3.67 1.43 0.55 0.50 0.21 0.41 19.17 12.84
Total 0.90 0.29 0.30 0.46 2.12 0.69 3.53 1.41 0.50 0.50 0.19 0.40 18.91 12.75
Mean Sd Mean Sd Mean Sd Mean Sd Mean Sd Mean Sd Mean Sd
Center-North 0.17 0.37 5.19 1.09 0.55 0.50 0.012 0.11 1.52 0.74 2.65 1.13 0.32 0.47
South 0.11 0.31 5.20 1.17 0.58 0.49 0.001 0.034 1.51 0.73 2.46 1.12 0.24 0.43
Total 0.15 0.35 5.19 1.12 0.56 0.50 0.009 0.92 1.52 0.73 2.59 1.13 0.29 0.46
JOB CHARACTERISTICS
Mean Sd Mean Sd Mean Sd Mean Sd Mean Sd Mean Sd Mean Sd
Center-North 0.66 0.48 0.14 0.35 0.14 0.35 0.17 0.38 0.11 0.32 0.32 0.47 0.07 0.25
South 0.64 0.48 0.11 0.31 0.12 0.33 0.19 0.39 0.15 0.36 0.42 0.49 0.06 0.24
Total 0.65 0.48 0.13 0.34 0.14 0.34 0.18 0.38 0.13 0.33 0.36 0.48 0.07 0.25
EDUCATION AND SOCIAL CAPITAL
Mean Sd Mean Sd
Mean Sd Mean Sd
Center-North 28.07 18.45 39.46 6.97
South -15.40 15.80 29.17 2.76
Total 13.12 27.12 35.92 7.64
PISA scores trust
foreign children Self-confidence health urban work experience top grade sex age mother education father job
Permanent contract Part-time Changed job Employed in public
sector
Employed in large firm Self-employed Moved for job
Regional GDP 2008 unemployment 2008 change in
unemployment
[image:15.595.71.402.661.722.2]15
4.
Estimation strategy: model and robustness checks
4.1 The baseline model
The estimation strategy for the effect of training in employment on the probability to remain employed in the years of severe economic recession is based on the following simple baseline equation:
𝑦𝑖 = 𝑘 + 𝑡𝑟𝑎𝑖𝑛𝑖+ 𝑟𝑒𝑔𝑖𝑟+ 𝑒𝑑𝑢𝑖+ 𝑖𝑛𝑑𝑖+ 𝑗𝑜𝑏𝑖+ 𝑣𝑖 (1)
where yi is our dependent variable (equal to 1 for those who remain employed over the period
2008-2011, and equal to 0 for those who are employed over the period 2008-2010 and unemployed in 2011). Train is our main explanatory variable (Training_all), together with a vector of regional
variables (reg) and education variables (edu). Ind is our set of controls at the individual level, and job
is a vector of job characteristics for those in employment (see Appendix A for details); finally, k is a constant while v is the error term.
In order to study the effect of training across Centre-North and South, as well as across the three
levels of education, we employ the following two interaction models:
𝑦𝑖 = 𝑘 + 𝑡𝑟𝑎𝑖𝑛𝑖+ 𝑟𝑒𝑔𝑖𝑟+ 𝑒𝑑𝑢𝑖+ 𝑖𝑛𝑑𝑖+ 𝑗𝑜𝑏𝑖+ 𝒕𝒓𝒂𝒊𝒏𝒊∗ 𝒓𝒆𝒈𝒊𝒓+ 𝑣𝑖 (2)
𝑦𝑖 = 𝑘 + 𝑡𝑟𝑎𝑖𝑛𝑖+ 𝑟𝑒𝑔𝑖𝑟+ 𝑒𝑑𝑢𝑖+ 𝑖𝑛𝑑𝑖+ 𝑗𝑜𝑏𝑖+ 𝒕𝒓𝒂𝒊𝒏𝒊∗ 𝒓𝒆𝒈𝒊𝒓∗ 𝒆𝒅𝒖𝒊+ 𝑣𝑖 (3)
In equation 2, the interaction term 𝒕𝒓𝒂𝒊𝒏𝒊∗ 𝒓𝒆𝒈𝒊𝒓 considers the joint effect of training while employed for the regions of the Centre-North and for the Southern regions. In equation 3, the term
𝒕𝒓𝒂𝒊𝒏𝒊∗ 𝒓𝒆𝒈𝒊𝒓∗ 𝒆𝒅𝒖𝒊 considers the joint effect of training across the Centre-North and the South
for the three levels of education.
4.2 Robustness checks
The possibility of estimating the causal effect of training on the employment outcome relies on the absence of any additional source of bias that may affect the relation of interest. However, this is complicated by the fact that training may be endogenous. We do not have information on who
16 joint decision. If the choice is the employer’s, it is likely that she will opt to train workers who she expects to keep, whether because they are regarded as more capable or because it is more costly to
dismiss them (for instance, if they have a permanent rather than a temporary contract). We can control for contract type, but the employer’s assessment of the worker’s capabilities is unobserved: the omitted variable bias may drive the identification of the effect. If the choice is the worker’s, it may be correlated with unobserved characteristics which would on their own be indicative of good employment prospects. To deal with the endogeneity of training we adopted an instrumental
variable approach exploiting information at the individual level contained in the PLUS survey.
Risk propensity is used to construct an individual level instrumental variable (IV) on the basis of information reported in the PLUS survey. Our measure of risk propensity is based on Question D.183 in the survey, from which we produce a dichotomous variable that takes the value 1 if the individual is risk taker and 0 if risk averse.9 The general argument for using risk as an instrument is that training
is a form of investment in human capital, and therefore it entails risky decision process (Carneiro and Heckman, 2003, 42). An increase in the risk-taking inclination of the worker should increase her disposition to undertake new learning processes and training activities: we thus expect the instrument to be positively correlated with the instrumented variable. Unlike training, however, it is
improbable that individual risk propensity reflects the specific employment trends spurred by the financial and economic crisis; as such, it hardly correlates with any individual employment dynamics.
The IV model is a two-stage model: first, employees undertake training or not (equation 4); second, employees that do, or do not, remain employed in 2011 (equation 5). Each stage is of interest – who
gets trained and who does not, along with whatever effect training may have on continued
employment over the 2008-11 period. The first stage regression in which we instrument training with our risk propensity variable (risk) uses the same regressors as our baseline model (see eq. 1):
𝑡𝑟𝑎𝑖𝑛𝑖𝐼𝑉 = 𝑘 + 𝒓𝒊𝒔𝒌𝒊+ 𝑟𝑒𝑔𝑖𝑟+ 𝑒𝑑𝑢𝑖+ 𝑖𝑛𝑑𝑖+ 𝑗𝑜𝑏𝑖+ 𝑣𝑖 (4)
In the second stage regression we use as explanatory variable training instrumented (𝑡𝑟𝑎𝑖𝑛𝑖𝐼𝑉), and the same variables on the right hand side. Note that now train is no longer a dummy variable but a continuous variable that reflects the likelihood that the individual was involved in training.
9
17 𝑦𝑖= 𝑘 + 𝒕𝒓𝒂𝒊𝒏𝒊𝑰𝑽 + 𝑟𝑒𝑔𝑖𝑟+ 𝑒𝑑𝑢𝑖+ 𝑖𝑛𝑑𝑖+ 𝑗𝑜𝑏𝑖+ 𝑣𝑖 (5)
In the IV versions of models where training is interacted with area and/or education, the interactions
are also instrumented.
5.
Results
5.1 Simple probit estimates
Table 3 presents the results of the probit estimates for the baseline model (eq. 1) in columns 1 to 4, and for the two interaction models in column 5 (eq. 2) and column 6 (eq. 3).
Results in columns 1 to 4 show that training while employed increases the probability of remaining employed over a period of economic crisis; education also plays a substantial role. All coefficients for our regressors of interest are positive and highly significant. In column 5 we introduce interactions of
training with Regions (Centre-North, South). We see that training has a larger effect in the Southern regions – its effect on the probability of remaining employed is nearly three times that in the Centre-North. In column 6 we introduce interactions also with the level of education. The individual coefficients are not statistically significant; however, a three-way interaction of this sort is best
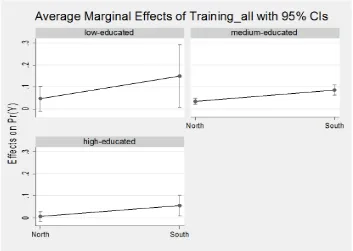
interpreted graphically, as reported in Figures 4a and 4b, which correspond to the estimates in column 5 (eq. 2) and column 6 (eq. 3) respectively.
We see that training has a stronger effect on the likelihood of continued employment in the South, where it boosts the probability of remaining employed by 9 percentage points, than in the Centre-North, where the improvement is only 2.5 percent.
When the interaction is extended to include also the educational dimension, we see that training is relatively more effective for workers with lower levels of education. Figure 4b shows that engaging in training scheme in the South provides low-educated workers with a 15 percentage point improvement in the likelihood of remaining employed through the crisis, compared with those with
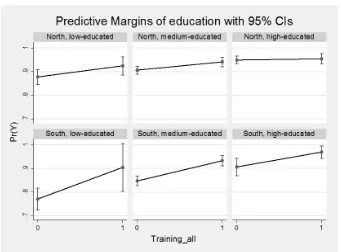
similar levels of education and in the same geographical area but not doing training. Conversely, in Centre-North regions the improvement in prospects from training while employed is around 5% for the less educated, relative to those not doing any training. Geographical differences in the probability of remaining in employment as a result of training decrease for higher educational levels: this is shown in Figure 4c, representing the predictive margins of educational levels. It is important
18 Table 3 – Results of probit estimates (models in equations 1, 2, 3)
Clustered standard errors in brackets; *** p<0.01, ** p<0.05, * p<0.1
DV:staying employed
(1) (2) (3) (4) (5) (6)
training_all 0.535*** 0.482*** 0.437*** 0.333*** training_all 0.202*** 0.299
(0.0671) (0.0664) (0.0650) (0.0666) (0.0523) (0.197)
education 0.245*** 0.356*** 0.256*** South#training 0.377***
(0.0375) (0.0320) (0.0349) (0.138)
regional rate of unemployment in 2008 -0.0125 -0.0246 South#medium-educated#training -0.0824
(0.0213) (0.0210) (0.474)
regional change in unemployment 2008-2011 -0.0309 -0.0353 South#high-educated#training 0.209
(0.0445) (0.0421) (0.300)
regional GDP per capita in 2008 -0.115 -0.107 South#medium-educated 0.153
(0.422) (0.420) (0.0960)
South -0.291* -0.219 South#high-educated 0.132
(0.175) (0.175) (0.0991)
age 0.0507 -0.00871 in training#medium-educated -0.0289
(0.0489) (0.0442) (0.215)
male 0.0882 0.0952 in training#high-educated -0.239
(0.0678) (0.0706) (0.200)
higher marks at school -0.0841 -0.0550
(0.0646) (0.0721) all controls included
experience 0.0139*** 0.0126***
(0.00422) (0.00400) Testing differences North-South
health: sport&no-smoking -0.00706 -0.0223 training vs. no-training (low education) 0.102*
(0.0608) (0.0608) (0.078)
individual satisfaction of life 0.112*** 0.0985*** training vs. no-training (medium education) 0.051**
(0.0303) (0.0318) (0.012)
presence of children 0.0833 0.0468 training vs. no-training (high education) 0.049**
(0.0547) (0.0611) (0.026)
non Italian citizen -0.0462 -0.0566
(0.303) (0.282)
father's job -0.0368 -0.0183
(0.0446) (0.0497)
level of mother's education 0.0373 0.0384
(0.0249) (0.0251)
living in urban area -0.0578 -0.0951
(0.0777) (0.0708)
permanent contract 0.592***
(0.0888)
part-time employed in 2008 -0.182**
(0.0915)
changed job over 2008-2011 0.0117
(0.0973)
self-employed in 2008 0.159**
(0.0752)
moved for job reasons over 2008-2011 0.148*
(0.0768)
employed in public sector 2008 0.214**
(0.0846)
employed in large firm 2008 >250 -0.0197
(0.0930)
industry dummies (15 sectors) included
Constant 1.174*** 0.687*** 0.844 0.740
(0.0543) (0.109) (4.490) (4.490)
pseudo R square 0.0256 0.0419 0.0937 0.1439 0.1460 0.1471
Observations 4861 4861 4861 4861 4861 4861
19 Figure 4a – Graphical representation of the marginal effect of the interaction of training and geography
[image:20.595.74.427.452.703.2]20 Figure 4c – Predictive margins of educational levels
5.2 Corroboration of the findings
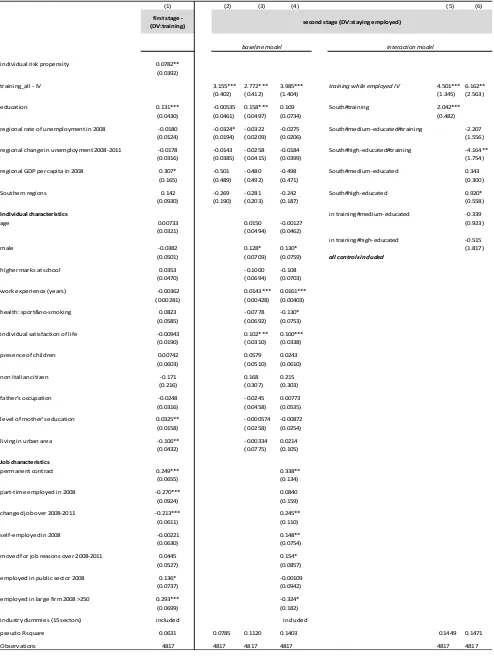
Table 4 presents the instrumental variable estimates. These involve a two-stage procedure, the first a probit model which includes the instrument, individual risk propensity (discussed in section 4.2 above), to get a fitted value that may be interpreted as the probability of receiving training; the second stage uses this instrument in place of the variable training in the regression. Column 1
reports the results for the first stage (eq. 4), while columns 2-4 display the probit estimates for the baseline model; columns 5 and 6 present the outcomes for the interaction models.
The results confirm that training while in employment is positively correlated with the probability of keeping one’s job during a crisis at the 1% level. As expected, the instrument is positively correlated with the instrumented variable at the 5% level, indicating that the higher the individual propensity
for risk, the higher the probability of undertaking some form of training. However, the Kleibergen-Paap Wald F statistics reported for the first stage Staiger and Stock (1997) and the Stock and Yogo (2005) indicates that the instrument is weak. Suspecting that this weakness may be due to the large number of individual controls in the model, we estimate the same model with all such controls
21 Table 4 – Results of IV probit estimates – two stages estimates (models 4 and 5, and interactions)
Clustered standard errors in brackets; *** p<0.01, ** p<0.05, * p<0.1
DV:staying employed
(1) (2) (3) (4) (5) (6)
first stage - (DV:training)
individual risk propensity 0.0782**
(0.0392)
training_all - IV 3.155*** 2.772*** 3.985*** training while employed IV 4.501*** 6.162**
(0.402) (0.412) (1.404) (1.345) (2.563)
education 0.131*** -0.00535 0.158*** 0.109 South#training 2.042***
(0.0430) (0.0461) (0.0497) (0.0734) (0.482)
regional rate of unemployment in 2008 -0.0180 -0.0324* -0.0322 -0.0275 South#medium-educated#training -2.207
(0.0124) (0.0194) (0.0209) (0.0206) (1.556)
regional change in unemployment 2008-2011 -0.0178 -0.0143 -0.0258 -0.0184 South#high-educated#training -4.164**
(0.0316) (0.0385) (0.0415) (0.0399) (1.754)
regional GDP per capita in 2008 0.307* -0.501 -0.480 -0.498 South#medium-educated 0.343
(0.165) (0.489) (0.492) (0.471) (0.300)
Southern regions 0.142 -0.269 -0.281 -0.242 South#high-educated 0.920*
(0.0930) (0.190) (0.203) (0.187) (0.558)
Individual characteristics in training#medium-educated -0.339
age 0.00733 0.0150 -0.00127 (0.923)
(0.0321) (0.0494) (0.0462)
in training#high-educated -0.515
male -0.0382 0.128* 0.130* (1.817)
(0.0501) (0.0709) (0.0759) all controls included
higher marks at school 0.0353 -0.1000 -0.108
(0.0470) (0.0694) (0.0703)
work experience (years) -0.00362 0.0143*** 0.0161***
(0.00281) (0.00428) (0.00403)
health: sport&no-smoking 0.0823 -0.0778 -0.130*
(0.0585) (0.0692) (0.0753)
individual satisfaction of life -0.00943 0.102*** 0.100***
(0.0190) (0.0310) (0.0338)
presence of children 0.00742 0.0579 0.0243
(0.0603) (0.0510) (0.0610)
non Italian citizen -0.171 0.168 0.215
(0.216) (0.307) (0.303)
father's occupation -0.0248 -0.0245 0.00773
(0.0316) (0.0458) (0.0535)
level of mother's education 0.0325** -0.000574 -0.00872
(0.0158) (0.0258) (0.0254)
living in urban area -0.106** -0.00334 0.0214
(0.0432) (0.0775) (0.105)
Job characteristics
permanent contract 0.249*** 0.338**
(0.0655) (0.134)
part-time employed in 2008 -0.270*** 0.0840
(0.0924) (0.159)
changed job over 2008-2011 -0.213*** 0.245**
(0.0611) (0.110)
self-employed in 2008 -0.00221 0.148**
(0.0630) (0.0754)
moved for job reasons over 2008-2011 0.0445 0.154*
(0.0527) (0.0857)
employed in public sector 2008 0.136* -0.00109
(0.0737) (0.0942)
employed in large firm 2008 >250 0.293*** -0.324*
(0.0699) (0.182)
industry dummies (15 sectors) included included
pseudo R square 0.0631 0.0785 0.1120 0.1403 0.1449 0.1471
Observations 4817 4817 4817 4817 4817 4817
baseline model interaction model
22 Figure 5 – Graphical representation of the effect of training by educational level: South relative to Centre-North
Results from the IV approach are qualitatively similar to those of our baseline model. Again, it is
helpful to visualize the relationship between training, geography and education. Figure 5 shows the estimated difference in effects, between Southern regions and Centre-Northern ones, of training on the probability of remaining employed, for workers with different levels of education.10
As we see, for low-educated workers with zero or little training the probability of remaining in
employment in the South is 40% less likely, but as workers undertake more training (moving to the right), the probability becomes the same than in the Centre-North. Such a difference, though, is strong for low education, while it disappears when we look at high-educated, where training does not seem to make a difference on the probability of staying employed across the macro regions.
The South/Centre-North difference in the effectiveness of training during the years 2008-2011 is
surprisingly strong, given the large number of individual-, job- and region-level controls included in the models. These controls have definitely an effect: for instance, if we remove the regional
10
23 unemployment variables from the model, the difference between the two macro-regions increases substantially, as we would expect. We tried to explain the differences reported in Table 4 by
including further regional variables, controlling for labour market conditions (i.e. the regional share of youth not in education, in employment, or training – NEET); type of educational institutions (i.e. types of schools) or their quality (regional averages on the Pisa tests); measures of social capital, used in various other studies of regional social and economic imbalances in Italy. None of these additional controls had a noticeable effect on the South versus Centre-North difference in the effect
of training on remaining in employment. Results of these additional checks are provided in Appendix B.
6.
Conclusion
In the South of Italy, training has a substantially larger effect on the probability of remaining employed through the financial crisis and its aftermath, than it does in the Centre-North. The effect is strongest for workers who have not completed secondary education. The effect is not explained by differences, across Italy’s twenty regions, in initial unemployment, the change in unemployment, or GDP per capita, all of which we control for. It remains strong when we instrument training to
correct for endogeneity; and it remains so when we add further region-level controls for the quality of education (regional Pisa scores), and for Tabellini’s social capital variables.
This could suggest a strong role for training as a response to problems of unemployment and skill shortages in regions which, like the Italian Mezzogiorno, are relatively poor, relatively hard hit by the
crisis and post-crisis restructuring, or both – but for an important qualification: workers with low levels of education are substantially less likely to receive training than more educated workers, and in the South these workers are substantially less likely to receive training than similarly educated workers in the Centre-North. Similarly, less-educated workers were less likely to change jobs than
their more educated counterparts, and workers in the South (regardless of education level) were less likely to change than those in the North. In short, when we consider workers in the South with low levels of education, few of them workers receive training; their chances of remaining employed are substantially improved if they do get training; and, whether or not they get training, they are unlikely to change employers. Workers with medium levels of education (completed secondary
school) are more likely to receive training, but again those in the South are far less likely to change jobs.
24 employment – are much smaller. The difference between those with university educations and those without is that, in the post-mass production economy, the former are in a national labour
market while the latter are in local ones (see also Detang-Dessendre, 1999): Southerners with university degrees migrate north for work in large numbers.
To understand any of these differences - in the effect of training for non-university educated workers in the South; in the lower levels of inter-employer mobility for workers, and especially less educated workers, in the South; and the continuing exodus of university educated workers from the
South - we need to understand more about the local demand side of the labour market. Literature on market structure and inter-firm relations suggests one factor: Southern firms internalise more functions, have more limited external networks, and are less likely to be located in specialised agglomerations. The broad literature on industrial dynamics and agglomeration economies suggests that this is not a good recipe for innovation or for job creation, and so it helps to explain the
emigration of better educated workers. It also describes an environment in which inter-firm job mobility is likely to be lower, and thus one in which training is more directed at needs and opportunities with the present employer (specific skills), and has less of an effect of fostering a localized pool of skilled labour. The individual in the South receiving training has done more to
secure future employment than her counterpart in the Centre-North, but this may be seen as coming at the expense of external benefits, in the failure to contribute to a Marshallian pool of skilled labour from which other firms in the area may draw.
Thus, as Shuttleworth et al. (2005) concluded in the case of the UK, our results suggest the need for a geographical approach to labour-market policy. Where demand is low and inter-firm mobility is
slight, it is difficult to maintain a pool of skilled labour: skills obtained outside the firm, notably in universities, tend to leave the area, while those obtained inside the firm tend to stay put in that same firm. Under such conditions, an effective skills policy must either go together with the easing of inter-firm barriers and the emergence of specialised agglomerations, or work with employers to support their internal needs. There is some hope that the latter may aid the former: Klepper (2011)
shows how many large specialized agglomerations have grown from single successful firms that provided good training and inadvertently fostered the creation of numerous competitors, staffed by their own ex-employees. Yet hoping to see such an outcome flowing from one or more large employers in the South of Italy may be vain: the culture and other informal institutions of the South
25 geographical aggregation. We also need a better choice of instruments: the risk aversion instrument used in this paper is just adequate for the models estimated here; alternative instruments with
26
References
A’Hearn, B. and Venables, A.J. (2013) ‘Regional disparities: Internal geography and external trade, in: G. Toniolo (ed.), The Oxford Handbook of the Italian Economy Since Unification, 599-630, Oxford University Press, Oxford.
Acemoglu, D., and Autor, D. (2011) ‘Skills, Tasks and Technologies: Implications for Employment and Earnings’, in: O. Ashenfelter and D. Card (eds) Handbook of Labor Economics, Vol. 4, Part B, 1043– 1171, Elsevier, Amsterdam.
Acemoglu, D. and Pischke, J. (1999) ‘The structure of wages and investment in general training’,
Journal of Political Economy, 107, 539–572.
Arulampalam, W., Booth, A. L. and Bryan, M. L. (2004) ‘Training in Europe’, Journal of the European Economic Association, 2, 346–360.
Bassanini, A. and Ok, W. (2004) ‘How Do Firms’ and Individuals’ Incentives to Invest in Human Capital Vary across Groups?’, Paper presented at the joint EC-OECD conference on "Human Capital and labour market performance", https://halshs.archives-ouvertes.fr/halshs-00194344
Becattini, G. (1979) ‘Dal settore industriale al distretto industriale: alcune considerazioni sull'unità di indagine dell'economia industriale’, Rivista di economia e politica industriale, 1:7-21.
Bishop, J. H. (1996) ‘What We Know About Employer-Provided Training: A Review of Literature’, CAHRS Working Paper #96-09, Ithaca, NY: Cornell University, School of Industrial and Labor
Relations, Center for Advanced Human Resource Studies.
http://digitalcommons.ilr.cornell.edu/cahrswp/180
Blundell, R., Dearden, L., Meghir, C. (1996) ‘The Determinants and Effects of Work-Related Training in Britain’, The Institute of Fiscal Studies, April.
Braga, M. and Checchi, D. (2010) ‘Sistemi scolastici regionali e capacità di sviluppo delle competenze. I divari dalle indagini Pirsl e Pisa’, Rivista delle Politiche Sociali / Italian Journal of Social Policy, 3, 1-25.
Brunello, G. (2001) ‘On the Complementarity between Education and Training in Europe’, IZA Discussion paper series No. 309, http://www.econstor.eu/bitstream/10419/21164/1/dp309.pdf
Brunello, G. (2009) ‘The Effect of Economic Downturns on Apprenticeships and Initial Workplace Training: A Review of the Evidence’, Empirical Research in Vocational Education and Training, 1, 145–171.
Brunello, G. and De Paola, M. (2008) ‘Training and economic density: Some evidence from Italian provinces’, Labour Economics, 15, 118– 140.
Brunello, G., Lupi, C. and Ordine, P. (2001) ‘Widening differences in Italian regional unemployment’,
27 Budría, S. and Telhado-Pereira, P. (2009) ‘The Contribution of Vocational Training to Employment, Job-Related Skills and Productivity: Evidence from Madeira’, International Journal of Training and Development, 13, 53–72.
Carneiro, P. and Heckman, J.J. (2003) ‘Human Capital Policy’, IZA Discussion paper series No. 821, http://www.econstor.eu/bitstream/10419/20066/1/dp821.pdf
Cipollone, P., Monatanaro, P and Sestito, P. (2010) ‘L’istruzione’, in: Il Mezzogiorno e la politica economica dell’Italia, Bank of Italy, 4/June 2010, 77-104.
CNEL (2014) Rapporto sul mercato del lavoro 2013-14, Rome.
Colombo, E. and Stanca, L. (2008) ‘The Impact of Training on Productivity: Evidence from a Large Panel of Firms’, Department of Economics, University of Milan-Bicocca, Working Papers Series no. 134, January.
Conti, G. (2005) ‘Training, Productivity and Wages in Italy’, Labour Economics, 12, 557-576.
Contini, B. and Trivellato, U. (Eds) (2005) Eppur si muove. Dinamiche e persistenze nel mercato del lavoro italiano, Il Mulino, Bologna.
Crescenzi, R., Gagliardi, L. and Percoco, M. (2013) ‘Social capital and the innovative performance of Italian provinces’, Environment and Planning A, 45 (4): 908-929.
Croce, G. and Ghignoni, E. (2012) ‘Employer-provided Training and Knowledge Spillovers: Evidence from Italian Local Labour Markets’, Regional Studies, 46:3, 339-353.
D’Agostino, G. and Scarlato, M. (2015), Innovation, Socio-institutional Conditions and Economic
Growth in the Italian Regions, Regional Studies, 49:9, 1514-1534, DOI:
10.1080/00343404.2013.838000
D'Antonio, M. and Scarlato, M. (2007) I Laureati del Mezzogiorno: una Risorsa Sottoutilizzata o Dispersa, Quaderni SVIMEZ, SVIMEZ, Roma.
De Blasio, G. and Nuzzo, G. (2010) ‘Historical traditions of civicness and local economic development’, Journal of Regional Science, 50:4, 833–857.
Dearden, L., Reed, H. and Van Reenen, J. (2006) ‘The Impact of Training on Productivity and Wages: Evidence from British Panel Data’, Oxford Bulletin of Economics and Statistics, 68, 397–421.
Detang-Dessendre, C. (1999) ‘Reciprocal link between exit from unemployment and geographical mobility’, Environment and Planning A, 31, 1417-1431.
Dias, J. and Tebaldi, E. (2012) ‘Institutions, human capital, and growth: the institutional mechanism’,
Structural Change and Economic Dynamics, 23, 300–312.
28 Etzo, I. (2011) ‘The determinants of the recent interregional migration flows in Italy: a panel data analysis’, Journal of Regional Science, 51, 948–966.
European Central Bank (2012) ‘Euro area labour markets and the crisis’, Occasional Papers
138/October 2012, https://www.ecb.europa.eu/pub/pdf/scpops/ecbocp138.pdf
Filippetti, A. and Guy, F. (2015) ‘Skills and Social Insurance: Evidence from the Relative Persistence of Innovation during the Financial Crisis in Europe’, Science and Public Policy, forthcoming, doi: 10.1093/scipol/scv036.
Fingleton, B., Garretsen, H. and Martin, R. (2015) ‘Shocking aspects of monetary union: the vulnerability of regions in Euroland’, Journal of Economic Geography, 15, 907–934.
Fouarge, D., Schils, T. and de Grip, A. (2013) ‘Why Do Low-Educated Workers Invest Less in Further Training?’, Applied Economics, 45, 2587–2601.
Gardiner, B., Martin, R., Sunley, P. and Tyler, P. (2013) ‘Spatially unbalanced growth in the British economy’, Journal of Economic Geography, 13, 889–928.
Gianmatteo, M. (2009) ‘L’indagine campionaria Isfol-Plus: contenuti metodologici e implementazione,’ Studi Isfol 2009/3, Collana Studi ISFOL: Rome.
Heckman, J. J. (1999) ‘Doing It Right: Job Training and Education’, Public Interest, 135, 86–107.
Hughes, G., O’Connell, P. J. and Williams, J. (2004) ‘Company Training and Low-Skill Consumer-Service Jobs in Ireland’, International Journal of Manpower, 25, 17–35.
Iammarino, S. (2005), ‘An evolutionary integrated view of regional systems of innovation. Concepts, measures and historical perspectives’, European Planning Studies, 13(4), 495–517.
Iammarino, S. and Marinelli, E. (2011) ‘Is the Grass Greener on the Other Side of the Fence? Graduate Mobility and Job Satisfaction in Italy’, Environment and Planning A, 43, 2761-2777.
ISFOL (2014) Rapporto di Monitoraggio del Mercato del Lavoro, ISFOL, Rome,
http://www.isfol.it/primo-piano/diffuso-il-rapporto-di-monitoraggio-isfol-2014
Iuzzolino, G., Pellegrini, G. and Viesti, G. (2013) ‘Regional convergence’, G. Toniolo (ed.), The Oxford Handbook of the Italian Economy Since Unification, 571-598, Oxford University Press, Oxford.
Kamnungwut, W., and Guy, F. (2012) ‘Knowledge in the air and cooperation among firms: traditions of secrecy and the reluctant emergence of specialization in the ceramic manufacturing district of Lampang, Thailand, Environment and Planning A, 44 (7):1679 – 1695.
Klepper, S. (2011) ‘Nano-economics, spinoffs, and the wealth of regions’, Small Business Economics,
37 (2):141-154.
29 Kuckulenz, A. and Zwick, T. (2003) ‘The Impact of Training on Earnings: Differences between
Participant Groups and Training Forms’, ZEW Discussion Papers No. 03-57,
http://www.econstor.eu/bitstream/10419/23990/1/dp0357.pdf
Lazerson, M.H. and Lorenzoni, G. (1999) ‘The firms that feed industrial districts: A return to the Italian source’, Industrial and Corporate Change, 8 (2), 235-266.
Leuven, E. (2005) ‘The Economics of Private Sector Training: A Survey of the Literature’, Journal of Economic Surveys, 19, 91–111.
Lynch, L. M. and Black, S. E. (1998) ‘Beyond the Incidence of Employer-Provided Training’, Indus. & Lab. Rel. Rev., 52, 64-81.
Mandrone, E., Radicchia, D (2012) ‘Indagine Plus : il mondo del lavoro tra forma e sostanza : terza annualità / ISFOL - 475 p. I libri del Fondo sociale europeo ; 167, Rubbettino.
Mandrone, E., Radicchia, D. (2006) ‘Plus, Participation Labour Unemployment Survey. Indagine campionaria nazionale sulle caratteristiche e le aspettative degli individui sul lavoro’, I Libri del FSE; Rubettino.
Marinelli, E. (2013) ‘Sub-national graduate mobility and knowledge flows: An exploratory analysis of onward-and return-migrants in Italy’, Regional Studies, 47 (10), 1618-1633.
Martin, R. (2011) ‘The Local Geographies of the Financial Crisis: From the Housing Bubble to Economic Recession and beyond’, Journal of Economic Geography, 11, 587–618.
Martin, R. (2012) ‘Regional economic resilience, hysteresis and recessionary shocks’, Journal of Economic Geography, 12, 1–32.
Mauro, L. and Pigliaru, F. (2011) ‘Social Capital, Institutions and Growth: Further Lessons from the Italian Regional Divide’, Centro Ricerche Economiche Nord Sud-CRENoS Working Paper # 3, University of Cagliari, Cagliari.
Meliciani, V. and Radicchia, D. (2011) ‘The informal recruitment channel and the quality of job-worker matches: an analysis on Italian survey data’, Industrial and Corporate Change, 20 (2): 511-554.
Meliciani, V. and Radicchia, D. (2014) ‘Informal networks, spatial mobility and overeducation in the Italian labour market’, paper presented at the CIMR Workshop on Scientific Labour Markets and Innovation Systems, CIMR, Birkbeck College, London, 4 July 2014.
Nelson, R. and Phelps, E. (1966) ‘Investment in Humans, Technological Diffusion and Economic Growth’, American Economic Review, 56, 69–75.
Ok, W. and Tergeist, P. (2003) ‘Improving Workers’ Skills: Analytical Evidence and the Role of the Social Partners’, OECD Publishing, Paris.
30 Peck, J.A. and Haughton, G.F. (1991) ‘Youth training and the local reconstruction of skill: evidence from the engineering industry of North West England, 1981-88’, Environment and Planning A, 23, 813-832.
Piras, R. (2005) ‘Il contenuto di capitale umano dei flussi migratori interregionali: 1980-2002’, Politica economica, 21, 461-491
Piras, R. (2006) ‘I Movimenti Migratori Interregional per Titolo di Studio: una Stima dei Tassi Migratori ed un’Analisi dei Flussi’. Studi di Emigrazione, 43, 153-170.
Putnam, R. D. (1993) Making Democracy Work: Civic Traditions in Modern Italy, Princeton, Princeton University Press.
Pyke, F., Becattini, G. and Sengenberger, W. (eds) (1990) Industrial Districts and Inter-Firm Co-operation in Italy, ILO, Geneva.
Rutherford, T.D. (2001) ‘The state of training: learning, institutional innovation, and local boards for training and adjustment in Ontario, Canada’, Environment and Planning A, 33, 1871-1891.
Sanders, J. and de Grip, A. (2004) ‘Training, Task Flexibility and the Employability of Low-Skilled Workers’, International Journal of Manpower, 25, 73–89.
Scarpetta, S., Sonnet, A. and Manfredi, T. (2010) ‘Rising Youth Unemployment During The Crisis: How to Prevent Negative Long-term Consequences on a Generation?’, OECD Social, Employment and Migration Working Papers, No. 106, OECD Publishing, http://dx.doi.org/10.1787/5kmh79zb2mmv-en
Sepulveda, F. (2002) ‘Training and Business Cycles’, Michigan State University.
Shuttleworth, I., Tyler, P. and McKinstry, D. (2005) ‘Redundancy, readjustment, and employability: what can we learn from the 2000 Harland &Wolff redundancy?’, Environment and Planning A, 37, 1651-1668.
Sianesi, B. (2008) ‘Differential effects of active labour market programs for the unemployed’, Labour Economics, 15:3, 370–399.
Sunley, P., Martin, R. and Nativel, C. (2001) `Mapping the New Deal: local disparities in the performance of welfare-to-work', Transactions of the Institute of British Geographers, 26, 484-512.
Tabellini, G. (2010) ‘Culture and Institutions: Economic Development in the Regions of Europe’,
Journal of the European Economic Association, 8: 4, 360-432.
Teulings, C. and Koopmanschap, M. (1989) ‘An Econometric Model of Crowding out of Lower Education Levels’, European Economic Review, 33, 1653–1664.
Thurow, L. C. (1975) Generating Inequality: The Distributional mechanisms of the economy, National Technical Information Service.
31 Trigilia, C. and Burroni, (2009) ‘Italy: rise, decline and restructuring of a regionalized capitalism’,
Economy and Society, 38:4, 630-653.
Turok, I. and Edge, N. (1999) The Jobs Gap in Britain's Cities: Employment Loss and Labour Market Consequences, Policy Press, Bristol.
Van Ours, J. C. and Ridder, G. (1995) ‘Job Matching and Job Competition: Are Lower Educated Workers at the Back of Job Queues?’, European Economic Review, 39, 1717–1731.