Community Structure based on Node Traffic in Networks
Abhineet Anand
University of Petroleum & Energy Studies
Dehradun
Vikas Kr. Sihag
Central University Ajmer
P. S. V. S. Sridhar
University of Petroleum & Energy Studies
Dehradun
ABSTRACT
Finding community structure in networks has been always the prerequisite for the analysis of network structure and its properties. Based on node traffic, an efficient method for calculating betweenness measure is proposed. It is used iteratively to remove edges with high betweenness score from the network, thus splitting network into communities. The score is recalculated after each removal. The algorithm is best suited for networks with traffic generation capabilities.
Keywords
Betweenness measure, Community structure, Node traffic.
1. INTRODUCTION
The problem of graph clustering, at first sight stresses on grouping nodes in a network into sets called clusters. A quality cluster, comprises of more edges within the cluster than edges linking nodes of the cluster with the rest of the community. The ability to find and analyze such clusters can be of great significance in understanding and visualizing network structures. Community detection in networks has attracted a lot of attention in past years. Various methods have been developed to detect community structure. This paper concerns about networks with traffic generation capabilities for example communication networks. Suppose there are number of nodes interconnected with each other, trying to communicate. It is required to find the best suitable path for a node to communicate with its counterpart located either within or outside its community.
Identification of structural clusters is possible only for sparse graphs i.e. number of edges n is of the order of number of nodes n of the graph.
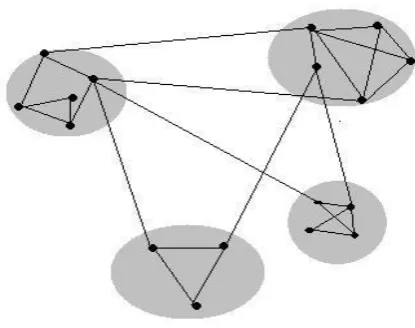
[image:1.595.324.532.203.367.2]Social communities exist since long time and the grouping pattern of humans has been studied for long time in different platform. Stuart Rice arranged data manually to understand political blocs in the 1920’s. George Homans shows the use of arranging the matrix of data for understanding underlying structure in 1950s. Social Communities has been present everywhere, arranging the animals for different propose or in social organization in every type of human society: group of hunter, royal families, towns, political and business structure, countries, and even virtual communities like different social networking websites [3]. Sociologist Mark Granovetter wrote in 1973, “Large scale statistical, as well as qualitative, studies offer a good deal of insight into such macro phenomena as social mobility, community organization, and political structure... But how interaction in small groups aggregates to form large-scale patterns eludes us in most cases[3]”.
Figure 1: Small Network containing 4 sub-groups
Very soon it was found that a very powerful mathematical and large data scalable tool is required and that was a challenging problem. It was very much solved by Michelle Girvan and Mark Newman by graph-partitioning problem solution [1, 4, 5], which brings the attention of scientist from statistical physics and mathematical communities. After that algorithm, since last seven years there was much research and discussion has been done based on the topic. The study of this topic is termed as Community structure.
The study of community structure is also required in computer science and graph theory to solve the problem like intercommunicating computer processors, where the processors may not required communicating with all others. The work and solution of those problems can be illustrated with the help of graph or network, in which vertices are the processes and communication will be presented as edges. In this case, the community structure can be used to find the solution which will minimize the inter-processor communication. Many algorithm have been suggested to solve the problem are trying to discuss few of them in next section.
Motivation
There are number of approaches and tools available to generate Community Structure. It proposes and study a set of algorithm for discovering community structure in networks - Natural Division of network nodes into densely connected subgroup. It is also analyzing to propose number of cluster which should be proposed. It is using the modularity of graph.
Outline
approaches; Section 3 describes the approach to proposed work and practical implementation on the algorithm on a graph. This section discussing how to check the quality of cluster formed by our algorithm. The next section shows the different result of algorithm. It’s showing the resultant clusters after the clustering of network. The proposed algorithm has been applied on the artificially generated network and real world problem of Zackary’s Karate club.
2. RELEVANT WORK:
As discussed in the previous section, the community structure has been quite in use, in past also and been discussed in every era of life. It has been seen in the sociology that how the political bloc are formed or in the form of social communities. It has been implanted in the various mathematical problem and graph-partitioning problem also. Now, it has also been used in the distributed environment for the inter-processor communication also.
While in the divisive approach it will start with the complete graph and ends with the particular community are looking for. For that it will try to find out least similar connected pair of vertex and remove that edge from the graph.
In the uncertain world of network is very hard to find out community structure, as it typically unknown and uneven. Again, scalability will be measure issue, because the algorithm suitable for small network doesn’t respond for large one. There are various scientists who tried to propose the better algorithm to find the structure of community. In the line of different algorithm are trying to propose a different approach to solve it. Before going for new one have a look on the previously proposed algorithms.
2.1 Graph Theory notions and notation
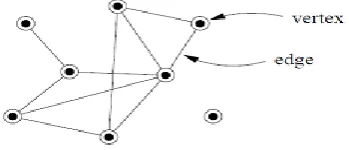
A graph is the abstract representation of a set V of N entities along with their corresponding M connections D; each individual or node or vertex is linked to a subsetof V via a collection of M edges M. An example graph is shown in Fig 1.
Recently, complex networks have attracted considerable attention in many fields for representation of a variety of complex systems, such as biological and social systems, the Internet, the World Wide Web, and so on. Community structure is an important property of complex networks, which is the tendency for nodes to divide into groups, with dense connections within groups and only sparse connections between them. A large number of methods have been developed to detect community structure in networks in the past years.
The very first one which can be discussed here is the divisive approach, the minimum-cut method, in which the network is divided into predefined parts in approximately same size of network. The algorithm work well in the case for which it was intended, but, when it have fixed part and static kind of network this algorithm does not work[15].
The next approach which came in discussion was hierarchical clustering which measure topological type of similarity between pairs of node. Few of the commonly used measure included the cosine similarity, the Jaccard (statistic used for comparing the similarity) and hamming distance between the rows of the adjacency matrix. After this, two simplest
approaches can be used for grouping: Single-Linkage clustering, Complex-linkage clustering among other like k-means clustering, neural network clustering [2, 3].
Next mile stone may be taken as contribution of Brian
Kernighan and Shen Lin in 1970[2,3], which showed that the node in different board can be linked to each other using least number of connections. This algorithm also works on divisive approach, which use to take the complete graph and divide them in two groups of predefined size. The algorithm then swaps subsets containing equal number of vertices between two graphs. But, portioning of network strongly depends on the initial position of the networks.
The most important contribution from the field of computer science was done by Michalle Girvan and Mark Newman in year 2002, which mainly work on sociological notion of betweenness centrality[1,4,5].The identification of particular edge is performed with the help of graph-theoretic measure, which assign a values if the edge lies between pairs of nodes. Betweenness can be find out using two approaches: shortest path or densities of random walks. This algorithm identifies edges in a network that lies between communities and then removes them, leaving behind just the communities themselves. The Girvan-Newman algorithm gives the result very correctly and of reasonable quality. It has been used in many real life examples.
The next development in this field was considered as
Modularity Optimization, which uses very popular quality function ‘modularity’: measure quality of portion of network into communities. This function is an instance of the famous MAX-Cut problem [], which is a NP-complete problem. After this description, there are several ways through which this optimization was been shown. The first definition of modularity, partition of an un-weighted and undirected network has been done into the communities. But, optimization fails in that case when it will have cluster smaller than some scale and difference between partition with high modularity and absolute maximum. One of the greedy maximization method, which gives excellent result for various application is Louvian method and used widely, so.
There are various approaches which have been proposed to detect community structure on different basis. There are mainly two kinds of clustering algorithms, one is partitioning algorithm, and the other is the hierarchical clustering method. The Kernighan – Lin algorithm, hierarchical clustering algorithm, Girvan and Newman, Modularity Optimization are the important algorithm which are also discussed in this context.
3. PROPOSED WORK
This section provides an overview of the network theory notions and utilization for study of the basic approaches to community detection. It will start from a purely mathematical level describing main notions and notation and proceed by expanding our view to inter disciplinary problem of defining assessing the community structure of a network. It describes proposed method and shows the implementation on an artificially generated random network. Main ideas such as the modularity are introduced further.
adjacency relation defined by the edges is symmetric, or E $\subseteq \{(u,v) | u, v ∈ V\}$ (sets of vertices rather than ordered pairs). If the graph does not allow self-loops, adjacency is irreflexive. An example graph is shown in Fig 2.
Figure 2: A simple graph with Eight Vertices and Ten Edges
This paper proposes a new algorithm for creating community structure whose complexity betters the existing algorithm. The main idea of the algorithm is that it reduces the leaf nodes from the graph and then calculates the edge betweenness based on node traffic. The algorithm includes “recalculation step”. Remove the leaf nodes before calculating the betweenness measure. This says that after each cycle, all the leaf should be removed and the betweenness measure has to be recalculated. The general form of the said algorithm is as follows:
(i) Remove all the leaf nodes
(ii) Find betweenness measure of all edges. (iii) Removes the edge with highest betweenness (iv) Repeat the steps from step 1.
This proposed algorithm trying to reduce the complexity of algorithm. For which it is generating new graph from the available one by cutting down the leaf nodes. After which the size of graph reduces much and the complexity of algorithm will also reduce.
To remove the leaf nodes in graph it is considering all the nodes of graphs. Initially, all the nodes have given weight=1. Now, using a breath first search method will start assigning weight to non-leaf nodes by adding summation of all leaf nodes. Now, it will remove all the nodes whose degree is 1. Before removable of the node the value of these nodes should be added to the summation of non leaf nodes.
The theoretical description of the algorithm is defined in the previous section which have followed here in this paper. Practical implementation of this algorithm is discussed in this section.
This algorithm will calculate the edge betweenness measure based on geodesic paths like the earlier algorithms. For all edges complexity of earlier algorithm is O(mn2) operation on a graph. Then, the recent algorithm, by Newman [5] using shortest path and breath-first search who’s complexity reduces to O(mn). Now, it is trying to reduce it further more which is shown in results in our next section with the help of the graphs and dendogram.
In the previous algorithm the vertex betweenness [16], multiple paths are assigned equal weights by summing 1. The edge betweenness measure has been assigned. The score of edge is assigned by dividing them into equal part to multiple shortest paths.
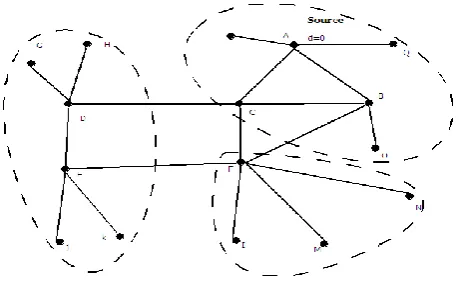
Consider the figure 2 on which performing our algorithm by considering S as source. It will carry out following steps:
Step 1. : For all node with degree>1 follow step 2, 3. Step 2. : Assign tvalue and delete leaf nodes for each node.
Step 3. : Assign d values for each node.
Step 4. : From farthest node to source calculate edge betweenness by following formula
Figure 2.1: Betweeness Measure
Figure 3: Calculation of shortest path betweenness
Figure 3.1: After removal of leaf nodes
So, in this example betweenness may be calculated as
where δ is number of neighbor towards source. Breath-first search can find shortest paths from a single vertex s to all others in time O(m). Normally when there is only one shortest path to the sink.
[image:3.595.80.255.142.217.2]traffic of leaf node to the non leaf nodes by summing the traffic of leaf node to the non leaf node. As shown in the figure node A is assigned traffic tA= 2 and so on at node B tB =3, at Node C tC =2, at node D tD =4, at node E tE =3 and at node F tF =4.
Betweenness can be calculated by following formula
As in case of node x, it can calculate the Score as .
Now, to calculate the edge Betweenness from all shortest paths betweenness measure for different edge will come as shown in figure. Like betweenness bEF= bED=3/2. So on,
betweenness value of different edges are shown in the figure above. It has to repeat the calculation for each edge removed from the network. After removable of each edge are deducting the leaf nodes, which reduces the time complexity for the algorithm in comparison to previous algorithms.
Network with strong community structure often break apart into separate components quite early in the progress of the algorithm, substantially reducing the amount of the work that needs to be done on the computational complexity of the algorithm. Some networks are directed, i.e. their edges run in one direction only. Like in World Wide Web links in web page point in one direction only. It can imagine a generalization of shortest path betweenness by counting only those paths that travel in the forward direction along edges. It can find, therefore, that our algorithm applied to the undirected version as well as directed version of the networks, and no special algorithm is required for the either case.
3.1 Quantifying the strength of Community
Structure
The proposed algorithm detects good communities both in artificially generated random network and in real – world examples. However, practically how many communities should be generated using the algorithm is not known ahead of time. So the problem is how to grade the algorithm? Algorithms always produce some division of network into communities, even in completely random networks that have no meaning community structure. So, it is to find some way of getting good structure. Normally, the algorithm output is in form of dendogram which represents an entire nested hierarchy of possible community division for the network. To find out the best one for a given network, dendogram is divided to get a sensible division of network.
To define a measure of the quality of a particular division of a network, modularity has been used. Consider a particular division of a network into k communities. Let us define k X k symmetric matrix e whose element eij is the fraction of all
edges in the network that link vertices in community I to the vertices in community j. The modularity is calculated taking all edges in to consideration i.e. edges which have been removed by community structure algorithm. The trace of this matrix Tr e=∑I eij gives the fraction of edges in the network
that connect vertices in the same community, and a good division is high value of trace. The trace on its own is not a good indicator of the quality of division. So, the sum of row
or column ai =∑jeij , which represent the fraction of edges fall
[image:4.595.321.551.397.541.2]between vertices without regard for the communities they belong to, it would have eij=aiaj. Thus modularity measure
Where ||X|| indicates the sum of the elements of the matrix x. it measures the fraction of edges in the network that connect vertices of the same type(within community edges) minus the expected value of the same quantity in a network with the same community divisions but random connections between the vertices. If the number of within – community edges is no better than random, then Q=0. Values approaching Q =1, which is maximum, indicate networks with strong community structure.
4. APPLICATION
In this section, it will give a number of applications of our algorithms to particular problem, illustrating their operation and their use in understanding the structure of Complex networks.
Artificially Generated Random Network
Our community structure algorithm do an excellent job of recovering known communities both in artificially generated random network and in real world Example. The algorithm is applied on this artificially generated graph which has discussed in earlier. By using the modularity function, it is divided in to three different communities as shown in figure.Figure: Artificially Generated Random Network which is having 16 nodes
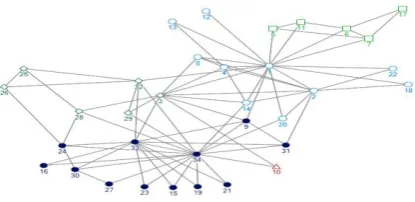
Zachary’s Karate Club Network
Figure 4: Zachary's Karate Club Network which is having 34 nodes represting the members of club and
[image:5.595.63.269.80.174.2]administrator
Figure 4.1: Community Structure in the karate club network. Dendogram extracted by our method and
resulting modularity.
Figure 4 shows the consensus network structure of Zachary’s club before the split. Feeding this into our algorithm, it will find the result shown in the figure4.2. Figure 4.1 shows the dendogram, which represents the network into the layers architecture that at what level the different members of club are associated with each other. Links between the different members are shown with the help of bar association and the vertical bar shows the different communities of the network. This is also shown with the help of graph in figure4.2. it is clearly showing that the network is divided into to four communities in which two community is major which are associated with node 1 which is representing the administrator and node 33 which is representing the main trainer of the club. The members those are associated with the administrator are represented by circle and members associated with trainer are represented with the help of filled circle. Two other communities are also there which is not closely connected with any of the group of club.
Figure 4.2 : Zachary's karate club After the classification done by our Algorithm
This is discussing application and result of approach on different artificially generated random network and real world problem. It has been seen with the help of these example that algorithm works quite well in the different situation. Quantifying the strength of Community Structure gives best level of communities in the given network.
5. CONCLUSION
This approach is a new class of algorithms for performing network clustering, the task of extracting the natural community structure from networks of vertices and edges. It is simple, intuitive and demonstrably give excellent result on networks for which the structure of community is known ahead of time. The approach discussed, is different form the previous approaches. It doesn't calculate the betweenness measure for the leaf node. It passes the traffic of these nodes to the non- leaf nodes. And so reduces they complexity of the algorithm. This algorithm includes a recalculation step in which betweeness score are revaluated after the removal of every edge. Then, the quality of the cluster is evaluated with the help of modularity function.
The implementation of algorithm has demonstrated the efficacy and utility of our method with a number of examples. It has been shown that it is reliable and sensitively extracts community structure from artificially generated networks with known communities. It has been also applied to real-world networks with known community structure.
[image:5.595.53.267.241.336.2]6. REFERENCES
[1] M. Girvan and M. E. J. Newman (2002). "Community structure in social and biological networks". Proc. Natl. Acad. Sci. USA 99 (12): 7821–7826. doi:10.1073/pnas.122653799. PMC 122977. PMID 12060727.
[2] S. Fortunato (2010). "Community detection in graphs". Phys. Rep. 486 (3-5): 75–174. doi: 10.1016/j.physrep.2009.11.002.
[3] M. A. Porter, J.-P. Onnela and P. J. Mucha (2009). "Communities in Networks". Not. Amer. Math. Soc. 56: 1082–1097, 1164–1166.
[4] M. E. J. Newman (2004). "Detecting community structure in networks". Eur. Phys. J. B 38 (2): 321–330. doi:10.1140/epjb/e2004-00124-y.
[5] M. E. J. Newman (2004). "Fast algorithm for detecting community structure in networks". Phys. Rev. E 69 (6): 066133. doi:10.1103/PhysRevE.69.066133.
[6] L. Danon, J. Duch, A. Díaz-Guilera and A. Arenas (2005). "Comparing community structure identification". J. Stat. Mech. 2005 (09): P09008. doi:10.1088/1742-5468/2005/09/P09008.
[7] S. Fortunato and M. Barthelemy (2007). "Resolution limit in community detection". Proceedings of the National Academy of Science of the USA 104 (1): 36– 41. doi:10.1073/pnas.0605965104. PMC 1765466. PMID 17190818.
[8] B. H. Good, Y.-A. de Montjoye and A. Clauset (2010). "The performance of modularity maximization in practical contexts". Phys. Rev. E 81 (4): 046106. doi:10.1103/PhysRevE.81.046106.
[9] V.D. Blondel, J.-L. Guillaume, R. Lambiotte and E. Lefebvre (2008). "Fast unfolding of community hierarchies in large networks". J. Stat. Mech. 2008 (10): P10008. doi:10.1088/1742-5468/2008/10/P10008.
[10] M.G. Everett and S.P. Borgatti (1998). "Analyzing Clique Overlap Connections". Connections 21: 49.
[11] T.S. Evans (2010). "Clique Graphs and Overlapping Communities". J. Stat. Mech.: P12037. arXiv:arXiv:1009.0638. doi:10.1088/1742-5468/2010/12/P12037.
[12] G. Palla, I. Derényi, I. Farkas and T. Vicsek (2005). "Uncovering the overlapping community structure of complex networks in nature and society". Nature 435 (7043): 814–818. doi:10.1038/nature03607. PMID 15944704.
[13] Condon, A.; Karp, R. M. (2001). "Algorithms for graph partitioning on the planted partition model". Random Struct. Algor. 18 (2): 116–140. doi:10.1002/1098-2418(200103)18:2<116::AID-RSA1001>3.0.CO;2-2.
[14] Lancichinetti, S. Fortunato and F. Radicchi (2008). "Benchmark graphs for testing community detection algorithms". Phys. Rev. E 78 (4): 046110. doi:10.1103/PhysRevE.78.046110.
[15] Mechthild Stoer and Frank Wagner, “A simple Min-Cut Algorithm”. Proceedings of the 2nd
Annual European symposium on Algorithms. Lecture Notes in Computer Science, Vol 855,1994.