The Optimization of Inter cell Handover Dynamics in a
GSM Network
A. Galadima
PG Student, Department ofElectrical and Computer Engineering,
Ahmadu Bello University, Zaria
D. D. Dajab
Senior Lecturer, Department of Electrical and Computer
Engineering,
Ahmadu Bello University, Zaria Nigeria
B. G. Bajoga
Professor, Department ofElectrical and Computer Engineering,
Ahmadu Bello University, Zaria Nigeria
ABSTRACT
Efficient Handover mechanism in a GSM network is one of the parameters critical to GSM network service quality (QoS) and customer satisfaction. Ongoing calls are being transferred through the process of handover from one cell to another as the users move through the coverage areas of the cellular systems. This research focuses on analyzing and optimizing intercell handover dynamics in Airtel Network in Kano. A three months call record sample data was used. Average call drop rate per cell was predicted to be six (6%). An optimal solution was provided using dynamic cutoff priority channel allocation scheme, this improves performance of handover dynamics when simulated. An object oriented simulation technique was employed using a JAVA variant NETBEANS 6.1 because of its moderate system resource requirement, fast and responsive user interface. The result shows that handover failure rate was reduced by an average of Ninety percent (90%) for varying loads. System validation was achieved by comparing the real and simulated load characteristics which produced striking similarities with a correlation coefficient of 0.9122.
General Terms
GSM network service quality (QoS), Efficient Handover mechanism, optimizing intercell handover dynamics
Keywords
Optimization, dynamic cutoff priority, channel allocation scheme, NETBEANS 6.1
1.
INTRODUCTION
Global System for Mobile Communications (GSM) is a wireless digital network standard that is designed by standardization committees majorlyfrom Europe operators and manufacturers in telecommunications. The GSM network provides compatible services and capabilities to all its mobile users acrossseveral million customers worldwide as well as Europe [1]. The process of handover within any cellular system is of great importance, if performed incorrectly will lead to the process of loss of calls and this makes it a really critical process. One of the key elements of a mobile cellular telecommunications system is the split of the coverage area into many small cells providing good spectrum utilization and coverage [2]. However, as the mobile users from one cell to another which is most times the case, it must be possible to retain the connection without having a drop call.
In densely populated cities like Kano, where users mobility are high, intercell handover requests significantly increase too and this results in traffic loading and could degrade QoS.
Channel allocation schemes should be properly chosen and performed if not, efficiently performed can lead to a higher intercell handovers as well.In this paper, the optimization of handover calls is made using a simulated cutoff priority based performance model.
2.
BACKGROUND
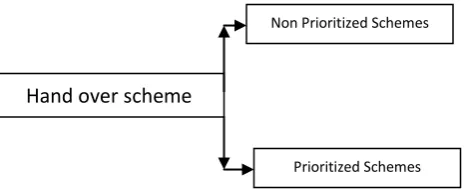
[image:1.595.319.552.381.476.2]The handoff process is managed by a method called the handoff schemes and it should be done with much interest and focus. The handoff schemes can be broadly classified into Non-Prioritized and Prioritized Schemes [3], [4]. Figure 1 is a broad categorization of handover schemes in practice.
Figure 1: Categorization of Handover schemes
2.1
The non-prioritized scheme (NPS)
This scheme has been employed by typical radio technologies and it is proposed for the Personal Communication Systems (PCS) operating in the band of 2GHz [5]. This scheme does not differentiate between initial and handover calls (new or originating) request. Thus, it treats either an originating or a handoff call request the same way, as long as, there is a channel available in the cell. If there are no available channels, the request is immediately blocked. The major disadvantage with this scheme is that, forced termination probability is relatively higher than it is normally anticipated since no priority is given to handoff request calls over originating calls [6]. However, for these requirements to be satisfied simultaneously, tradeoffs among all of them are carried out. From the user’s perspective, the termination of an ongoing call is more annoying than the blocking of a new call [5]. In other words, the handover blocking and the forced termination probabilities have to be minimized to provide customer the satisfaction they require. To achieve these requirements several others handover prioritizing schemes have been proposed [7].
2.2
Prioritization Schemes
This basically gives priority to handoverrequests procedureto a new call request [7]. Handoff prioritization schemes provide
Hand over scheme
Non Prioritized Schemes
improved performance at the expense of a reduction in the total admitted traffic and an increase in the blocking probability of new calls [7]. However, the improvement in performance is becoming a necessity. These handoff prioritization schemes may be further classified into Channel Reservation, Handover Queuing, Channel Transferred, Sub Rating, Genetic and Hybrid.
2.3 Channel Allocation
The bandwidth availabilityof cellular system is limited [8]. In general, the total bandwidth available is divided permanently into a number of channels which are allocated to cells without the violationof the minimum reusable distance constraint. Cells now use the allocated channels for call handling. Cellular communication systems exploit the advantage of channel reuse for better utilization of the available channel, by using same channel simultaneously in different cells, separated physically to at least minimum reusable distancethat calls do not interfere with one another. In channel allocation, multiplexing, the basic concepts of data communication is used since Multiplexing uses the idea of allowing several transmitters send information simultaneously over a single communication channel, this concept (multiplexing), allows many users share a bandwidth of frequencies [9].
2.4 Channel Allocation Schemes
Many schemes have been proposed for channel allocation in the last few decades, these schemes can be divided into a number of different categories on the basis of comparison of strategies as well as channel allocation [10].
2.4.1 Fixed channel allocation scheme
The Fixed Channel Allocation (FCA) scheme permanently allocates channels to cells in a way that the channel reuse constraint cannot in any way be violated even if all channels of all cells are simultaneously being used. One of the advantages of FCA scheme is its simplicity; the scheme is not adaptive to changing traffic conditions which is a drawback. One major disadvantage of the FCA scheme is that the calls are blocked if the number of calls exceeds the number of channels assigned to a cell even if there exist free channels in the neighboring base stations [10].
2.4.2 Dynamic channel allocation (DCA) scheme
In DCA scheme, channels are dynamically assigned to the cells and are used [10]. The Contrasts of FCA is being solved in the DCA. In the DCA, available channels are reserved in a global pool from which channels are allocated to the cells on demand based on their need. In DCA, channels are not being owned by any base station and a channel is released back to the base station to the central pool when a call is completed. In the situations when call density in few cells are higher compared to other cells in the system, the high call density cells can be assigned more channels than other low call density cells. This therefore helps in minimizing the call blocking rate in these high call density cells. In DCA scheme [10], channels are thus allocated in real-time based on the actual cell conditions through real-time computation to make decision about allocation of channels.This channel readjustment process requires a lot of communication and information exchange among cell making the DCA to be implemented in a way that it requires the minimum information exchange among base stations in order to reduce the signaling overhead and complexity.2.4.3 Hybrid channel allocation scheme
Hybrid channel allocation (HCA) is a combination of FCA and DCA schemes. In HCA, advantages of both FCA and DCA are exploited. HCA scheme allocates some channels statically and other channels dynamically. In HCA schemes [11], total channels of mobile cellular system are partitioned into fixed and dynamic sets. The channels included in the fixed set are assigned to each cell through the FCA schemes. Whereas, the dynamic set of channels is shared by the base stations. The channel allocation procedure from the dynamic set can be used by any of the DCA strategies. When a mobile host needs a channel for its call, and all the channels in the fixed set are busy, then a request from the dynamic set is made. In HCA scheme, the ratio of the number of fixed and dynamic channels plays an important role in deciding QoS of the system [11]. Channel allocation schemes can be implemented in different ways. While allocating a channel to a base station, information regarding the system and network condition is required. This information can be a priori pattern of users, current information about the status of network operations, and status of available channels.
2.5 Handover Management Schemes
There are many channel allocation management schemes [7] which focuses on handoff management and provisioning of good QoS and handover call handling. The aim of any handover management scheme is on how the forced termination probability of or call dropping can be minimized. Handover management schemes are designed to provide better QoS [10]. To minimize the call dropping probability, handoff calls need to be handled on priority basis, and for this, a fixed or dynamically adjustable numbers of channels are allocated to cells exclusively for handoff calls [12]. The following section itemizes and describes briefly various handover prioritization schemes.2.5.1 Channel reservation schemes (CRS)
The CRS offer a method to achieve successful handover requests by reserving a number of channels exclusively for handover requests. These schemes can be further divided into static and dynamic reservation schemes, depending on whether the set of reserved channels is fixed or varies according to the actual handover resource demand [12].
2.5.2 Channel transferred handover scheme
The key issue of this scheme is that in case that there are no available channels to accommodate a handover call request, a channel from a neighboring cell may be transferred. Upon handoff, the selection of the transferred channel may follow the two decision categories: the Channel Carrying Approach (CCA), that selects its current channel to carry it in the destination cell, and the Channel Borrowing Approach (CBA), that selects a new channel from the neighboring cells [12].
2.5.3
Sub-rating schemes
handover request so that the forced termination of calls can be virtually eliminated.
2.5.4
Genetic handover scheme (GHS)
A genetic algorithm is used by this scheme [7], in order to assign the channels using local state-based call admission double-threshold policies. The base station only keeps track of the state information of a small number of cells making decisions based on the abbreviated state information [13]. However, the time needed to assign channels for the GAS scheme is the main drawback of this scheme [13].
2.5.5 Hybrid handover scheme (HHS)
Hybrid Handoff Schemes (HHS) are combinations of channel reservation, handoff queuing, channel transferred, genetic and sub rating schemes [7]. The key idea is to combine the different prioritization policies in order to further decrease the blocking probabilities or to improvethe channel utilization.
3.
PROBLEM STATEMENT
In wireless cellular systems handover is key to mobility management and affects resource allocation. The handover process is expected to be successful, imperceptible and less frequent. Unsuccessful handover can be very annoying to subscribers. It terminates established connections forcefully leading to dropped calls and quality of service get degraded in the process.In densely populated cities like Kano, High intercell handover requests significantly increase traffic loading and could degrade QoS, cause higher call set up time, call drop and blocking probabilities than normal. Channel allocation schemes if not properly chosen and efficiently performed can lead to high intercell handovers as well. An Attempt to optimize handover calls is made using a simulated cutoff priority based performance model.
4.
METHODOLOGY
i. Simulate a Cut- priority model using an Object oriented techniques (Netbeans 6.1)
ii.
Validation through comparing the actual handover dropping probability derivable from processed data and simulated result.4.1
Predicting
Expected
Call
Drop
Probability from a Cell
A handoff could fail due to insufficient bandwidth in the new cell, and in such a case, the connection is dropped. The Call Dropping Probability (CDP) is a very important connection level QoS parameter. It represents the probability that a call is dropped due to a handoff failure. Another related parameter is the Handoff Dropping Probability (HDP). It represents the probability of a handoff failure due to insufficient available resources in the target cell. From both the user's and service provider's perspectives CDP is considered more crucial [14].
This and other works agree that the real user mobility is much more complicated than the traditionally used models like simple random motion models, i.e Random Way point model and the Road Topology model [15] to more sophisticated purposeful motion models like the Travelling Salesman Model , the Three Dimensional Model. In this work we assume that values for handover dropping probability are fixed for individual cells and assuming only the minimum number of handover during a call experienced by subscribers is considered independent of user trajectory between two
points i.e independent from the mobility model which means we are only interested in point when a call start begins and the point when a call ends. Attempt is made to predict call dropping probability bearing in mind aforementioned assumptions.
Call dropping probability (CDP) can be computed using equation 1 assuming the number of handovers during a call. This in a real network normally depends on one or more of factors such as: cell size, call duration, speed, direction.
Mathematically it is shown that, [14].
CDPAB =
= 1- ( 1)
Where HDP is handover dropping probability and the expression
(2)
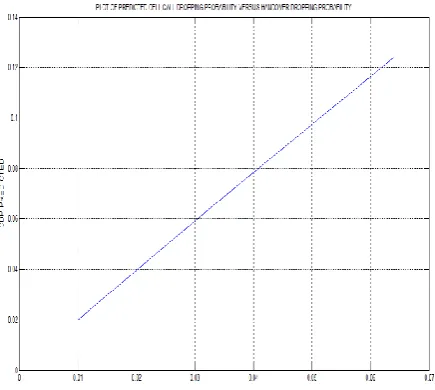
[image:3.595.320.538.459.654.2]The expression in (2) is the probability that the ith handover fails while all other previous handover succeeded. And is the total number of handover between two points A and B in space. In the next section, equation (1) will be adopted to analyse the data to predict the expected call dropping probability of cells using average values of handover dropping probability of each cell. Using MABLAB R2009b M-files and the results obtained Figure 2 was plotted. The plot in Figure 2 clearly presents a linear relationship between handover dropping probability and call dropping probability. It is worthy to note that the average call drop rate per cell is more than 6%. This means that at least six out of every hundred calls are dropped due to handover failure `this is quite significant considering the volume of calls.
Figure 2: Plot Predicted cell call dropping probability versus handover dropping Probability
observed that sixty four percent of the cells (64%) failed to achieve NCC recommended Handover Success Rate (i.e. =>98%).
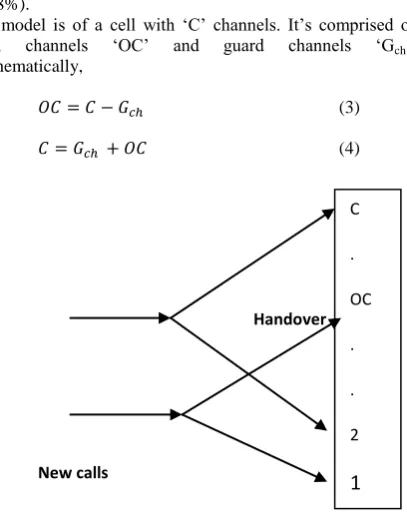
The model is of a cell with ‘C’ channels. It’s comprised of open channels ‘OC’ and guard channels ‘Gch’.
Mathematically,
(3)
(4)
Handover
[image:4.595.71.275.96.355.2]New calls
Figure 3: Channel allocation model with priority for handover (Alagu and Meyyappan, 2012)
The channel allocation model in Figure 3 depicts how channels are allocated to handover and new calls. From equation 4 open channels are less the number of total channels by a number called guard channels (cutoff priority). For effective use of channel resources less number of guard channels is allocated to handover calls at low traffic load than at high traffic load periods [16]. This avoids wasting channel resources since guard channels serves only handover calls, hence denying new calls channel resources leading to unnecessary revenue loss.
Priority is given to handover request by assigning a set number of channel(s) (Gch) exclusively for handover request
among total number of channels ‘C’ in a cell. The remaining channels referred to here as open channels (OC) which is equal to (C – Gch) are shared and competed for by both new
and handover call requests. A Handover call is admitted as long as there is a channel available and is blocked when all channels are occupied. Whereas a new call is blocked when available channels is/are less than open channels.
The channel allocation model with cut-off priority for handover used in the simulation initially allocates a set number of channels referred to as guard channels (Gch) and dynamically alters guard channels based on the handover failure rate according to equations 5 and 6
(5)
(6)
Where Hf is ratio of handover failure rate to total handover,
Au and Ad are numbers choosen between 0<1 by choosing
this values less than one the Algorithm try to keep the handover blocking rate below its given threshold. Th is a
threshold of handover blocking probability.
The simulation system generates both handover and new calls according to Poisson process [17] this is to match the discrete nature of both handover and new calls.
The initial assignment of guard channels is done with a view to getting minimum values of both new call blocking probability and handover blocking probabilities which are key factors in getting good quality of service (QoS).
4.3 Dynamic Cutoff Priority Channel
Allocation Scheme (DCCAS)
The dynamic cutoff priority channel scheme (DCCAS) is developed by integrating two algorithms one according to [16] and the other according to [18]. Integrating the two Algorithms enable us to overcome the weakness of Algorithm I that is reported to easily and frequently change threshold [18]. Algorithm II is reported to improve system adaptability to different traffic and has a very good system response characteristic. Also, the probability based adaptive nature of Algorithm II ensures that the integrated algorithm does not frequently change thresholds.
4.3.1
Algorithm
I:
dynamic
channel
allocation scheme (DCAS)
Alagu and Meyyapa (2012) DCAS (t, C)// the algorithm takes time period and channels as input Input (t,C)
{
Co=C-GCh
For every handoff call request Do {
If Oc< C, then {
Hc = Hc + 1 and grant admission Oc = Oc +1
}
Otherwise, Pf = Pf +1 and reject. }
For every new call request Do {
If Oc< Co, then {
Nc=Nc+1 and grant admission Oc = Oc +1
}
Otherwise, Pb = Pb +1 and reject. }
If a call is completed or handoff to another cell
{
Oc = Oc – 1
Check with MSC whether the ended call is handoff call or new originated call
If handoff call then Hc = Hc-1 Else Nc = Nc-1
}
If a handoff call is dropped and Pf/H >= AuTh then
{
GCh = min {GCh +1, Cmax} If Pf/H <= AdTh for N consecutive handoff calls, then
GCh = max {GCh – 1, Cmin} }
C
.
OC
.
.
2
Nc and Hc are reported to understand the successful handoff and new calls at a specified time period.
}//end of the algorithm:
4.3.2
Algorithms II: A probability-based
Adaptive algorithm for call control in
Wireless Networks (Weng et al, 2003)
Th threshold of HBP
H total amounts of handoff-call a,b two number between 0 and 1, and 0<a<b<1
rr=Dh/h // rr current actual HBP
rd=a*Th //lower limit of HBP, usually set rd=0.6 ru=b*Th //upper limit of HBP, usually set rd=0.98 Pinc=0.2 //prob. to increase threshold, usually Pinc<0.5
FOR each dropped-handoff-call DO if ( rr<=rd ) {
if(rand()>Pinc) Ch=max{Ch-1,Cmin} }else
if(rr>ru=){
if((rand()>(1-Pinc)) && (IsDropped())) Ch=min{Ch+1,Cmax}
} }
END FOR
4.3.3
Integrated
algorithm:
dynamic
cutoff priority channel allocation scheme
(DCCAS)
Input (t,C) { Initialize_timer Co=C-GCh
For each periodic timer, generate a call {
For every handoff call request Do {
ifOc< C, then {
Hc = Hc + 1 and grant admission Oc = Oc +1
Wait till handoff call ended Release channel
}
Otherwise, {
Pf = Pf +1 and reject. Compute current HPB FOR each dropped-handoff-call DO
if (current HPB >= upper_limit then) {
if(rand()>Pinc) Ch=max{Ch-1,Cmin} }
else if(rr>ru=){
if((rand()>(1-Pinc)) && (IsDropped()))
Ch=min{Ch+1,Cmax}
} }
}
For every new call request Do {
If Oc< Co, then {
Nc=Nc+1 and grant admission Oc = Oc +1
Wait until call ends Release channel }
Otherwise, {
Pb = Pb +1 and increment number of rejected call.
Reject new call }
}
If a call is completed or handoff to another cell {
Oc = Oc – 1
Check with MSC whether the ended call is handoff call or new originated call
If handoff call then Hc = Hc-1 Else Nc = Nc-1
} } END FOR
}//end of the algorithm:
The integrated algorithms here referred to as Dynamic cutoff priority channel allocation scheme (DCAS) used in developing the simulation flow chart as in Figure 3.2 and the coded simulation program in Appendix v. Integrating the Algorithms I and II enables us to provide solution to the weaknesses of Algorithm I earlier mentioned. Example, It is reported that after individual experimental trial of both algorithm I and II [16], Algorithm II reached steady state earlier, remained steady, and it also reduced new call blocking probability better than algorithm I. The probability based adaptive nature of algorithm II ensures that the integrated algorithm adapt easily to different traffic load therefore improving on the system response characteristics. The simulation takes in number of channels and time as inputs and other chosen simulation parameters.
The simulation program ensures that when a high handover failure rate is experienced, the number of guard channels determined through equations 5 and 6 are decreased or increased as the case may be. When the system does not use a significant portion of the guard channels and equation 6 is met the number of guard channels is gradually decreased until most of the guard channels are used frequently. In this way the handover blocking rate is expected to be controlled in most cases within NCC recommend threshold of less than or equal to 0.02.
4.4 Simulation
The simulation employed the use of a JAVA variant NETBEANS 6.1 which provided lower memory consumption, fast and responsive user interface than Eclipse and very robust built –in support. It also provides quick fixes and semantic checks these make it highly user friendly and it is not sluggish. The above features put Netbeans 6.1 above other possible candidates like ECLIPSE, J developer these unlike Netbeans 6.1 are sluggish, take more system resources and has less built –in support.
The coded program for the simulation was developed using the integrated Algorithm. The program trial ran repeatedly for total of 45000 seconds simulation time at each run.
5.
RESULTS
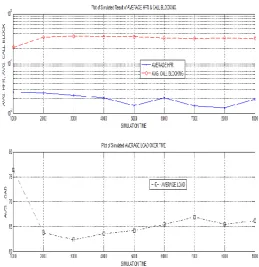
The test results as contained in Table 1 are computed averages of load, handover failure rates and call blocking probability after repeated trails for nine different simulation times. The result of Table 2 is further presented graphically in Figure 3. It was observed that load characteristic is similar to the real load as obtained (which is non-uniform) . It was observed also that average handover failure rates were far less than those obtained for the real system with percentage improvement on handover failure rate averaging over ninety (90%) in most cases.
Table 2 is a tabulation of real load, real handover failure rate both derived from obtained data, simulated load and simulated handover failure rate values. It can be observed that when real load and simulated loads are compared there are only slight differences in values and the two loads are non-uniform in nature as in Figure 4
[image:6.595.304.564.210.478.2]It can also be observed from Table 2 that handover failure rate was highly minimized. When load increases handover failure rate reduces this as a result of making the guard channel flexible thereby improving on channel resource utilization. Also it can be observed from Table 2 that simulated handover failure rate was ninety percent (90%) of time within NCC recommended standard of (<=0.02).
Table 1:Average simulated values
Time(Sec) Average
Load(Erl)
Average HFR
Average Call Blocking Probability
1000 76.343 0.0268 0.21
2000 63.707 0.0255 0.335
3000 62.252 0.023 0.355
4000 63.55 0.0205 0.344
5000 64.182 0.0143 0.344
6000 65.378 0.0205 0.325
7000 66.856 0.014 0.318
8000 65.419 0.013 0.329
9000 66.121 0.019 0.320
[image:6.595.303.568.536.686.2]Table 2: Comparison Between Real And Simulated Handover Failure Rate
Figure 3 Plot of simulated results for Average Handover failure rate, Call blocking and Load
Figure 4: Plot of average real and simulated loads.
The plots of Figure 4 are used to validate our simulation system. Both real average loads as derived from obtained data were plotted together with the simulated average loads. The plot shows a lot of similarities including being equal at Load (Erl)
Real
Load (Erl) Simulated
HFR Real HFR Simulated
60.606 62.252 1.405 0.02
65.789 65.373 0.995 0.026
83.186 81.841 1.788 0.009
72.927 66.856 7.281 0.01
various points and they are dynamic nature. A correlation coefficient was calculated using MATLAB to be 0.9122 which is quite significant and an indication that the two loads are very similar.
6.
CONCLUSION
Average call drop rate per cell was predicted to be six (6%). To improve performance a solution based on dynamic cutoff priority handover management scheme was developed. It initially presents a fixed set of cutoff priority channels and dynamically alters it based on the rate of handover failure and the traffic situation. These provide for optimum utilization of channel resources and maximize performance. Comparing the real Handover failure rates per cell and those obtained from simulation, an average performance improvement of Ninety (90%) was realized. This is a far better result when compared with the results obtained from evaluation of the existing system where sixty four (64%) percent of the cells did not achieve the NCC recommended standard for handover success rate (>=98%), while by simulation only an average of twenty percent (20%). Validation was achieved by comparing average real loads and simulated loads characteristics. A Correlation coefficient of 0.9122 was obtained which is quite significant and a validation of our simulation system.
7.
ACKNOWLEDGMENTS
The author Galadima Abednego Andiryawishes to acknowledge thesupport and guidance of Dajab D. Danjuma and Bajoga G. Buba as supervisors of his master thesis at Ahmadu Bello University, Zaria
8.
REFERENCES
[1] Ghaderi M., and Boutoba P., (2006). Call Admission Control in mobile cellular Networks. A Comprehensive Survey wireless communications and mobile computing, Vol. 6(1) pp 69-93 Available from htt://bcr2.u waterloo.ca/arboutaba/papers/journals/wcmc.0.4pd47 (retrieved 9 march, 2012).
[2] Alagu .S and MeyyappanT (2012), “Dynamic channel allocation scheme to handle handoff in a wireless Network” Computer science and Information Technology Journal, pp. 171-184.
[3] Bartolini N.,( 2001) “Handoff and Optimal Channel Assignment in WirelessNetworks,” Mobile Networks and Applications, vol. 6 (6), pp.511–524
[4] Ekici E., (1997), Optimal two-tier cellular network Design, DS Dissertation Bogazici university, Turkey, Available from www.bogazici.edu/dissertation retrieved 21 August, 2012.
[5] Xuemin (2001).An Analyses of GSM Handover based in Real Data International Journal of Computer science and information security Vol 9 (7), pp 171-184
[6] Fang Y., and Zhang Y., (2002) “Call Admission Control Schemes and Performance Analysis in Wireless Mobile Networks,” IEEE Transport Vehicle Technology, vol. 51 (2), pp. 371-382. retrieved from www.ieee.org 10 March, 2012
[7] Ayyappan K. and Dananjayan P. (2012). “Propagation Model for Highway in Mobile Communication System’,Ubiquitos Computing and Communication Journal, www.ubicc.org Accessed June,2012
[8] Marichamy .P, S. Chakabarti and S. L. Maskara (1999), “Overview of Handoff Schemes in Cellular Mobile Networks and Their Comparative Performance Evaluation”, IEEE Proceedings. Vehicular Technology Conference (VTC’99)-Fall, Amsterdam, The Netherlands, pp. 1486-91 Retrieved from www.ieee.org, 9 November, 2012
[9] GLOBECOM, (1992) “Analysis of handoff algorithm using nonstationary signal strength measurements,” in Proceedings, 1992, Orlando, FL. USA
[10] Mende W. (1990). Evaluation of a proposed handover algorithm for the GSM cellular system," in Proceedings. 40th IEEE VTC, pp. 264-269.
11] Singh .B,(2005), “Sensitivity analysis of handover per-formance to shadow fading in microcellular systems,” IEEE , retrieved 12 March, 2012
[12] Lee W. C. Y.,(1995). Mobile Cellular Telecommunications, 2nd ed. McGraw-Hill, pp50-80
[13] Gregory P. Pollioni, (1996) “Trends in Handover Design”, IEEE Communications Magazine,vol. 34, pp. 82-90.
[14] Youssef I., and Raouf B., (2005). Handoff and Call Dropping Probabilities in Wireless cellular Networks, 2005 International Conference on Wireless Networks, Communications and Mobile Computing.
[15] Wee-Seng S. and Kim H.S., "QoS provisioning in cellular networksbased on mobility prediction techniques" IEEE Communications Magazine,vol. 41, no. 1, pp. 86-92, January 2003.