Munich Personal RePEc Archive
Individual learning: theory formation,
and feedback in a complex task
Novarese, Marco and Lanteri, Alessandro
Centre for Cognitive Economics, Università Amedeo Avogadro
26 April 2007
Online at
https://mpra.ub.uni-muenchen.de/3049/
I ndividual learning: theory formation, and feedback in a complex task
Alessandro Lanteri and Marco Novarese
April 2007
DRAFT
Comments are welcome
ABSTRACT. We present an experiment for the study of learning in a complex task which requires both
memorisation and the ability to process several pieces of information. The outcome of an action, for which immediate feedback is given, depends on the context (i.e. one of thirty-two sequences of three features) which is know and visible to the subjects. Subjects develop some theories of the experimental world, which result in the stable repetition of some actions in response to certain conditions. These theories are modified after feedback, however mistaken answers are repeated and correct answers abandoned. During the game, theories become more effective (i.e. they afford more correct answers and a higher score), yet the improvements slow down. The theories follow from only a portion of the available information and when they become successful (i.e. towards the end of the experiment) the subjects start refining them to include a larger subset of the information, this causes more stable mistakes.
KEY WORDS: cognitive economics, complexity, experiments, feedback, learning, theory formation, Heiner
JEL CLASSI FI CATION: A12, C91, D83
Alessandro Lanteri is Post-Doctoral Fellow at the Dipartimento di Scienze Economiche e Metodi Quantitativi (SEMEQ), Università Amedeo Avogadro.
Marco Novarese (corresponding author) is Assistant Professor of Economics at the Dipartimento di Scienze Giuridiche ed Economiche (DISGE), Università Amedeo Avogadro. Address: Via Mondovì 8, 15100 – Alessandria (Italy). Email: [email protected]; web: www.novarese.org.
2
7KHRULHVIHHGEDFNDQGOHDUQLQJ
The standard view in microeconomics regards learning as the process through which economic agents develop increasingly rational and efficient behaviour. Even if individual agents are not at the outset perfectly informed or capable of efficiently employing the information they have, over time they learn to do so. Learning is a process that may uphold (and possibly justify the recourse to) the assumption of perfect individual rationality. There thus emerges a need for theoretical models that account for the capacity of individual agents to learn and to become increasingly skilled at making rational decisions. The Least Square Learning (e.g. Marcet and Sargent 1989) and the Bayesian models are good examples: they maintain that available data are processed by individuals in an optimal fashion and then included in subsequent decision processes, so that new empirical evidence interacts with and adds to available knowledge, and eventually brings about ever better choices. Similar conclusions may be reached, in several standard and stable contexts, also with models derived from psychology and which allow for imperfectly efficient results. Reinforcement learning models (e.g. Erev and Roth 1998), for instance, rest on the observation that agents tend to repeat choices that had previously afforded positive results. This way, there is a tendency to adjust behaviour to empirical evidence, maintaining some actions which become increasingly probable, yet not binding because there remains a positive probability (though smaller and smaller) of making a different choice.
In different ways, therefore, there have been attempts at modelling the individual capacity to adjust behaviour in the lights of empirical evidence about the outcome of previous decisions – what is called
feedback. This capacity is stronger in some models than others. For instance, models informed to advances in the psychology of learning and decision-making regard choices as sticky and ever less prone to change. At some point in time, that is, choices begin to stabilize and feedback impacts less and less on subsequent decisions. But the impact of feedback itself may not always be straightforward. There are indeed several situations in which both mistakes and their causes are not easily observed. A firm which doesn’t sell any of its products immediately acknowledges that there is a problem, yet it may be very difficult to investigate whether this is because the product is unappealing or wrongly priced, because of the improper practices of competitors, or because of bad luck … (and some of these causes would not even seem to leave much room for correction). More generally, there are situations in which it is not possible to directly assess how good a choice is, especially when its effects only play out in the long run.
In this paper we aim at analysing this problem by investigating how feedback affects individual decisions and learning processes in the absence of collective mechanisms that may correct or select out inefficient choices. Looking at the matter from a different angle, our interest concentrates on the capacity of individual agents of learning both how to employ available information in a stable context with immediate and straightforward feedback, and how information is processed and combined.
7KHRUHWLFDOEDFNJURXQG
3
fine-tuned through an inductive process and because it is certainly possible to hold several models and hypotheses at the same time, which may differ in one or more respects. Decisions are thus tested against real world phenomena and associated with their actual outcome, and eventually upheld or discarded1. Because the world presents clear and traceable patterns, Arthur believes, the skill to detect them is both necessary and advantageous2.
Richard Nelson (2005) also suggests that the search for a better way of doing something is both oriented and limited by what an actor currently knows and believes. Nelson’s research rests on a model of human decision making that is boundedly rational. It is rational in that an actor has a more or less clearly specified goal to achieve (for certain tasks, one may consider "finding a proper goal" as a goal in itself) and a more or less clear idea (i.e. a theory) of the context within which he is to achieve the goal. This theory thus suggests a pattern of behaviour, or a strategy, consistent with the goal. The gathering of empirical data and feedback about actions may lead to improved applications of one’s knowledge of the world, e.g. to undergo a d ifferent path towards the solution of one’s problem. Alternatively it may lead to an improved knowledge of the world tout court, e.g. a more accurate mapping of the existing and potentially fruitful paths themselves. Problem solving thus requires that an agent engages both in trial and error learning and in theorizing. What result a person achieves is thus difficult to predict as it depends on this interactive learning process (and, to some extent, on luck). Learning is thus used to describe both the collection of new information and the consequences such information has on an individual, though these are two very different processes. Nelson imagines a situation in which the agent learns as he performs a "goal oriented task" for which he must attain at least a minimal success. But decisions and learning do not occur in a stable environment within which the agent may maximise. Instead, a crucial aspect of learning is for the agent to recognize the context in which he operates, both to decide which rule to apply and to test when his model fails. The agent "either needs to learn how to identify different contexts, as well as a set of context specific guides of action, or find a broad guide to action that works reasonably well in all or most contexts he will face" (Nelson 2005:6).
The connection between uncertainty, decisions, and the capacity to manage information is also central in Ronald Heiner (1983). Despite a relatively simple formalisation, Heiner’s model conceals a plethora of possible interpretations and meaningful implications; therefore we must on this occasion concentrate on the few selected aspects that bear the most significant influence on the matter at hand, namely the connection between the predictability of behaviour and the information complexity of an environment. It is precisely because of uncertainty – which can be defined as a lack of knowledge of (or lack of the skill to define) the link between contexts and optimal decisions – that individuals may, more or less consciously, reduce the set of possible decisions to a subset of reliable
options, which on average afford satisfactory outcomes. A reduction in the number of potential options may be achieved by reacting only to some information, ignoring the rest (i.e. to decide based on A, B, and C, but not D, E, …), or by disregarding the distinction among certain pieces of information (i.e. to acknowledge the difference between B and C, but to nonetheless treat them as equal for the sake of a choice), or it may be because of an individual failure in the sophisticated processing of information, thus resulting in somewhat generic rules of behaviour that disregard some variables. Heiner does not address the problem of how a reliable action could be developed. When relevant knowledge is yet to be uncovered, it is plausible that an actor attempts very diverse choices (i.e. behavioural entropy is high), and this way she sets in motion the mechanisms that help define a reliable action. Though he does not directly attend to the issue of learning, from Heiner’s reflections, and consistently with Arthur’s and Nelson’s above, le arning may be considered a capacity to better
1
To the extent that new empirical evidence is interpreted through the interpretative schemes constructed at the beginning and – probably – slow to evolve, there is a constraint to changing these very schemes.
2
4
use information and to interpret a decision context in its entirety. What follows is an abandonment of perfect rationality, replaced by a definition of individual (bounded) rationality as the capacity to manage only some portions of the relevant information (à la Simon, 1983). As people learn, they use larger and larger amounts of important information and they react in more specialised ways to subtle changes in environmental conditions. The variability of their behaviour therefore scales up, while its predictability is diminished. Because behaviour follows from individual theories and cognitions, learning ultimately affects an agent’s behaviour thro ugh a change in the type or in the amount of processed information – e.g. concerning (un-)attainable or (un-)desirable outcomes; (un-)feasible, (in-)effective or (in-)efficient actions. In this sense, all learning impacts on the theory or theories the agent holds about the task he is facing. There are two main vehicles for gathering this type of information (Bandura 1977, Witt 2000, Rizzello and Turvani 2002): vicarious learning – e.g. learning via observation or imitation – and direct learning – e.g. learning by doing, by using, by trial-and error, etc. Ruling out vicarious learning from our experimental setting, we limit our analysis to the latter on the present occasion. Direct learning occurs whenever an actor observes or otherwise obtains information from the outcome of an action he has attempted or performed.
7KHH[SHULPHQW
The experiment took place at the Center for Cognitive Economics, Università del Piemonte Orientale, in Alessandria (Italy), on the 5th July 2000. The subjects were twenty-tree undergraduate students of
Law, attending their first Economics course. The game was constructed around a fictional association whose members fall within one of five categories: Children, Adolescents, Young, Adults, and Elderly. The information about members is reported on a set of cards located on either of two shelves (Right
and Left). Each card presents two features: one of four animals (Cow, Horse, Goose, and Chicken) and one of four shapes (Square, Rectangle, Circle, Oval)3. At each turn the subjects were presented with a combination of animal, shape, and shelf and were asked to guess the membership category corresponding to the combination within ten seconds4. The participants were informed with written instruction (see full instructions in the Appendix 3) that the connection between the card features, the shelves, and the membership were based on a specified criterion (i.e. it was not random) and that it was constant throughout the game (which last 231 turns). Instructions made it clear that there was a logical connection between information and results, but that such link was not related to any real world fact5. These notes aimed at making it clear that the criterion should and could be learned to fulfil the ultimate goal of making as more points as possible. Students received a monetary reward based on their performance (each point was worth 40 ITL, i.e. circa ¼6. The experiment lasted
about one hour for all players.
The task is quite difficult. Each turn the players are faced with one of thirty-two possible combinations. The solution of the game, however, does not mirror all the possible features in a clear-cut fashion, because it groups cow and horse into mammals, goose and chicken into birds, square and
3
We selected features that are as neutral as possible – i.e. they do not, on average, arouse emotional responses. For instance placing the items on an upper shelf might suggest a superior value compared with items on the lower shelf (e.g. Lackoff and Johnson 1981). I n a previous experiment similar to this (Novarese and Rizzello 2006), the employment of bright/ dark colors and large/ small sizes may explain why the subjects associate certain combinations of features with specific value judgements (i.e. insufficient to excellent). On the present occasion we also tested the card features to verify neutrality. We asked 20 subjects to answer a sample of random sequences (as if they played the game, but without instructions nor goals). The responses to each sequence were quite homogeneous among the different possible alternatives.
4
The main results are similar to those in Novarese & Rizzello (2006), where there was no time constraint.
5 Subject were also preliminary informed that participating to the experiment would have had no influence on their academic
evaluation an were than required if they were willing to go ahead. They were also informed that no written or oral communication was allowed and that they cannot write or take any kind of notes.
6
The best performer thus earned ¼ FLUFD WKH ZRUVW SHUIRUPHU HDUQHG ¼ 14.32 (circa $ 18). The average and
5
rectangle into shapes with angles, and circle and oval into shapes without angles (players do not have this information.) This way, each combination is an instantiation of one out of height meaningful cards, each corresponding to one of five membership categories7. The participants were also hinted at the fact that some membership groups were somehow associated, because they are informed that
Children and Adolescents pay no fee, Young pay a reduced fee, and Adults and Elderly pay full fee, but the nature of these associations is entirely obscure for them. The solution of the game is reported in TABLE 1.
0HPEHUVKLS*URXS $QLPDO 6KDSH 6KHOI
Children Mammal
(cow, horse)
With angles
(square, rectangle) Right
Adolescents Mammal
(cow, horse)
With angles
(square, rectangle) Left Mammal
(cow, horse)
Without angles
(circle, oval) Right
Young Mammal
(cow, horse)
Without angles
(circle, oval) Left Bird
(chicken, goose)
With angles
(square, rectangle) Right Bird
(chicken, goose)
With angles
(square, rectangle) Left
Adults Bird
(chicken, goose)
Without angles
(circle, oval) Right
Elderly Bird
(chicken, goose)
Without angles
(circle, oval) Left
TABLE 1: Solution
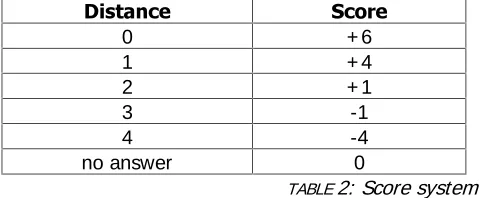
At the end of each turn, subjects were told the correct answer and their score. The score was calculated in relationship with the distance between the answer given an the correct answer: the distance is 0 when the answer is correct; the distance is 1 when the answer given is one membership category above or below the correct answer (e.g. Children/ Adolescent, Elderly/ Adults); the distance is 2 when the answer given is two membership categories above or below the correct answer (e.g.
Adolescents/ Adults, Elderly/ Young); the distance is 3 when the answer given is three membership categories above or below the correct answer (e.g. Adolescents/ Elderly, Adults/ Children); the distance is 4 when the answer given is four membership categories above or below the correct answer (i.e.
Children/ Elderly or vice versa). The score at each turn was computed as in TABLE 2.
'LVWDQFH 6FRUH
0 + 6
1 + 4
2 + 1
3 -1
4 -4
no answer 0
TABLE 2: Score system
In some respects this experiment resembles a more popular game: Mastermind (see Best, 1990 and references therein). In Mastermind, a player called coder arranges four pegs, each of one out of six possible colours, in an orderly left–to-right sequence kept secret behind a screen. Another player, the
7
[image:6.612.89.528.176.393.2] [image:6.612.189.429.548.647.2]6
solver, must guess the exact code (i.e. position and colour). Whenever the solver makes a guess of a possible code, the coder gives him feedback on his performance by means of placing a number of white pegs (for correct colour and correct position) and black pegs (for correct colour and wrong position) next to the guess-code. In our experiment, participants must still guess the code. But they do not choose the sequences, which are given. The experiment is more similar to those on concept formation (e.g. Garner 1962) whose goal, however, was to analyse performance (i.e. number of mistakes) depending on available information. It also presents a few similarities with those belonging to the so-called diagnostic task series. Kelley and Friedman (1999), for example, asked the participants in their experiment to forecast the price of a good. The price was determined according to a linear stochastic process with two independent variables. Players know the model, but not its parameters. In each of the 480 rounds, they have to forecast the price, after seeing the changing values of the independent variables. After each round they get information on the real value of the price. Kelley and Friedman’s experiment is built to test the least square models of learning, where economic agents are expected to be able to estimate the parameters of known models. Consistently with their goal, Kelley and Friedman test the accuracy of their players’ implicit estimates. In our experiment there is a quite different idea of learning, seen – as in the psychological literature – as the human capacity to modify behaviour in a more or less permanent way, whenever new experience is acquired. We thus elaborate on decision contexts of the kind addressed by Heiner (1983) and Nelson (2005). Experimental subjects (as in the real world) do not know the model which generate the information, but they have to create their own representation of the world. Moreover, our subjects are not expected to understand the real relation in TABLE 1, as, in our view, there is learning even if they
develop a wrong system of rules. Even a (partially) wrong model of the world may in fact help them to successfully perform in the given environment.
7HVWLQJWKHK\SRWKHVHVVWUDWHJLHVDQGIHHGEDFN
7
three years earlier. It might just as well be twenty meters away and the prevailing conditions for the throw remain almost the same. Conversely, two combinations which look almost the same, in our experiment bring about different outcomes. In order to perform successfully, the subjects could not – and did not – rely on memory alone.
One might expect a typical player to give random answers to the early combinations (this was even suggested in the instructions, so to confirm the fact that results and information have no link to any real world phenomenon). At first, the answers are mostly mistaken, or they are correct about as often as chance predicts – i.e. twenty percent of the times. As he observes more and more feedback from the computer revealing the correct answers, player will begin to associate certain features in the combinations with specific membership categories. This way he develops some ideas about the relationships between the items in the game, which translate into his beliefs about the experimental world and how to best perform within such world – what we might call a theory. This theory, if early on, it is certainly incomplete (i.e. it only maps some of the relationships between features and memberships), it is nonetheless better than wild guessing and it can be expected to evolve during the game and to become progressively better tuned as more feedback is gathered, thereby leading the player closer and closer to the solution. This player is now equipped with a rough understanding of the game, which he continuously supplements with new information concerning the features and membership groups not yet addressed. Every time he encounters a combination that falls within the range afforded by his theory, he applies it – i.e. he employs a strategy consistent with the theory. When he does so, two events may occur. One possibility is that the answer is correct, so the strategy is confirmed and the theory upheld. On the other hand the answer may be incorrect, therefore the theory needs be revised. Because we allow for a range of points earned based on the degree of correctness of an answer, the mistake may be small or large. If the mistake is small, perhaps the player chooses to disregard it and preserve the theory to see to what extent does it hold and maybe wait until later to look for a refinement. The longer one has successfully employed the theory, the more resistant he probably is to abandon it when it fails, especially if the failure is negligible. If the mistake is large, he may want to figure a way to replace the assumption he had been making. The theory, however, is based on several assumptions which might be replaced, so that he might replace a wrong or a correct assumption. Only future feedback will tell.
When the player observes a sequence which he has already encountered and responded correctly to, will he again respond correctly? And why? The best speculation we can make is that, if he indeed responds correctly he is reapplying a successful strategy (perhaps following from a revised version of the original theory). If he does not, he is elaborating a new theory8. We might therefore observe, as the game proceeds, that players may repeat mistakes they should have learnt to avoid, either because the mistake was disregarded and the wrong theory maintained, or the correction was incorrect, too. We might also observe that some right answer can be abandoned, because our player revised a portion of a theory which was originally correct and replaced it with an incorrect one.
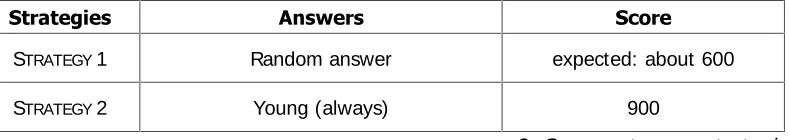
As said, the payoff depended solely on the actual score. It is thus possible that some of our subjects had perhaps no desire to understand, as it were, the working of gravitational forces, but simply wanted their pebble to fly as far as possible. Because our – that is the experimenters’ – goal, i nstead, is to understand how players learn the criterion governing the experiment, for our results to be meaningful at all we must observe an attempt at figuring out the criterion from the subjects and we would ideally rule out some strategies that do not rest on in-game theories (TABLE 3).
A participant faced with the complexity of the task and uninterested in its functioning, might decide to
8 I t could also be the case that the player remembers (and possibly remembers incorrectly) what response he had given
8
systematically give random responses (STRATEGY 1 in TABLE 3). Even this very simple strategy only makes
sense if it rests on the theory that each age category is (roughly) equally represented in the solution (in practice such theory would be mistaken)9. Therefore, when we suggest that one does not need a thorough or profound grasp of the underlying mechanisms behind a given task context, we do not mean that one can do without a theory.
6WUDWHJLHV $QVZHUV 6FRUH
STRATEGY 1 Random answer expected: about 600
STRATEGY 2 Young (always) 900
TABLE 3: Some out-game strategies
Another reliable strategy exists at the outset: < Always play Young> . A player may formulate this strategy based only on the payoff table. Since the Young category is either one or two steps away from the other age categories, it always affords positive score (i.e. + 6, + 4, or + 1). One can uphold
STRATEGY 2 on the grounds of a theory maintaining that the categories in which it performs worst (i.e.
Elderly and Children) are not significantly over-represented. Moreover, though the players do not know this at the beginning, the Young category is associated with 50% of the possible combinations, making its probabilities of giving the highest score four times more likely than those of any other category. Through feedback, therefore, a player figures out that the strategy he is following is better than he initially thought. In a case like this, there would be another obvious problem: though he learns new facts about the way our experimental world works, the player in question would not change his game conduct, therefore some learning might go undetected.
STRATEGY 1 and STRATEGY 2 seem the only reasonable options available to a player, based exclusively on
the instructions, as every more refined strategy requires at least a rough understanding of the feedback. These two strategies, however, may be presumed rarely followed, as also shown by experiments very different from ours. For instance, when they are asked to guess the numbers extracted from an urn containing, say, 70% number 1 and 30% number 0, subjects tend to give responses which reflect the relative frequency of 1’s and 0’s, though it would be more sensible to always respond 1 (Feldman, 1973). The situation is somewhat analogous here. For instance, STRATEGY 1
should afford 43% of the maximum score attainable, or 600 out of a maximum of 1386. Every player in our experiment scored above this level, which we take as an indication that no player systematically gave random answers. On the other hand, by consistently following STRATEGY 2, a player would have
earned circa 65% of the total score, or 900, but this did not happen with any of our subjects. Because our players did not follow the two simple strategies, we can rule out the possibility that they played without an in-game theory10. Is this a good thing? For us, yes, as we are interested in studying learning. For them, it is not necessarily good, because a refined theory needs not inescapably lead to a higher final score than a cruder one. TABLE 4 reports some score statistics. The average score is
higher than chance predicts (200 points), which means that after the first few turns almost every player begins to form a strategic outlook on the game that is more sophisticated (at least, more successful) than STRATEGY 1. What we found surprising, instead, is that as the game proceeds the
median score stabilizes only slightly above the performance of STRATEGY 2. At the individual level, there
are 10 players (43.5%) who scored less than 900, and would have thus been better off by always responding Young. In an ideal situation all our players would eventually develop a perfect understanding of the criterion, so that in the last phase they accurately reproduce the solution scheme
9
Unfortunately we may not confidently say from which theory does a strategy follow because the same strategy can be the manifestation of several different theories.
10
[image:9.612.115.510.151.221.2]9
in their responses. This did not happen (except for three players, one of which – remarkably – found the solution around the 70thturn), but perhaps it could have, had the players been given a longer time.
After all, we set an end to the experiment, but it is quite clear that almost every participant in the experiment is still learning throughout the late turns.
$YJ 931
6W'HY 157.4
0HGLDQ 904
0LQ 716
0D[ 1276
TABLE 4: Score Statistics
3UHOLPLQDU\ILQGLQJV
An experiment as long and complex as ours may elicit the observation of several interesting variables. Because our focus is on learning, however, we must concentrate on this aspect. The first and foremost observation that concerns us is the capacity to learn, to improve the number of correct answers that is, benefiting from the information acquired in the course of the game. Because the number of possible combinations is much smaller than the number of turns in the game, each combination occurs several times (yet never in consecutive turns)11. These are precisely the events
that let us investigate the patterns of learning of our subjects.
The major variables we analyse are the most intuitive measures of performance and learning: successful and unsuccessful answers. We supplement these with a selective analysis of the score, which depends both on the number of correct and wrong answers and on the type of wrong answer. We do so only in passing because there is a large variation in score for mistakes (i.e. from -4 to + 4) that might blur many of the aspects connected with learning that interest us.
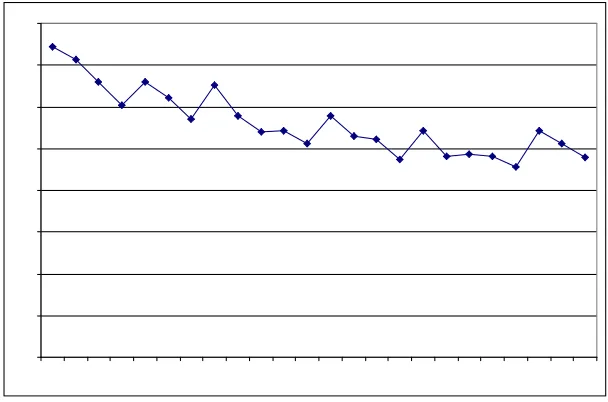
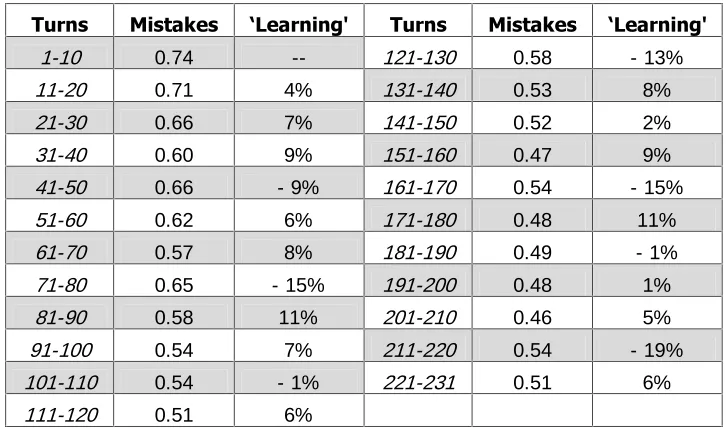
FIGURE 1: Average number of mistakes, by 10-turns
On the whole, as expected, the number of errors decreases rather fast at the beginning of the experiment, and somewhat less fast later on (FIGURE 1, AND TABLE A1 in the Appendix 1). The process,
however, is not monotonic because individual differences in performance may be very large and
11
[image:10.612.153.457.437.638.2]10
because, on any given turn, the number of mistakes is affected by several factors – e.g. the specific combinations that were presented, how much did two consecutive sequences differ, to which combinations did a subject already give a correct answer (and why), etc.
Towards the end we introduced numerous combinations which, while still reproducing the original structure, have never appeared before. The worse performance in the late turns, however, is not due to these novel sequences. The average response time to new combinations in the third phase is roughly the same as that to old combinations (actually, even shorter): 4.99 and 5.14 seconds, respectively. The same is true for average score: 4.26 for the new sequences and 4.02 for the old ones. New sequences, therefore, do not seem to be handled differently from old ones. This observation also serves as a first indication that memorisation does not play a major role in the choice and performance of our subjects, at least at the end of the experiment. If the reduced improving of subjects’ performance is not caused by novel sequences, we speculate that it may be caused by a slowdown in learning and a crystallization of the rules, or by alternative factors such as boredom or fatigue. It is not easy to measure these effects, nor is it clear that they should unmistakably be present. Our experiments last about one hour, which is not a very long time. Kelley and Friedman's (1999) experiments last about three hours overall (though with some breaks) and yet their subjects’ performance keeps increasing. It is so more likely that this reduction in performance improvement is because in the late turns the subjects entertain themselves with more sophisticated theories, that cannot easily be upgraded (more on this below).
+\SRWKHVHV
In the lights of what we said so far, we regard learning as a change in behaviour that follows from experience and we can already point out one of its central features: learning is outcome-improving. By some definitions of outcome-improvement this may be untrue, but in a broader sense and in a medium-to-long-term perspective, we expect that:
[ 1.] subjects perform increasingly well (i.e. make less mistakes and score higher on average) as the experiment progresses. Consistently with the majority of experimental investigations of learning, we further predict that:
[ 2.] learning is faster at the beginning and then it slows down – i.e. behaviour both changes and improves its results relatively more at the beginning. Since we interpret improved performance as evidence of learning, we must hypothesise that:
[ 3.] subjects (tend to) respond identically and correctly to the same sequences as they appear later in the game, i.e. they develop stable strategies.
The present experiment also elaborates on results obtained in previous sessions with different information and manipulations (e.g. Novarese and Rizzello 2006). Based on earlier observations and in the lights of the previous discussion, we note that:
[ 4.] in the process of elaborating their strategies, subjects may ignore specific portions of the information available to them.
Because memory and perceptions are affected by the hypotheses and knowledge held at a given moment, it is probable that:
[ 5.] subjects also develop incorrect strategies, i.e. they answer identically and incorrectly to some sequences (at least temporarily).
The upshot of [ 5.] should be that :
11
7KHXVHRILQIRUPDWLRQ
We can now advance some additional hypotheses based on a dynamic elaboration of Heiner’s model. We propose that, since the experimental environment is new and unknown to our subjects, they have no reliable rules that may apply, and they must develop one or more such rules. In the first part of the game, therefore, we expected a very much erratic behaviour, with several answers perforce given at random or with continuously changing theories (based also on a idiosyncratic and not empirically-based evaluation of the significance of the information). At some point, however, the subjects should start formalising some more stable strategies and – consequently – reduce the range of possible answers they give to each sequence, though they may not have yet figured how to best respond to those sequences. At this stage, we should observe that subjects rely on a subset of the information. We shall assume – inspired again by a combination of previous findings and of the literature – that players could respond often on the basis of Animal and Shelf only. The first seems to be more visible, because it is the first information shown, while the latter is easier to manage because it only has two modalities. Over time, as they learn to react to some given information only, subjects errors should become increasingly predictable, at least for given sequences, and their behavioural entropy should fall. To investigate this hunch we elaborate on the concept of behavioural entropy (Heiner 1985 appropriates it from psychological literature), which is defined as:
∑
− =✁
K K
( ORJ
where a is an element in the set of possible actions A, and ha= p(a) is the probability (relative
frequency) of choosing a given action (see Appendix 1). We aim at measuring this index, given a context, defined by two pieces of information only: Animal and Shelf. The higher the number of chosen actions under the same conditions and the more uniform their frequency (for instance when an agent gives random answers), the higher is behavioural entropy and the harder it is to predict this agent’s choices. Conversely, if an agent’s behaviour i s stable (for instance he always responds Young), entropy is 0. When entropy is low it is also easier to predict what action an agent will choose. Given all the information, entropy is null also for a player who always gives the correct answer, because under some conditions he always responds the same way. But this changes if, as we suggest, the choice context is defined by just two features (Animal and Side). In such case, each sequence (e.g.
Horse-Right) has two possible correct answers (i.e. Children and Young) depending on the third (Shape), unobserved, feature12. Because the two correct answers are not evenly distributed, depending on their actual frequency we may calculate, as it were, the correct entropy, that is the
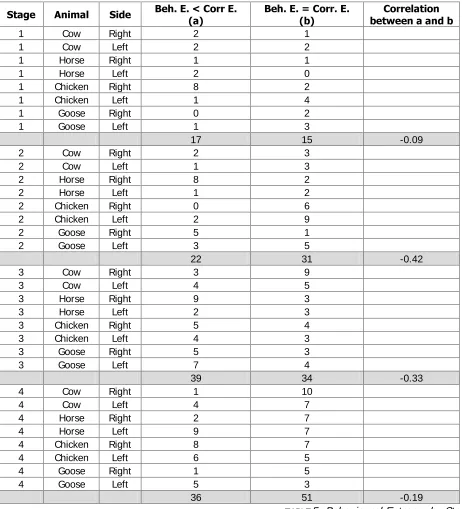
behavioural entropy of an agent who always gives the correct answer in a scenario in which two features instead of three are taken into account. So – in addition to the fact that theories evolve, some answers are random, there are accidental and systematic mistakes, and memory is imperfect – the entropy we observe is also caused by the missing piece of information. Consequently, if we observe that the entropy for a combination of two features is inferior to the correct entropy, we have a strong confirmation of the hypothesis that (in such context) agents do not employ all the available information. For example: if a player faces the sequence Goose-Left and chooses Elderly seven times out of nine, but the correct responses were five times Elderly and four times Young, the entropy of this player is lower than the correct entropy13.
12
Note, however, that the solution in TABLE 1 still holds.
13
12
6WDJH $QLPDO 6LGH %HK(&RUU( D
%HK( &RUU( E
&RUUHODWLRQ EHWZHHQDDQGE
1 Cow Right 2 1
1 Cow Left 2 2
1 Horse Right 1 1
1 Horse Left 2 0
1 Chicken Right 8 2
1 Chicken Left 1 4
1 Goose Right 0 2
1 Goose Left 1 3
17 15 -0.09
2 Cow Right 2 3
2 Cow Left 1 3
2 Horse Right 8 2
2 Horse Left 1 2
2 Chicken Right 0 6
2 Chicken Left 2 9
2 Goose Right 5 1
2 Goose Left 3 5
22 31 -0.42
3 Cow Right 3 9
3 Cow Left 4 5
3 Horse Right 9 3
3 Horse Left 2 3
3 Chicken Right 5 4
3 Chicken Left 4 3
3 Goose Right 5 3
3 Goose Left 7 4
39 34 -0.33
4 Cow Right 1 10
4 Cow Left 4 7
4 Horse Right 2 7
4 Horse Left 9 7
4 Chicken Right 8 7
4 Chicken Left 6 5
4 Goose Right 1 5
4 Goose Left 5 3
36 51 -0.19
TABLE 5: Behavioural Entropy, by Stage
For the analysis of behavioural entropy we divide the experiment into four stages (i.e. from turn 1 to 57; from 58 to 115; from 116 to 173; and 174 to 231). For each two-feature-sequence TABLE 5 reports,
for all players, how many cases show behavioural entropy below and equal to what we would observe with correct responses. For each of these, we reject the random hypothesis14. For example, at stage one, there are two players whose behavioural entropy is lower that the correct entropy for the sequence Cow-Right (while only for one player the two are identical). The frequencies are low, but, as
14
[image:13.612.77.539.83.592.2]13
said, there are many elements adding to behavioural entropy (consider also that the division in four parts is artificial and does not allow the detection, if not by chance, of the exact steps used by players to develop and modify their theories. The cases in which the behavioural entropy is lower than the correct one change over the periods (as an example Chicken-Right has a frequency equal to eight in stage 1 but it is zero in the following period). This testifies to the frequent changes in theories.
We are here interested also in analysing the evolution of these numbers along the game. The tendency to simplify – i.e. to employ a subset of the total information – increases during the first three stages, and only then it decreases a little. In the third stage there are sixteen subjects out twenty-two who behave as if they disregarded one feature at least on one occasion (and on average they do so more than twice; given the measurement problems, this is a rather high value). Overall, there are thirty-nine cases of this kind, which is more than the thirty-four cases in which the entropy is correct. In the fourth stage the number of reduced-entropy cases shrinks to thirty-six, which involve seventeen subjects. Conversely, the number of sequences for which we observe correct entropy increases across the whole experiment, including in the last stage15.
Stage I ✂☎✄✝✆✟✞✟✠ 6FRUH &RUUHFW ✂☎✄✝✆✟✞✟✠ ✂☎✄✝✆✟✞✟✠ 1
6FRUH - .369 1
&RUUHFW - .338 .715 1
✂☎✄✝✆✟✞✟✠
.963 - .328 - .328 1
Stage II ✂☎✄✝✆✟✞✟✠ 6FRUH &RUUHFW ✂☎✄✝✆✟✞✟✠ ✂☎✄✝✆✟✞✟✠ 1
6FRUH - .428 1
&RUUHFW - .435 .824 1
✂☎✄✝✆✟✞✟✠
.997 - .422 - .432 1
Stage III ✂☎✄✝✆✟✞✟✠ 6FRUH &RUUHFW ✂☎✄✝✆✟✞✟✠ ✂☎✄✝✆✟✞✟✠ 1
6FRUH - .102 (* ) 1
&RUUHFW - .285 .853 1
✂☎✄✝✆✟✞✟✠
.999 - .099 - .283 1
Stage IV ✂☎✄✝✆✟✞✟✠ 6FRUH &RUUHFW ✂☎✄✝✆✟✞✟✠ ✂☎✄✝✆✟✞✟✠ 1
6FRUH - .223 1
&RUUHFW - .340 .875 1
✂☎✄✝✆✟✞✟✠
.995 - .221 - .333 1
Correlation is significant at the 0.01 level (2-tails), except where marked with * in which case it is significant at the 0.05 level.
TABLE 6: Correlation among variables, By Stage
When a theory results in mistaken answers, a player should question and revise it. His behavioural entropy should therefore be high – or at least higher than if he always answered the same (correct) way. Higher score is therefore associated with lower entropy (negative correlation). The decision to
15 The cases in which behavioural entropy is higher than correct entropy cluster around certain sequences, with a negative
[image:14.612.102.512.268.582.2]14
employ only two pieces of information, yet, proves reliable if it scores quite well and often enough, but not necessarily always. We can thus expect, for each sequence, reduced entropy, with several correct answers, but some mistakes as well. The correlation between entropy and score, consequently, is weakened. In other words, if a player uses two pieces of information, the correlation between score and entropy is very low, because mistaken answers do not lead him to change his theory. The correlations under exam are calculated in TABLE 6, based on two definitions of entropy that
include (ENTRO2) or exclude (ENTRO3) missing answers. As expected the correlation between entropy
and score and that between entropy and number of correct answers are always non-zero and negative. The trend in these correlations, moreover, is revealing. They are higher in the preliminary stages, but then decrease in the third, and later increase again in the last part. This is the kind of result we would expect if, at a certain point in the experiment, the participants start to focus on a subset of information that helps them come up with satisfactory theories, and then they eventually start enriching these theories again by devoting more attention to the features they had temporarily disregarded. It also seems that the participants focus more and more on correct answers instead of focussing on score as the game advances (the correlation of both ENTRO2 and ENTRO3 with the score in
the last two periods is lower that that with the number of correct answers).
3UHGLFWLQJPLVWDNHV
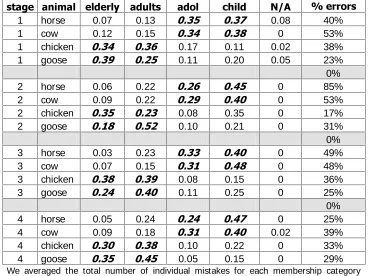
Besides helping in studying behavioural entropy, our interpretation of Heiner’s model allows to understand and predict the kind of mistakes subjects make. The reduction in entropy can be explained with the development of a theory that disregards one piece of information: Shape. As a consequence we observe that, as the game proceeds, subjects fail to answer Young when it is the correct answer. This is only one of the possible mistakes, which is particularly relevant as Young is the most frequent (correct) membership in the game. So we can explain a large number of errors (even if in relative terms the percentage of errors when the right answer is Young is not different from the mean). This helps us pointing out regularities in game conduct which would be more difficult to detect with less frequent sequences.
When the correct answer is Young, responding Adults or Adolescents is indifferent: both mistakes have the same distance from the correct answer and thus guarantee the same score. The same holds for Elderly and Children: none is more advantageous than the other. So we have no reason to expect any of the mistaken answers to prevail. TABLE 7 shows instead that, when the correct answer is Young,
mistakes are not random and they tend to cluster in a specific direction (see table A2 in Appendix 1 for a similar table with data by Animal and Shelf). The results are rather plain: when the Animal is a
Mammal, mistakes group around the youngest two membership categories, and vice versa with Birds. Another explanation for this phenomenon may be that players respond with the membership which they are successfully able to classify. If, for a given Animal a player is accustomed to respond
Children, it is more likely that he responds Children also when the correct response is Young, instead of, say, Elderly. We can see this by means of TABLE 8, in which we calculate the percentage of correct
answers for each player, depending on the Animal and then we determine its correlation with the incorrect responses given when the correct answer was Young. As we expected, the more often one correctly responds Children to a combination beginning with Horse, the more often he will respond
Children to a combination starting with Horse although this time the response is incorrect because the solution is Young. We calculated coefficients based on multiple observations from each player and these may not be independent. The table serves the purpose of conveying a hunch of an individual explanation for the general tendency. We have too few observations for a more detailed analysis (which would require both correct and wrong answer to the sequence starting with Children; most of players respond correctly, while there are few wrong answers).
15
theories, which perhaps need further refinements or revisions. Only a subset of the available information, therefore, seems to be meaningful to our players for a large part of the experiment, and while this may be a promising way to proceed, it may at the same time stick and consequently slow down the successful processing of new feedback.
VWDJH DQLPDO HOGHUO\ DGXOWV DGRO FKLOG 1$ HUURUV
1 horse 0.07 0.13 0.08 40%
1 cow 0.12 0.15 0 53%
1 chicken 0.17 0.11 0.02 38%
1 goose 0.11 0.20 0.05 23%
0%
2 horse 0.06 0.22 0 85%
2 cow 0.09 0.22 0 53%
2 chicken 0.08 0.35 0 17%
2 goose 0.10 0.21 0 31%
0%
3 horse 0.03 0.23 0 49%
3 cow 0.07 0.15 0 48%
3 chicken 0.08 0.15 0 36%
3 goose 0.11 0.25 0 25%
0%
4 horse 0.05 0.24 0 25%
4 cow 0.09 0.18 0.02 39%
4 chicken 0.10 0.22 0 33%
4 goose 0.05 0.15 0 29%
We averaged the total number of individual mistakes for each membership category when the correct answer was Young and then rearranged them according to the Animal in the corresponding sequence. Percentages are all significantly different in all cases (with both variance test and Kruskal-Wallis non-parametric test).
TABLE 7: Mistakes when the correct answer is Young, By Stage and Animal
Type of mistakes when the correct answer is Young,
Correct &KLOGUHQ $GROHVFHQWV $GXOWV (OGHUO\
&KLOGUHQ .407 .222 - .275 .325 $GROHVFHQWV .070 .357 - .192 .256 $GXOWV - .220 - .246 .350 .095 (* ) (OGHUO\ -.323 - .325 .152 .499 Correlation is significant at the 0.01 level (2-tails), except where marked with * in which case it is significant at the 0.1 level.
TABLE 8: Correlation between correct answers and mistakes when the correct answer is Young, Aggregate
7KHGHYHORSPHQWRIVWUDWHJLHV
[image:16.612.122.492.138.414.2] [image:16.612.97.515.472.551.2]16
observations (this would be impossible with a division in four parts as before). The assumption that there are principles and stability behind answers given only once or twice may be far-fetched; we thus consider strategies only iterated responses to combinations that appear at least four times during the experiment (but on average they appear ten times) and at least three times in any of the phase. In each of the three phases, we count as strategies identical responses given from individual players at least 75% of the times.
As expected, players develop quite stable associations between combinations and responses. The number of strategies we observe increases from 130 in the first phase to 235 in the third. The strategies also become increasingly accurate (56% and 67% of them are correct, in phase one and three respectively). While it is true that the players improve their overall performance throughout the experiment, mistaken strategies represent anyway, a sizeable proportion of all strategies: 42% in the last phase (31% in the first). Though we require that they be selected 75% of the times, some strategies were chosen 100% of the times. And these were no more accurate: only 57% are correct, while 43% are wrong (though they often ensure a positive score). And these are likely the consequences of a failure in processing or in implementing some observed feedback.
7KHOLPLWHGHIIHFWRIIHHGEDFN
Since a player’s theory only encompasses a finite numb er of presumably relevant features, it seems plausible that feedback only matters for the aspects currently covered by a theory. Though a theory may disregard certain features (e.g. Shape), the very decision to disregard some information must follow from a portion of the theory itself: a theory might maintain that focusing on a subset of elements will not compromise the possibility to understand the functioning of the remaining elements. For example, we can assume that theories do not even consider the possibility that "whether the internal sum of the turn number is even or odd" or "whether the features of the card are alphabetically ordered" matter in the experiment. One may surely translate this as a tacit portion of the theory maintaining that "alphabetic ordering of the features" and "internal sum of the turn number" do not matter. Because it is tacit, however, no player (we again assume) processed such information into knowledge, though he could easily observe it every turn. Each theory filters information differently and is therefore subject to different revisions, these revisions again produce different feedback filtering, and so on. Nonetheless, a large majority of the participants manages to process feedback in a successful manner, and in a manner that is quite similar for all subjects (more on this below).
7XUQ $QVZHUJLYHQ
12 no answer 26 (OGHUO\
56 (OGHUO\
60 (OGHUO\
109 Adolescents 122 Adolescents
135 Adults
144 Adults
171 (OGHUO\
181 Adults
199 Adults
209 Adults
TABLE 9: Responses to
17
One of the common ways to react to feedback, however, is to somewhat disregard it. We can see this by observing the responses that one of our subjects gave to the sequence Chicken-Oval-Left, whose correct answer was Elderly (TABLE 9). After a skipped answer at turn twelve, the player seems to
identify the correct responds, which he then repeats twice. One would imagine the player has understood and is going to consistently give the correct response from now on. Instead, he switches to Adolescents, which he gives twice. He moves to Adults, again twice. Afterwards, at turn 171, the player returns to the correct response. He finally stabilizes, from turn 181 to end, on the incorrect answer Adults. This player incurs in seven mistakes, including the missed response. After three of these (out of six possibilities, because the last cannot be repeated), he confirms the same one. This player therefore has a 50% confirmation rate for this sequence. We calculate similar frequencies for every sequence and then compute a mean value for single players. The student in the example above confirmed 34% of the errors. The mean value, among all players, of wrong confirmed answers is about 33%. The probability to confirm by chance m out of n answers, can be computed using a binomial function. The probability of a random confirmation is 1/ 5 (as there are five possible answers). We can reject this possibility for 18 out of 23 players with a 95% interval and for 20 with a 90% interval.
The trend of this phenomenon, moreover, is rather counterintuitive because the number of confirmed mistakes scales up: it is 27% in the first stage, 31% in the second, 39% in the third and just in the last part it starts to go down 37%16. The differences between stage 1 and 2 is almost significant both with the t test for paired sample (p value 0.15) and Wilcoxon test (p value 0.11); the difference between the second and third period is again significant with both t test (p value= 0.032) and Wilcoxon (p value= 0.047). The difference between the last two periods is not significant (the p value of the t test is 0.437 and that of the Wilcoxon test is 0.375)17. The reduction of the last part indeed is not homogeneous among players18.
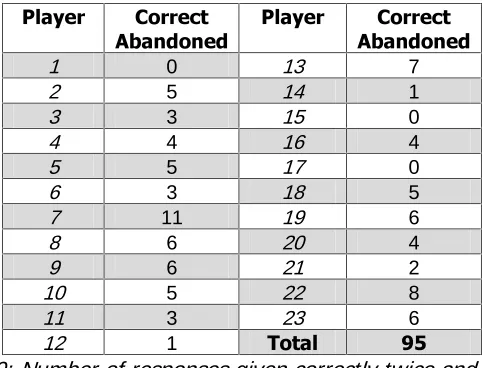
These results suggest that the rate of confirmation of mistakes increases when the players presumably base their decisions on a broader theoretical model of the experimental world, in an attempt at building a singular consistent model for the largest possible number of frequencies. Such model evolves during the experiment and it should indeed lead to a larger number of confirmed mistakes towards the end. Each player often confirmed mistakes in different sequences during the experiment precisely because they reflect an attempt at harmonising different rules. Mistakes, so, result from reasoning and cognition and not at random or from some adaptive or reinforcement mechanism. Not even a simple mechanism for the acceptance of a satisfactory result would explain this tendency because it does not justify the fact that it happens only with some sequences and not with others. Some mistakes, therefore, are reproduced on given sequences throughout the game, while others appear suddenly on sequences for which the phenomenon had not happened before. Conversely, there are 335 correct responses given at least twice, of which 101 (30%) are later abandoned. Consider the similar and more surprising cases in which a player abandons a correct
16
Consider the sequence in table 9. I f the player makes a mistake at turn 56, there is one mistake which can be confirmed. The next time the same sequence appears, during turn 60, belongs to the second stage. We thus count the eventual confirmation as a confirmation in the second stage even though the original mistake occurred during the first, because we are here interested in the confirmation and it cannot occur in the first stage.
17
Also the differences between the first and the third and between the first and the fourth are significant, but not that between the second and the fourth.
18
18
strategy after (at least) two repetitions and makes (at least) two mistakes. A pattern of this kind can hardly be accidental (the probability of giving the same answer twice to the same combination by chance is 4%), especially when it is as common as TABLE 10 reveals.
3OD\HU &RUUHFW $EDQGRQHG
3OD\HU &RUUHFW $EDQGRQHG
1 0 13 7
2 5 14 1
3 3 15 0
4 4 16 4
5 5 17 0
6 3 18 5
7 11 19 6
8 6 20 4
9 6 21 2
10 5 22 8
11 3 23 6
12 1 7RWDO
TABLE 10: Number of responses given correctly twice and then twice incorrectly, by player
Three players never incurred in this kind of conduct and two others only do so once. But every other player responds correctly twice and then incorrectly twice to several sequences (average and median is about four). The variance is very high because someone had not given answers of this type while someone did so no less than eleven times. We also note that the average distance (in turns) between a given correct answer and the next forgotten or remembered identical sequence is twenty-three and twenty-two turns respectively. There are even thirty-three correct answers which are abandoned within fifteen turns. We can thus reject the possible explanation that players remember the sequence when it is repeated in the immediately subsequent turns, but then forget it when it reappears much later in the game. We instead regard these patterns as further evidence of work in progress. If the players are subjecting their theories to some revisions, they probably respond in a certain way – be it correct or not – for a number of turns until they move on to a new theory.
&RQFOXGLQJUHPDUNV
We presented an experiment aimed at studying the way in which persons learn to perform a complex task which requires both memorisation skills and the ability to understand how to best employ several pieces of information. Our background hypotheses derive from several economic models inspired by cognitive psychology, which show in various ways how a central aspect of learning is the processing of information and the management of feedback. In contexts like that of our experiment the decision-making problem is substantially different from that faced by a fully rational standard agent. A comparison with the received microeconomics view on learning, therefore, can be meaningful only when it is confined to some specific aspects. Since the environment was stable, had the game lasted longer – though how much longer we cannot say – it is probable that every player would have understood the correct criterion (perhaps with a subjective representation that deviates from ours). Our goal was to identify some mechanisms of learning by transcending the usual focus on performance, to penetrate its black box.
[image:19.612.185.426.123.307.2]19
are the product of a learning process which takes time. Once they have been developed, they become harder to amend, because that probably calls for a much finer understanding of the environment together with the alteration of the already crystallised mental representation. The confirmation of mistaken answers and the abandonment of correct ones only seem explainable if the data are interpreted within a broader theory of the functioning of the experimental world. Such interpretations may then translate into simplified strategies with some general validity in a variety of contexts (in the experimental world). These strategies are quite stable, but they may be subject to revisions according to a crucial trade-off between capacity for change and tendency to stability.
The results obtained confirm the hypotheses we advanced and reinforce the previous observations in Novarese and Rizzello (2006) and they are, more generally, in line with a wide economic and psychological literature on the subject. The construction of an alternative decision model is bound to emerge from a more refined understanding of the way people interpret situations and simplify them, thereby reducing the number of variables they evaluate and creating broad categories. Bounded rationality, however, does not entail choices given at random or without context-specific principles. The results in TABLE 7 can also be interpreted in terms of reinforcement learning, since they connect
20
5HIHUHQFHV
• Arthur, W. B. (1992). “On Learning and Adaptation in the Economy”. Santa Fe I nstitute Working Paper 92-07-038
• Bandura, A. (1977). Social Learning Theory. Englewood Cliffs, NJ: Prentice-Hall
• Best, J. (1990). “Knowledge Acquisition and Strategic Action in ‘Mastermind’ problems”. Memory & Cognition, 18 (1): 54-64
• Egidi M. (2002). "Biases in Organizational Behavior" in: Augier, M., and J. J. March (eds.) The Economics of Choice, Change and Organization: Essays in Memory of Richard M. Cyert. Aldershot: Edward Elgar, pp. 190-242
• Feldman J. (1973). “Simulation of behaviour in the Binary Choice Experiment” in: Feigenbaum, E. A., and J. Feldman (eds.), Computers and Thought, pp. 329-346
• Garner, W. R. (1962). Uncertainty and structure as psychological concepts. New York: Wiley.
• Hayek, F. (1952). The Sensory Order: An I nquiry into the Foundations of Theoretical Psychology. Chicago: The University of Chicago Press
• Heiner, R. A. (1983)- “The Origin of Predictable Behavior,” American Economic Review, 73 (4): 560-595
• Heiner, R. A. (1985). “Origin of Predictable Behavior: Further Modelling and Applications”. American Economic Review, 75 (2): 391-396
• Lakoff, G., and M. Johnson (1981). Metaphors We Live By. Chicago: The University of Chicago Press
• Lee, F., and J. Anderson (2001). “Does Learning a Complex Task Have to Be Complex? A Study in Learning Decomposition”. Cognitive Psychology, 42: 267-316
• Marcet A. and T. Sargent(1989). “Convergence of least squares learning mechanisms in self referential linear stochastic models”. Journal of Economic Theory, 48: 337-68
• Nelson, R. (2005). “Bounded Rationality, Cognitive Maps, and Trial and Error Learning”. LEM Working Paper Series, 2005/ 28 (december)
• Novarese, M., and S. Rizzello (2006). “A Cognitive Approach to I ndividual Learning: Some Experimental Results”, in: Arena, R. and A. Festrè (eds.) Knowledge and Beliefs in Economics. Aldershot: Edward Elgar, pp. 203-219; preliminary version: < http:/ / 129.3.20.41/ eps/ get/ papers/ 0301/ 0301001.pdf>
• Rizzello, S., and M. Turvani (2002). “Subjective Diversity and Social Learning: A Cognitive Perspective for Understanding I nstitutional Behaviour”. Constitutional Political Economy, 13 (2): 197-210
• Roth, A., and I . Erev (1998). “Predicting how People Play Games: Reinforcement Learning in Experimental Games with Unique, Mixed Strategy Equilibria”. American Economic Review, 88 (4): 848-881
• Simon, H. A. (1983). Reason in Human Affairs. Stanford: Stanford University Press
21
$SSHQGL[7DEOHV
7XUQV 0LVWDNHV µ/HDUQLQJ 7XUQV 0LVWDNHV µ/HDUQLQJ
1-10 0.74 -- 121-130 0.58 - 13%
11-20 0.71 4% 131-140 0.53 8%
21-30 0.66 7% 141-150 0.52 2%
31-40 0.60 9% 151-160 0.47 9%
41-50 0.66 - 9% 161-170 0.54 - 15%
51-60 0.62 6% 171-180 0.48 11%
61-70 0.57 8% 181-190 0.49 - 1%
71-80 0.65 - 15% 191-200 0.48 1%
81-90 0.58 11% 201-210 0.46 5%
91-100 0.54 7% 211-220 0.54 - 19%
101-110 0.54 - 1% 221-231 0.51 6%
111-120 0.51 6%
[image:22.612.124.487.109.323.2]22
DQLPDO VKHOI VWDJH HOGHUO\ DGXOWV DGRO FKLOGUHQ 1$
horse right 1 0.02 0.12 0.35 0.52 0.00
horse left 1 0.09 0.14 0.38 0.24 0.14
chicken right 1 0.37 0.32 0.08 0.20 0.03
chicken left 1 0.27 0.45 0.18 0.09 0.00
cow right 1 0.03 0.17 0.33 0.47 0.00
cow left 1 0.17 0.18 0.42 0.23 0.00
goose left 1 0.39 0.25 0.20 0.11 0.05
* * (KW)
horse right 2 0.07 0.18 0.38 0.38 .
horse left 2 0.06 0.25 0.48 0.22 .
chicken right 2 0.32 0.21 0.32 0.16 .
chicken left 2 0.40 0.27 0.33 0.00 .
cow right 2 0.05 0.11 0.47 0.37 .
cow left 2 0.11 0.25 0.39 0.25 .
goose right 2 0.16 0.43 0.26 0.15 .
goose left 2 0.25 0.60 0.13 0.03 .
* * (KW) * * (AV, KW)
horse right 3 0.07 0.16 0.40 0.37 0.00
horse left 3 0.02 0.30 0.40 0.27 0.01
chicken right 3 0.25 0.49 0.15 0.11 0.00
chicken left 3 0.44 0.33 0.16 0.06 0.00
cow right 3 0.00 0.19 0.47 0.34 0.00
cow left 3 0.11 0.12 0.50 0.27 0.00
goose right 3 0.19 0.31 0.31 0.19 0.00
goose left 3 0.23 0.45 0.23 0.10 0.00
* * (KW)
horse right 4 0.00 0.21 0.44 0.35 0.00
horse left 4 0.09 0.25 0.54 0.13 0.00
chicken right 4 0.28 0.44 0.18 0.10 0.00
chicken left 4 0.37 0.32 0.24 0.08 0.00
cow right 4 0.12 0.12 0.41 0.34 0.01
cow left 4 0.07 0.30 0.35 0.24 0.03
goose right 4 0.28 0.53 0.14 0.06 0.00
goose left 4 0.42 0.37 0.17 0.04 0.00
* * (AV, KW) * * * (KW)
Percentages are significantly different in all cases (with both variance test and Kruskal-Wallis non-parametric test), except where marked with * * (in parenthesis is marked the non significant test), in which case it is significant at the 0.05 level. When marked with * * * the difference is not significant
23
$SSHQGL[(QWURS\
Consider correct answers: in the case of a given sequence of two features (Cow-Right) in a phase of the game (the fourth). Out of five occasions in which the sequence appears, the correct answer is four times Young and once it is Children. We calculate the relative frequency of these values and the corresponding logarithm. We then multiply relative frequency by the log and we sum the two results thus obtained: such sum is the entropy. It is possible to compute the same value for each sequence, starting either for the correct answers or for the actual responses given by a player.
HOGHUO\ DGXOWV \RXQJ FKLOGUHQ DGRO WRWDO
0.00 0.00 4.00 1.00 0.00 5.00 frequency right answers
0 0 0.800 0.200 0 frequency
-0.100 -0.700 logarithm of the frequency
logarithm of the frequency * frequency
24
$SSHQGL[,QVWUXFWLRQV
I n what follows we report the instructions of the game you will take part in. You will be compensated with real money (40 I TL per point).
The Game
An association has different membership categories which pay different fees and have access to different services.
The categories are: - children
- adolescents - young - adults - elderly
Children and adolescents do not pay. Young pay a reduced fee. Adults and Elderly pay the full fee.
Members’ information are recorded on a set of cards, stored on different shelves. Each card is characterized by: - the drawing of an animal
- the drawing of a shape - a shelf
e.g. A card might have the drawing of a cow and a square, and be placed on the right shelf.
We ignore the classification system and thus which cards corresponds to which category. The goal of the game is to understand this correspondence.
The game lasts 231 turns. I n each turn you will be shown the information from one card, so you will see information about:
- animal - shape - shelf
Based on this information you shall indicate the correct membership category, keeping in mind that: - there is a logical relationship between the information and membership categories
- the relationship is constant throughout the game
- the relationship is completely artificial (therefore it is neither necessary nor useful to have experience of actual filing systems or any other specialised knowledge)
Obviously, the earliest answers will be given at random.
Therefore each turn the game will take place this way: 1- You see the information;
2- You give your answer (note: you must choose within 10 seconds, after this time the system proceeds to the next turn);
3- You are told the correct answer and your score in the last turn. 4- You move on to the next turn and you start again.
During the game you are not allowed to talk, nor to take notes
The Score
I n order to calculate the score we define the distance between the answer you gave and the correct answer, as follows: