Volume 72– No.5, May 2013
Categorical Data Clustering based on an Alternative Data
Representation Technique
Jyoti Prokash Goswami
Dept of Computer Applications
Assam Engg. College Guwahati, Assam
Anjana Kakoti Mahanta
Dept of Computer Science Gauhati University Guwahati, Assam
ABSTRACT
Clustering categorical data is relatively difficult than clustering numeric data. In numeric data the inherent geometric properties can be used in defining distance functions between data points. In case of categorical data, a distance or dissimilarity function can’t be defined directly. An extension of the classical k-means algorithm for categorical data has been done in [1], where a method of representing a cluster using representatives which are very much similar to means used in k-means algorithm has been proposed together with a new distance measure. In this paper we first propose an alternative representation of categorical data as numeric data making it easier to handle. This technique provides a uniform representation for data points and the cluster representatives. The similarity measure proposed in [2] has been used in this new setting. The algorithm used in [1] has been implemented and tested with this new setting and the results obtained have been reported. Experiments were conducted on two real life data sets, namely, soybean diseases, and mushroom data sets. The clusters obtained in soybean dataset are pure clusters with hundred percent accuracy. In the other dataset also it gives relatively higher accuracy with small errors.
Keywords
clustering, categorical data, cluster representative
1.
INTRODUCTION
Clustering is one of the most useful data mining techniques. Clusters are formed from a given data set by assigning the similar data objects into a cluster so that intra-cluster similarity of data is maximized and inter-cluster similarity of data is minimized. Clustering techniques that deals with numeric data such as k-means, k-medoids are relatively easier as measuring similarity or dissimilarity between two data points as well as between a data point and the cluster centers can be done easily using a distance metric. In case of categorical data, where some of the attribute values are categorical, it is difficult to compare or find differences between two attributes values that belong to two different data points. Some proposed and efficient categorical data clustering algorithms are ROCK (Guha et al.1999), QROCK (M.Dutta et al. 2005), CACTUS (Ganti et al. 1999), etc. Extension of the classical k-means algorithm for categorical data has been done in [1], where a method of representing a cluster using representatives which are very much similar to means used in k-means algorithm has been proposed. Here the cluster representatives are sets. Each element in this set represents a category or value of an attribute. All such values corresponding to the categories of the same attribute constitute a fuzzy set on the corresponding attribute set values or domain. The membership values are nothing but the relative frequencies of the categories within the cluster. A new distance function has also been proposed. Then the k-means
like algorithm is implemented with this new setting and results reported. In this paper we first propose an alternative representation of categorical data as numeric data making it easier to handle. This technique provides a uniform representation for data points and the cluster representatives. The representation scheme proposed in [1] applies only for the cluster representatives but not for the data points. A new similarity measure proposed in [2] has been used by us. The measure is based on the notion of fuzzy sets. This measure can be used to compute the similarity value between a data point and a cluster representative as well as between two data points. The measure is also a normalized one taking values between 0 and 1 both inclusive. The algorithm used in [1] has been tested with this new setting and the results obtained have been reported. The remainder of this paper is organized as follows. In the next section, we discuss some recent and similar works on categorical data clustering. In section 3, we propose a method for converting categorical data into numeric data for efficient handling for the purpose of clustering with the help of a small example. We elaborate the algorithm introduced in (1) which has been used for the clustering purpose in section 4. In section 5, the concept of defining data points as well as the cluster representatives as fuzzy set is given. Implementation detail and the experimental results obtained with two well-known data sets, namely, soybean disease and mushroom data set are reported in section 6. Section 7 deals with a brief description of the data sets. Finally, in section 8 conclusion of the work is presented with a line of future work.
2. REVIEW OF RELATED WORKS
Volume 72– No.5, May 2013 cluster. The distance between two categorical objects x1, x2 Є
data set D having m attributes is defined as follows d (X1, X2) = δ(x1,j, x2,j)
𝑚 𝑗 =1
where, δ(𝑥1,𝑗 , 𝑥2,𝑗) = 0 𝑖𝑓 𝑥1,𝑗 = 𝑥2,𝑗
1 𝑖𝑓 𝑥1,𝑗 ≠ 𝑥2,𝑗
Given a cluster {X1,………Xp} of categorical objects
with Xi = (xi,1,………..,xi,m}, 1≤ i ≤ p then its mode is
defined as Q = (q1,q2,……….qm) by assigning qj, the
category most frequently encountered in {x1,j,………..xpj} (1).
Applying these modifications Huang (1998) proposed k-modes algorithm to cluster categorical data. Since by definition, the mode of a cluster is not generally unique, the algorithm becomes unstable during the clustering process. Drawbacks of the k-mode algorithm for clustering categorical data are removed in (1). A new notion of cluster centers called representative is introduced there. The notion of fuzziness is used in defining representative instead of mean. Initially for each cluster the representative is computed after assigning the data points randomly to the clusters. Dissimilarity between a data point and all cluster representatives are calculated and the data point is reassigned to the cluster having least dissimilarity. After this both the concerning cluster representatives are updated. This process continues until no data point has changed clusters after a full cycle test of the whole data set. The algorithm ROCK (3), introduced by (Guha et al 1999), is an agglomerative hierarchical clustering algorithm for categorical data. In this algorithm, notions of neighbours and links are introduced. A point’s neighbours are those points that are considerably similar to it. For this, a similarity function between points are defined which captures the closeness between pairs of points. A user defined threshold is used and pairs of points for which the similarity function value is greater than or equal to this value are considered to be neighbours. The number of links between pairs of points is defined to be the number of common neighbours for the points. The larger the number of links between a pair of points, the greater is the likelihood that they belong to the same cluster. Starting with each point in its own cluster, the algorithm repeatedly merges the two closest clusters till the desired number of clusters remain or when a situation arises in which no two clusters can be merged. The ROCK algorithm is modified and proposed as QROCK in (4). It is shown that the output of the ROCK i.e. the ultimate clusters obtained (after satisfying the terminating condition that when there is no nonzero links between the clusters) are the connected components of a certain graph with the input data point as vertices. Clusters are efficiently computed by determining the connected components of the graph. There is no need to compute the links between the pairs of points and thus it reduces the cluster computing time of the ROCK algorithm drastically. Since it is more natural to specify the similarity threshold than specifying the value of k beforehand so importance has been given there on the former. A new similarity measure for categorical attributes is also proposed there. An incremental clustering algorithm IROCK is proposed in (5), which is claimed to be efficient for clustering large categorical data set. It is comparatively difficult to handle very large data sets and for this reason the sampling technique is applied in analyzing the data. Here instead of applying sampling technique the whole data set is divided into some groups of convenient size first so that each group is well fitted in the main memory. Then applying the ROCK algorithm to each group one after another and merging the sub-clusters obtained from each group the clusters for the entire data set is determined. Information about the
sub-clusters are maintained in a compact form as distribution summary vector as in (2). At any given time, sub-clusters obtained from the current group are merged with the sub-clusters distribution summary vector (for the first group) or the distribution summary vector of the already merged clusters. Memory requirement of this algorithm is small since the data points belong to one group only are to be kept in at any time along with the compact sub-clusters distribution summary vector. A new fuzzy clustering algorithm for categorical data is presented in (6). The only information included before in the objective function of the k-modes algorithm was within-cluster information and the aim was to minimize the function so that it minimizes the within-cluster dispersion. Here in this algorithm the objective function of the k-modes algorithm is modified by adding the between-cluster information so that simultaneously it helps in minimizing the within-cluster dispersion and enhancing the between-cluster separation. For obtaining the local optimal solutions of the modified objective function, the corresponding update formulas of the membership matrix and the cluster prototypes are strictly derived (6). The algorithm is tested on several real data sets from UCI and claimed to be effective and suitable for categorical data sets. The superiority of multidimensional clustering on categorical data over unidimensional clustering is established in (7). Unidimensional clustering i.e. clustering which is done by partitioning data along single dimension (considering jointly all the attributes) is not always suitable for complex data with many attributes. It is said to be more reasonable to consider multidimensional clustering for these complex data, making them partition along multiple dimensions.
Volume 72– No.5, May 2013 possible to interpret the problem of categorical data clustering
as an optimization problem from the cluster ensemble point of view and which in turn help in devising improved or hybrid version algorithm for categorical data clustering by combining elements from these two fields. The experimental result from the proposed cluster ensemble based algorithm in [10] gives better clustering accuracy than previous algorithms. Performances of five categorical data clustering algorithms are evaluated in [11] by means of Monte Carlo simulation and compared. Artificial data are generated or simulated using Beta and Uniform distributions. It has been identified the overlapping as a factor with major impact on the accuracy of all algorithms. Impact of increasing the number of clusters is comparatively more on performance of algorithms than increasing the number of categorical variables. Again, the average recovery rates are found higher for data with difference in occurrence of categories (Beta data) than the data with approximately the same frequency of categories (Uniform data). The importance of simulated data sets have been established there in analyzing the impact of factors like overlapping, number of clusters, categorical variables and categories in the final solution.
3.
METHOD
FOR
CONVERTING
CATEGORICAL DATA TO NUMERIC
DATA
The data are read from the text file. The data file contains description of objects where each object is described by using a fixed number of features or attributes. In this paper we sometimes call the objects as data points in the data set. Our study is concerned with data sets where the attribute values are categorical. Normally in such a data file the sizes of the attribute domains are small. The number of attributes (say m) and the number of distinct values that each attribute can assume (we consider this value as the corresponding domain size) in the data file, is given as input. Any arbitrary ordering of the values taken by each attribute is made. Let s denote the sum of the domain sizes. Logically we can think of each record in the data set as a 0/1 vector of size s. Corresponding to every attribute A and value v in the corresponding domain, we associate an index in this vector such that values in the same domain are assigned consecutive indexes. The vector vi
describing an object Oi contains 1 in those index positions that
correspond to the attribute values of the object and the remaining indexes are assigned value zero. Physically however for each object only the non-zero index positions are kept. A following small example will illustrate the data conversion method.
The data set is shown below, having description of ten objects. Each object is described with three attribute values. Color height category
green high edible red medium edible green low edible red medium poison brown low edible yellow high poison orange high poison brown medium edible red low poison green medium edible The values taken by the first attribute are 'brown'
'green'
'orange' 'red' 'yellow'
The values assumed by the second attribute are 'high'
'low' 'medium'
and that of the third attribute are 'edible'
'poison'
The ordering of the attribute values have been done arbitrarily as shown above. After carrying out the conversion method the converted data set is
2 6 9 4 8 9 2 7 9 4 8 10 1 7 9 5 6 10 3 6 10 1 8 9 4 7 10 2 8 9
4. ALGORITHM USED FOR THE
PURPOSE OF CLUSTERING
Since the k-means like algorithm introduced in (1) has been used by us for the purpose of clustering, for the sake of completeness the algorithm along with its background is elaborated here.
The cluster centers for categorical objects are named as ‘representative’ in this algorithm. In defining the representatives which are very similar to means used in k-means the notion of fuzziness has been used. An object in the data set D is defined by a set of attributes A1 ………….. Am ,
with domain 𝓓1 ………… 𝓓m respectively. Each object in D
is represented by a tuple t Є 𝓓1 × ……… × 𝓓m
.
To define the notion of cluster representative a cluster C is taken with p categorical objects. i.e. C = {X1 …….Xp} , with
Xi = ( xi,1, ………, xi,m) , 1 ≤ i ≤ p . Dj
denotes the set formed
from categorical values (x1j ……….xpj ). Now representative
of cluster C is defined by Q= (q1,………...qm ), with
qj ={( cj,fcj)│ cjЄ Dj}, where fcj is the relative frequency of
category cj within C , i.e. fcj = ncj/p, where ncj is the number of
objects in C having category cj at attribute Aj. Thus, each qj
can be interpreted as a fuzzy set on Dj with membership
grades of elements defined by their relative frequencies within the cluster.
The dissimilarity function between a categorical object X= (x1,……….…..xm) which may or may not be in cluster
C= { X1 ….….Xp} , with Xi = ( xi,1, ……..….’ xi,m), 1 ≤ i ≤ p
and its representative Q is defined as
d X, Q = 𝑚
𝑗 =1
fcj 𝑐𝑗 Є 𝐷𝑗
δ(Xj , Cj )
Volume 72– No.5, May 2013 δ(𝑋𝑗 , 𝐶𝑗) =
0 𝑖𝑓 𝑋𝑗 = 𝐶𝑗 1 𝑖𝑓 𝑋𝑗 ≠ 𝐶𝑗
The relative frequencies of categorical values within the cluster and simple matching between categorical values have major influence on the dissimilarity value d(X,Q). Applying these concepts clustering categorical data problem is formulated as a partitioning problem similar to k-means as follows.
1. Initialize a k partition of the data set randomly.
2. Calculate k representatives, Q1,Q2,…………Qk, one for
each cluster.
3. For each Xi calculate the dissimilarities d(Xi, Ql) , l = 1,
………., k
Reassign Xi to cluster Cl, having Ql as representative (from
cluster Cl’, having Ql’ as representative say ) such that the
dissimilarity between Xi and Ql is least. Update both Ql and
Ql’.
4. Repeat step 3 until no object has changed clusters after a full cycle test of the whole data set.
5. PROPOSED CONCEPTS
In this paper we propose a uniform way of defining data points as well as clusters as fuzzy sets. The logical representation of data points as a 0/1 vector as elaborated in section 2 will be used in our discussion here. We can think of each data point as a fuzzy set defined over the universal set
U =
i
D
mi1
. We know (section 2) that in this 0/1 vectorrepresentation of data points each distinct value in each domain has a unique index in the 0/1 vector. The value (0 or 1) stored in the i-th position in the vector will give the membership value for that particular attribute value in U. In a similar way cluster representatives can also be defined as a fuzzy set over U. In this case however the membership values may be any number between 0 and 1 not merely the values 0 and 1. If we consider a cluster C with q data points and Fc as
the fuzzy set representation of the cluster then the fuzzy membership function μFc is defined as follows.
μFc : U →[0,1]
For k = 1,2,……….,m ; μFc (ik) = uk where uk is the fraction
of points in C having the corresponding attribute value. If p number of points in the cluster C have that particular attribute value and q is the size of the cluster then uk =p/q. The
membership function gives us an estimate of the number of data points in a cluster that contain a particular attribute value. On the other way it also signifies the importance of an attribute value for a particular cluster. The membership value of an attribute value in a cluster is 1 implies that all data points in that cluster have that particular attribute value. After working out the above uniform representation of data points as well as cluster representatives as fixed size vectors taking up values between 0 and 1, the similarity value between a data point and a cluster representative and between any two data points can be calculated using the following function ‘sim’ that has been proposed in [2].
Let P1 be a data point and S1 be a cluster representative and let
FP1 and FS1 be the fuzzy sets representing the P1 and S1
respectively then
𝑠𝑖𝑚(𝑃1 , S1) =
│Fp1 Fs1│ │Fp1 Fs1│
Here the fuzzy union, intersection and cardinality of fuzzy sets are as has been defined in the literature [12].
We use the method proposed by Hwang (1998) for measuring clustering results, known as clustering accuracy, which is defined as follows.
r = 1 𝑛 al
𝑘
𝑙=1
where al is the number of data objects that occur in both
cluster Cl and its corresponding labeled class, and n is the
number of objects in the data set. Further, the clustering error is defined as e = 1 – r.
6. IMPLEMENTATION AND RESULTS
OBTAINED
The algorithm for clustering categorical data, discussed in the previous section, is implemented with the language of technical computing viz., MATLAB. One program is developed to implement the method for converting the categorical data as elaborated in section (3) into a suitable form for the purpose of clustering. These data are used by an another program which first assigns them to different clusters randomly then it represents the data in terms of zeros and ones and the representatives of cluster are computed. Then the program determines the dissimilarities of each data point or object in the data set from these cluster representatives and reassign the data points to the cluster with whom the dissimilarity is minimum. The representatives of cluster are modified . After some iterations it results no reassignment of clusters and the final clustering result of the data comes out.
Table 1 : Experimental result for Small Soybean data set
Cluster Number
No. of data pts In class label ‘D1’
No. of data pts In class label ‘D2’
No. of data pts In class label ‘D3’
No. of data pts In class label ‘D4’
Total No. of data pts
1 6 0 0 0 6
2 4 0 0 0 4
3 0 10 0 0 10
4 0 0 0 17 17
5 0 0 10 0 10
Volume 72– No.5, May 2013
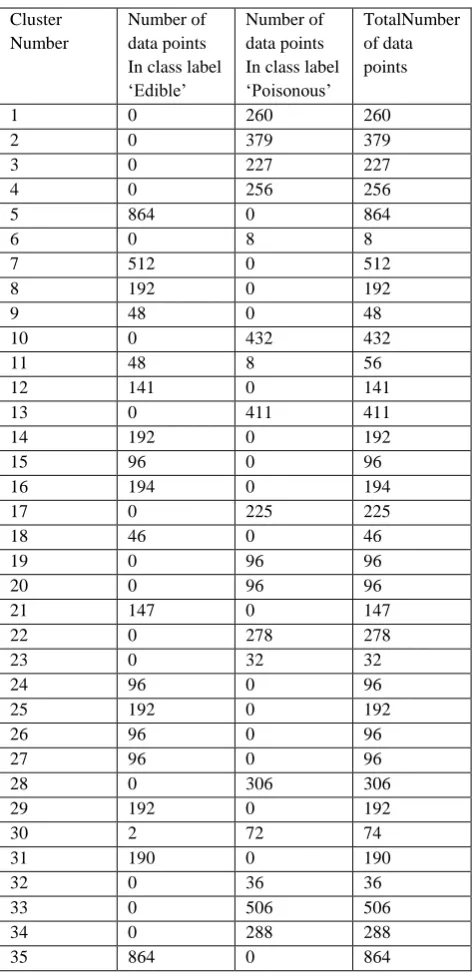
Table 2: Experimental result for Mushroom data set
Cluster Number
Number of data points In class label ‘Edible’
Number of data points In class label ‘Poisonous’
TotalNumber of data points
1 0 260 260
2 0 379 379
3 0 227 227
4 0 256 256
5 864 0 864
6 0 8 8
7 512 0 512
8 192 0 192
9 48 0 48
10 0 432 432
11 48 8 56
12 141 0 141
13 0 411 411
14 192 0 192
15 96 0 96
16 194 0 194
17 0 225 225
18 46 0 46
19 0 96 96
20 0 96 96
21 147 0 147
22 0 278 278
23 0 32 32
24 96 0 96
25 192 0 192
26 96 0 96
27 96 0 96
28 0 306 306
29 192 0 192
30 2 72 74
31 190 0 190
32 0 36 36
33 0 506 506
34 0 288 288
35 864 0 864
cluster accuracy : 0.998769 : cluster error : 0.001231
7. DESCRIPTION OF THE DATA SETS
USED
We are using two real-life data sets viz., the Small Soybean dataset, and the Mushroom dataset which are taken from the
UCI Machine Learning Repository.
(http://www.ics.uci.edu/pub/machine_learning_database)
7.1 Small Soybean Dataset
This dataset consists of 47 instances with 35 attributes related to soybean disease diagnosis. The whole dataset is classified into four classes of diseases viz., D1,D2,D3 and D4. The number of instances belongs to each classes D1,D2,D3 and D4 are 10,10,10 and 17 respectively.
7.2 Mushroom Dataset
It is a comparatively large dataset having 8124 instances of mushroom with 22 attributes. Each object of the dataset is either from edible class or from poisonous class. 4208 (51.8%) instances are from edible class and the rest, i.e. 3916 (48.2%) from poisonous class.
8. CONCLUSION AND LINES FOR
FUTURE WORK
In this paper we propose an alternative representation of categorical data as numeric data making it easier to handle. This technique provides a uniform representation for data points and the cluster representatives. The similarity measure proposed in [2] has been used by us. The measure is based on the notion of fuzzy sets. This measure can be used to compute the similarity value between a data point and a cluster representative as well as between two data points. The measure is also a normalized one taking values between 0 and 1 both inclusive. With this new setting the algorithm used in [1] has been implemented and tested Experiments were conducted on two real life data sets, namely, soybean diseases, and mushroom data sets. The clusters obtained in soybean dataset are pure clusters with hundred percent accuracy. In the other dataset also it gives relatively higher accuracy with small errors. However, the results for nursery data set taken from the UCI Machine Learning Repository (http://www.ics.uci.edu/pub/machine_learning_database) was not so satisfactory. In future experiment will be carried out by using feature selection techniques and outlier detection techniques for the sake of obtaining better results A serious drawback of the k-means algorithm is that the exact number of clusters has to be given as input. Which is difficult to know beforehand and the value given as input may not be correct. Attempts will be made to see if merging and splitting of clusters could be done during the execution of the algorithm so that the value of k is adjusted suitably by the algorithm.
9.REFERENCES
[1] OHN MAR SAN,VAN-NAM HUYNH, YOSHITERU NAKAMORI. (2004): An Alternative Extension of the k- Means Algorithm For Clustering Categorical Data, - Int. J. Appl. Math. Comput. Sci., Vol. 14, No.2, 241-247 [2] M. Dutta, A.Kakoti Mahanta. A Fast Summary Based Algorithm for Clustering Large Categorical Databases, Proceedings of ICWES12, Ottawa, CANADA. [3] Sudipto Guha, Rajeev Rastogi and Kyuseok Shim. ROCK: A robust clustering algorithm for categorical attributes. Proceedings of the IEEE International Conference on Data Engineering,, Sydney, March 1999. [4] M. Dutta, A.Kakoti Mahanta, Arun K. Pujari. QROCK: A Quick Version of the ROCK Algorithm forClustering Categorical Data.
[5] Malay Dutta, Anjana Kakoti . An Incremental Clustering Algorithm for Clustering Large sets of Categorical Data, Proceedings of CIT 2001 (4th International Conference on Information Technology), National Institute of Science and Technology, Berhampur, Orrisa, 20-23 Dec. 2001, 45-50
[6] Liang Baia,b, Jiye Lianga, Chuangyin Dang b, Fuyuan Cao a a. (2012): A Novel Fuzzy Clustering Algorithm with between Cluster Information for Categorical Data. [7] Tao Chen a, Nevin L. Zhang b, Tengfei Liu b, Kin Man Poon b, Yi Wang c. (2011): Model-based
Volume 72– No.5, May 2013 [8] Iam-On, N, Boongeon. T, Garrett,S,; Price,C. (2012): A
Link-Based Cluster Ensemble Approach for Categorical Data Clustering, Knowledge and Data Engineering, IEEE Transactions, Vol.-24, Issue: 3, pages: 413-425.
[9] Chiranth B.O, Panduranga Rao M.V, Basavaraj Patil S., A New Link Based Approach for Categorical Data Clustering, IJSR , Vol 1, Issue 3.
[10] Zengyou He, Xiaofei Xu, Shengchun Deng. A Cluster Ensemble Method for Clustering Categorical Data [11] Sue li A. Mingoti, Re nata A. Matos. Clustering Algorithms for Categorical Data: A Monte Carlo Study, International Journal of Statistics and Applications 2012, 2(4): 24-32