Usability and Evaluation of Software Quality
using Software Metrics
Pradeep Kumar
Department of Computer Science & IT, SHIATS, University Allahabad, India.
Dr. Raghav Yadav
Assistant Professor (Sr. Grade) Department of Computer
Science & IT , SHIATS University Allahabad,India
Dileram Bansal
Department of Computer Science & Engineering Sri Satya Sai Institute of
Science & Technology Sehore,Bhopal
ABSTRACT
It is difficult to understand, let alone improve the quality of software without the knowledge of its software development process and software product. There must be some measurement process to predict the software development, and to evaluate software products. This paper provides a brief view on Software Quality, Software Metrics and Software Metrics methods that will predict and measure the specified quality factors of software. It further discusses about the Quality as given by the standards such as ISO, principal elements required for the Software Quality and Software Metrics as the measurement technique to predict the Software Quality. This paper was performed by evaluating a source code developed in Java, using Software Metrics, such as Size Metrics, Complexity Metrics, and Defect Metrics. Results show that, the quality of software can be analyzed, studied and improved by the usage of software metrics.
Keywords
Software Metrics, Software Product Metrics, Product Metrics, Software Quality Metrics, Evaluation of Software Code, Usability of Software Metrics.
1.
INTRODUCTION
Quality is always an issue on which most of the researchers are working on, while developing the software. With the increase in the software market, customers are expecting software‟s of higher quality and they are even willing to pay higher prices for the software. With this increase in expectations and hike in the software market, companies and countries are continuing to invest great deal of money, time, and effort in improving the software quality [1]. Software quality cannot be improved without knowledge of development process. The number of bugs and the errors occurred during the software development process have to be found in the early stages of development for better quality. If the errors are found late, then the corrective action will be very expensive [2] [3]. Software organizations will be greatly benefited if there is process to plan and predict the software development. The process of measuring the software is known as software metrics. Software metrics is defined as, “an objective, mathematical measure of software that is sensitive to differences in software characteristics. It provides a quantitative measure of an attribute which the body of Software exhibits. Its aim is to development process of
software by controlling the different aspects .So it can be said that metrics are used to improve the ability to identify , control and measure the essential parameter during its development or it can also be said that measurement of software product and the process by which it is being developed. The information gained from software metric can be used to manage and control the development process, which will lead to improvement in the results of the software product. Good software metrics must have the ability to predict the software development process. The results obtained from the software metrics can be used to indicate, which parts of software have to changed or modified. Software metrics have proved to reflect the software quality, and thus they have been widely used in software quality evaluation techniques [6] [7]. Software metrics are studied as a way to access the quality of large system [8] [9] and have been applied to object oriented systems as well [8] [10] [11]. IEEE has published a standard for the software quality metrics methodology [17], which led to the development in this field. Its aim was to provide a systematic approach for the establishment of software quality metrics by identifying, implementing, analyzing and validating the software quality metrics of a system. The development of metrics as given by IEEE is given in Table 1.
Table 1: IEEE Software Metrics Methodology [17].
Software Quality Activity ---
Establishment of Software
Quality Requirements
---
Identifying the Software
Quality metrics
---
Implementation of Software Quality metrics
---
Analyzing the results of metrics -
Validating the metrics
2.
Software Quality
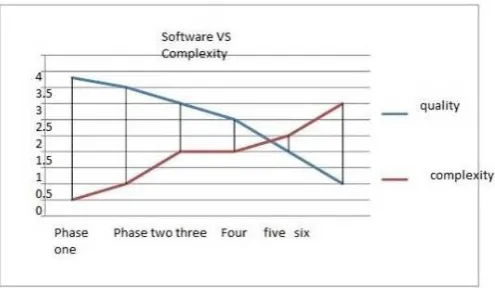
ruggedness of the car, or the fastness of the car, or the looks of the car. So from this it can be said as the definition of the software quality varies with the views of the person using or it can also be said as the views of the beholder. When it comes to software, the beholder is, the person using the software, or the person interacting with the software, when it is executed .That is, the person will be satisfied when the software does what he or she wants to do, when it is purchased. The software purchased includes the code, but the users will only be interested in the working and service offered such as the user manual, help and support .In case of software developed for the internal use in company or in an organization, the quality is about the performance of the software whenever the user asks the development organization to produce it. Quality cannot be defined by the technical excellence alone [18]. Quality of software gets affected by many human factors such as communication and motivation between the developers and testers, and the value of money for the development process. The developed software products and services must be affordable and the customer must be able to enjoy the usage of software. Different people have different views on delivering software products with quality. Even though the developers produce software products with new features, but with flaws and with higher price, then it will be of no use. Quality of the software products must be defined according to the user‟s view, i.e., does the software perform as I wanted? If not, then the user concludes that the software is not of good quality. It is the concept that defines the quality of software – the degree to which the software product will fulfill the requirements specified. The requirements can be functional, non- functional, and it can also be requirements for maintenance, portability and so on. The importance of this concept is that the requirements of the product are the requirements for the quality [19]. And these requirements must be in such a way that the user wants it to be. The ability to know what the user wants or expects from the software is the problem that affects the quality of software. Various studies show that 25% to 40% of defects in the software are caused due to the errors related to the requirements [18] [20]. According to the Capers, the requirement errors account for 30% defects in MIS applications, 15% in software in the system, 25% in software‟s of military systems and overall 25% [18][21]. A study done by Ray Rubey shows that, incomplete specification of requirements account for 28% of the defects and intentional deviation from the specified specifications caused 12% of defects [18] [22]. The above data indicates that by clearly specifying the requirements, quality of the software can be improved. Improvement in the quality also requires the practical implementation of requirements specified. The implementation process involves project planning, project budget (cost and time), and software lifecycle, designing, coding, and testing. Technical documentation and user manual for help are also required. Challenges are faced during the communication between different teams, during interfacing, ensuring cost and time lines, keeping the software bug free, verifying that the software is meeting the requirements, if not, then taking appropriate actions to make the changes. With the increase in the factors like, frequent change in requirements, shortage of cost and time lines, lack of co-ordination or communication between developers or testers, there will be a chance of building accidental complexity (bugs or errors or unwanted behavior of the software). The increase in this complexity will result in the decrement of software quality. The Figure 1 gives the relation between the quality and complexity of software. From Figure 1, it can be said that, with the increase in the complexity the quality will decrease and after some point the
[image:2.595.319.567.98.244.2]software will be of no use, as the complexity takes over the software quality.
Figure 1: Quality Verses Complexity
The software‟s developed will always have some complexity in it, but it will be in minimum. Care should be taken such that it continues to remain in the same minimum level. Organizations developing software must have some methods to know the development process and to keep a track of the software development. Software metrics is one such mechanism which is used to determine the quality of software and keeps track of ongoing project process, software products, and software development process.
3.
Software Metrics
Software metrics provide measurement for certain aspects of software. The usage of
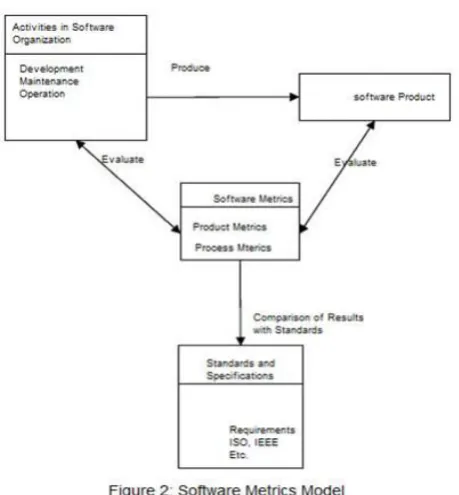
The first level of software metrics begins with the establishment of software quality requirements. All the attributes that define the software quality requirements must be agreed by the management and user-oriented views are then assigned to the attributes [17].Software metrics measuring software products is different for different paradigms. In procedural paradigm, it measures the functions and interaction of functions [30] and in object oriented paradigm, it measures the classes and interaction of classes [29] [30]. In case of procedural paradigm, the function name, type of function, parameters in the function and the interaction between the functions through function calls will make the structure of the software. Whereas, in object oriented paradigm, class data, operational attributes and the coupling of classes with one another will make the structure of the software. Figure 2 describes metrics model for selection of metrics and evaluation of metric results. Selection of metrics depends on the development phase of software product. If it is in the starting of development then, process metrics will be used and if the development is in the final phase (i.e., before the customer approval) then, product metrics will be used. The results obtained from the metrics are then compared with the standard or the sections of the software product. The evaluation will be human.
4.
Product Metrics
Product metrics are usually derived from the system itself [31]. The metrics data of this type can be collected after specific time intervals. The initial work in product metrics deals with the characteristics of the source code. It is always better to have metric information in the early stages of
development because; it will increase the chances of controlling the development process and the results. The following are some examples of metrics which are discussed below.
4.1
Size Metrics
The size of function is regarded as; one of the controversial but still it is the one of the most widely used metrics [29] [30]. It becomes controversial because there is no perfect measure for size, which everyone agrees on. The size metrics is an attempt to quantify the „size‟ of software, and the widely used size metrics is Lines of Code (LOC). The size metrics has some deficiencies because it cannot be measured until the process of development is completed. Some Halstead‟s metrics are also used to measure the size metrics, but they are not discussed in this paper work. Lines of Code (LOC) are one of the most widely used metrics for the program size [32]. LOC is calculated by the total number of lines of code in a function. The total number lines can be with or without the blank and comment lines [30]. The decision to include the blank and comment lines will be of the developers. The size metrics can be extended to measure the size of a system by summing all the LOC metric values of all the functions in the system. The calculated values of lines of code metrics is shown in results section (Table 2 to Table 6).
4.2
Complexity Metrics
Complexity metrics is considered as the measure of control flow in a function. The complexity metrics is used to quantify the relation between the complex codes and its failures. The example of Complexity Metrics is Cyclomatic Complexity Metrics. Cyclomatic Complexity metrics was proposed by McCabe in the year 1976. It is a measure derived from the product itself [2] [33]. It is used to measure the control flow complexity in a function. It is also considered as one of the internal metrics, as it built early warning from the collection of the collection of internal metrics [34]. The measured values of cyclomatic complexity metrics can be calculated numerically or can be represented in figures. There are tools for representing the cyclomatic complexity in figures. The calculated cyclomatic complexity is shown in results section.
4.3
Defect Metrics
It is an external measure of the system derived from the external assessment of the behavior of the system [33]. It is used to measure the number of defects in a software product and the data required for the metrics is collected from the product itself. So, it can be said that it quantifies the product metrics. There has been no particular procedure for the measurement of number of defects. One of the alternative methods for the defects metrics is to find number of errors during code inspection.
5.
Methods
The Methods used in this paper consists of both investigation and practical approach. The investigation on Software Quality through case study of different journals.
6.
Results
Lines of Code: The lines of code calculated are the total number of executable lines, i.e., excluding the comment lines. The summary of java source code and the summary of each of its classes are given in the tabular columns from Table 2 to
Table 6. The results are further discussed in discussions section.
[image:3.595.54.284.76.324.2]Number of Classes
Class name Lines of Codes
Number of methods
1 Class 1 329 12
2 Class 2 302 12
3 Class 3 32 2
[image:4.595.49.289.71.139.2]4 Class 4 18 2
Table 3: Summary of Lines of Code Metrics for class 1 Number of
Methods
Method Lines of
Codes
1 Run Server 70
2 Process Connection 43
3 Send Data 38
4 Wait for Connection 31
5 Close Connection 29
6 Get Stream 28
7 <init > 59
8 Display Image 9
9 Set text field editable 9
10 Access $000 5
11 Access $100 4
[image:4.595.48.285.180.350.2]12 Access $200 4
Table 4: Summary of Lines of Code Metrics for class 2 Number
of methods
Methods Lines of Codes
1 Run Client 44
2 Process Connection 39
3 Send Data 38
4 Wait for Connection 30
5 Close Connection 29
6 Get Stream 28
7 <init > 63
8 Display Image 9
9 Set text field editable 9
10 Access $000 5
11 Access $100 4
12 Access $200 4
Table 5: Summary of Lines of Code Metrics for class 3 Number of
Methods
Methods Lines of Codes
1 Main 28
2 <init> 4
Table 6: Summary of Lines of Code Metrics for class 4 Number of
Methods
Methods Lines of Codes
1 Main 14
2 <init> 4
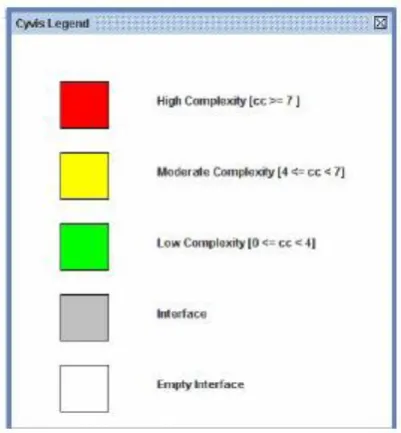
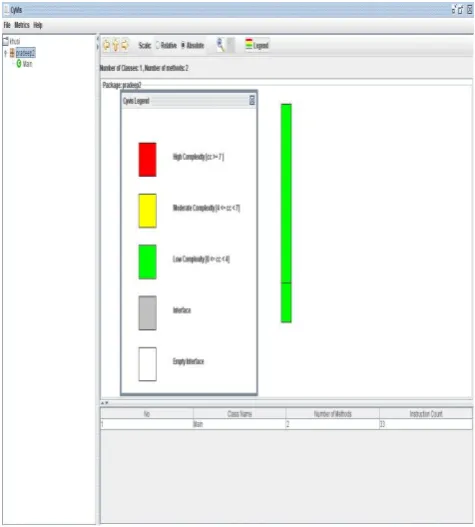
Cyclomatic Complexity: The cyclomatic complexity of each class is calculated by counting the number of methods, and the complexity involved during its control flow. The results of cyclomatic complexity are shown in Figure 3, Figure 4 to Figure 6 and it is further discussed in discussions.
[image:4.595.318.519.276.493.2]Figure 4: Cyclomatic Complexity
7.
Discussions
The metrics may not directly define quality or can be related to quality. However, they can be used to improve the quality. They can be used to define the parameters that affect the quality and also the changes that can be made to improve the quality. The other main advantages of these metrics are that, they can be used to create the test cases for software testing. They also provide us with the information such as the number of lines in the code, the most complex part of code and also the number of methods contained in the code. Each of the metrics provides us with specific information of the code. The lines of code metrics represent the size of program and also the number of methods involved in the program. The results of the Lines of Code Metrics are discussed below: Table 3 gives the summary of java source code. It consists of 4 classes and the metrics for lines of code for each is calculated. The number of methods involved in each class is also calculated. By summing the total number of lines for each code, the total size of the system can be found. Table 3 to table 6 gives the summary for Class 1, class 2, class 3 and class 4. The usage of this metrics will reduce the subjectivity by providing the total number of lines in each class and the number methods present in it. It makes the software more clear and visible. The lines of code for each class can be cross checked by comparing it with summary of classes given in Table 3, Table 4, Table 5, and Table 6.
Cyclomatic complexity, apart from providing us with the complexity in each and every method involved in the code, also provides us with the flow of complexity i.e., structural complexity. It also indicates how complicated the flow is in a function and also indicates how many test cases are needed to perform the basis path testing on the function. The results of Cyclomatic Complexity Metrics are discussed below: Figure 4 shows the cyclomatic complexity for java source code. As discussed in lines of code metrics, it consists of 4 classes and flow complexity is shown in Figure 4. The vertical bars represent the classes, and it is from left to right. The
horizontal bars represent the method involved in each class, and it is from top to bottom. The colors shaded in each method represent the cyclomatic complexity of that method. The meaning of the color and its level of complexity is shown in Figure 3. The method with red color will have the highest cyclomatic complexity, and its value will be greater than or equal to 7. Yellow color represents moderate cyclomatic complexity with its value ranging between 4 and 7. Green color is for low cyclomatic complexity and it will range between 0 and 4. As there has been no interfacing in the java source code, interfacing is not being discussed. But its color representation is shown Figure 3. Defect metrics does not have particular procedure to measure the total number of defects in the system. The alternative method is to calculate some of the characteristics of the code. As the java source code has been provided after its development, only one characteristic of it has been calculated i.e., the total number of errors during code inspection. The java source code has been inspected and the total number of errors during inspection has been found.
8.
Conclusion
The software quality, software metrics and some of applications of software quality metrics has been studied, analyzed and reviewed. The java code has been evaluated using pre-defined metrics and the value of different metrics was calculated. From the calculated values of metrics i.e., lines of code, number of errors, and cyclomatic complexity, it was clear that, these metrics can be successfully used to predict the quality level of the software developed. For the future this study can be applied for C++ code.
9.
REFERENCES
[1] Barbara Kitchenham and Shari Lawrence Pfleeger: “Software Quality: The Exclusive Target‟. IEEE publication, January 1996.
[2] Nachiappan Nagappan, Laurie Williams, Mladen Vouk, and Jason Osborne:” Early Estimation of Software Quality Using In-Process Testing Metrics: A Controlled Case Study”. Microsoft Research, Redmond, WA 98052, ACM publications.
[3] Boehm, B. W.: “Software Engineering Economics”.
Englewood Cliffs, NJ: Prentice-Hall, Inc., 1981.
[4] J. E. Gaffney, Jr.: “Metrics in software quality assurance”. January 1981, ACM 81: Proceedings of the ACM '81 conference.
[5] Wei Li and Harry Delugach: “Software Metrics and
Application Domain Complexity”. Computer Science Department The University of Alabama in Huntsville Huntsville, AL 35899, IEEE publications 1997.
[6] B.W. Boehm, J. R. Brown, and M. Lipow: “Quantitative
evaluation of software quality”. In Proceedings of the 2nd International Conference on Software engineering, pages 592–605, 1976.
[7] software quality?”. IEEE publications, Fifth International
Workshop on Software Quality 2007.
[8] Tom Mens and Serge Demeyer: “ Future Trends in
Software Evolution Metrics”. ACM publications 2002.
[9] N. Fenton and S. L. Pfleeger: “Software Metrics: A
[10] Demeyer and S. Dueasse. Mettles: “Do they really help?
In Proc. Languages at Modules and Objects”. Hermes Science Publication, pages 69-82.
[11] S. R. Chidamber and C. E Kemerer: “A metrics suite for
Object-oriented design”. IEEE Trans. Software Engineering, June 1994.
[12] Jeffrey Voas: “ A New Generation of Software Quality
Conferences”, IEEE publications, IEEE Software January/February 2000.
[13] Barry Boehm, Sunita Chulani, June Verner and Bernard Wong: “Fifth Workshop on Software Quality”. IEEE Publications, 29th International Conference on Software Engineering.
[14] Kitchenham, B: “ The Failure of Quality, Proceedings of
the Second Workshop on Software Quality”. ICSE 2004.
[15] “Software Metrics - An Introduction”. IEEE
publications.
[16] Konstantinos Stroggylos, Diomidis Spinellis: “Refactoring – Does it improve software quality?”. IEEE publications, Fifth International Workshop on Software Quality 2007.
[17] “IEEE Standard for a Software Quality Metrics
Methodology”. IEEE publications.
[18] Evans, Isabel: “Achieving Software Quality Through
Teamwork”.Norwood, MA, USA: Artech House, Incorporated, 2004.
[19] Kenett and Ron: “Software Process Quality:
Management and Control”.New York, NY, USA: Marcel Dekker Incorporated, 1999.
[20] Schulmeyer, G. Gordon: “Software Quality Assurance-
Coming to Terms, in The Handbook of Software Quality Assurance”. Schulmeyer, G. Gordon and McManus, James I., eds., New York: Van Nostrand Reinhold Company, Inc., 2nd ed., 1992.
[21] Jones, T. Capers: “Applied Software Measurement”.
McGrawHill, 1991.
[22] McCabe, Thomas J., and Schulmeyer, G. Gordon: “The
Pareto Principle Applied to Software Quality Assurance, in The Handbook of Software Quality Assurance”, Schulmeyer, G. Gordon and McManus, James I., eds., New York: Van Nostrand Reinhold Company, Inc., 2nd ed., 1992.
[23] Thomas B. Hilburn and Massood Towhidnejad: “Software Quality Across The Curriculum”. Published in 32nd ASEE/IEEE Frontiers in Education conference.
[24] Hector Morrison: ”Standards and Certification”. IEEE
publication 1993.
[25] Dr. James A. Bednar and Dr. David Robertson: “Software Quality and Standards”. SEOC2 Spring 2005, Quality/Standards.
[26] O'Regan and Gerard: “Practical Approach to Software
Quality”. Secaucus, NJ, USA: Springer-Verlag New York, Incorporated, 2002.
[27] K. Kontogiannis: “Evaluation experiments on the
detection ofprogramming patterns using software metrics”. IEEE Computer Society Press, 1997.
[28] B. Lagufi, D. Proulx, E. M. Merlo, J. Mayrand, and J. Hudepohl: “Assessing the benefits of incorporating function clone detection in a development process”. IEEE Computer Society Press, 1997.
[29] Wei Li and Sallie Henry: “Maintenance Metrics for the
Object Oriented Paradigm”. IEEE publications.
[30] Wei li: “ Software Product Metrics – Using them to
Quantify Design and Code Quality”. IEEE publications, December 1999/ January 2000.
[31] Nachiappan Nagappan, Thomas Ball, and Brendan Murphy: “Using Historical In-Process and Product Metrics for Early Estimation of Software Failures” Microsoft Research, IEEE publications.
[32] Everald E. Mills: “Software Metrics‟. SEI Curriculum Module SEI-CM-12-1.1, December 1988.
[33] ISO/IEC: "DIS 14598-1 Information Technology – Software Product Evaluation". ISO 1996.
[34] McCabe, T. J.: "A Complexity Measure". IEEE Transactions on Software Engineering, Vol. 2, No. 4, pp. 308-320, 1976.
[35] Chulani, S, Ray, B., Santhanam, P. and Leszkowicz, R.:“Metrics for Managing Customer View of Quality”, IEEE Metrics conference, Sep. 2003.
[36] M. Lorenz and J. Kidd: “Object-Oriented Software
Metrics: A Practical Approach”. IEEE publications.