http://dx.doi.org/10.4236/oja.2014.42005
The Features of Acoustic Bathymetry of
Sludge in Oil Storage Tanks
Manel Monteiro
1, Victor Svet
2, Donald Sandilands
1 1ITS Ltd., Aberdeen, UK2Laboratory of Signal Processing and Imaging, Institute of Acoustics, Moscow, Russia
Email: vsvetd@mail.ru
Received 25 March 2014; revised 25 April 2014; accepted 15 May 2014
Copyright © 2014 by authors and Scientific Research Publishing Inc.
This work is licensed under the Creative Commons Attribution International License (CC BY).
http://creativecommons.org/licenses/by/4.0/
Abstract
The features of acoustic bathymetry of sludge in crude oil tanks are considered. Different para-meters of crude oil and sludge which are important for the selection of acoustic parapara-meters such as sound speed, the acoustic impedances of “oil-sludge” boundaries and sound attenuation are analyzed and compared with experimental data. The main sources of errors of sludge volume es-timation are discussed.
Keywords
Crude Oil, Storage Oil Tanks, Sludge, Acoustic Bathymetry, Acoustic Profiling
1. Introduction
sludge height exceeds the height of the leg support then there is a risk of damage to the roof when lowered to the maintenance position. Measurement of the volume and its spatial distribution is typically performed manually using a special weighted metal tape measure. The sludge/oil interface is detected by the operator feeling the change in weight of the measurement tape as it makes contact with the higher density sludge surface. Manual measurement is time consuming, subjective and places the operator in a potentially hazardous area for long pe-riods since H2S gas is typically present in crude oil. Manual measurements can be made only in a few entry points so the reliability of the measured volume and character of sludge distribution over the bottom are very poor. The error of the measured volume can be up to 35% - 45%. Note that a measurement error of a few centi-meters can lead to an error in sludge volume of several hundred cubic centi-meters.
Currently the most promising method of sludge evaluation in large storage tanks is acoustic profiling. Acous-tic profiling is similar to acousAcous-tic bathymetry in Oceanography but the technical implementation of suitable de-vices differs from marine multi-beam echo sounders due to the specific conditions of sound propagation in crude oil and the characteristics of closed tank environments that significantly influence signal processing methods. In this article we will discuss the basic physical effects associated with sound propagation in the crude oil which has a major influence on the reliability of measurements of sludge distribution and the evaluation of its volume.
2. Parameters of Crude Oil
The properties important for acoustics are only well understood for pure refined oils. The acoustic properties of crude cannot be tabulated because of the wide variation of crude oil produced from different oilfields. The most important parameters are sound speed velocity in the crude oil, Ccr, attenuation, αcr and character and level of backscattering echo-signals from the boundary of the “oil-sludge”. In turn, the sound speed depends on the tem-perature of crude oil, its density, water content and dissolved gas. Sound attenuation is determined by the ab-sorption and additional losses due to sound scattering caused by the dissolved gas, various suspensions and wa-ter-oil emulsion layer. Another important fact is that all these parameters can significantly vary both in time and in space, i.e. their distribution can be anisotropic. This in turn causes additional refraction effects of the acoustic rays. Furthermore the oil tank is an enclosed design and its metal walls and different internal metal constructions (roof supports, heaters, mixers, and pipes) perfectly reflect the sound waves. Such reflections are a source of strong reverberation, which has a negative impact on performance.
2.1. Specific Gravity of Crude Oil (Oil Density)
In accordance with the classification of API (American Petroleum Institute) all crude oil is divided into 4 types: the “light”, “medium”, “heavy” and “extra-heavy” [1]. To estimate the density of the oil industry uses specific units API0, which are associated with normal density SG = ρ0
0 141.5
API 131.5
ρ
= − (1a)
0 141.5 SG 131.5 API ρ = =
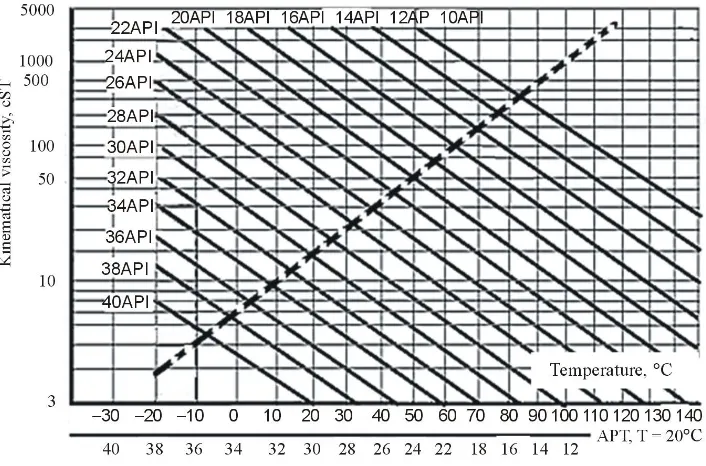
+ (1b) Light Crude has an API gravity higher than 31.1˚ API, Medium Crude has an API gravity between 22.3˚ API and 31.1˚ API and Heavy Crude has an API gravity below 22.3˚ API. This specification is for T = 16.5˚C. Fig-ure 1 shows plots of the kinematic viscosity of oil versus temperature for different values of the API, the dotted line on these graphs shows the kinematic viscosity of crude versus density at temperature T = 20˚C. Many em-pirical relations are offered for the calculation of oil density versus temperature. A commonly used formula is:
4 2 1 2
3.37694 10 7.06892 10 8.80964 10
n T T
ρ = × − − × − + × (2)
2.2. Sound Speed
Figure 1. Oil viscosity versus gravity and temperature according ASTM Standard Viscosity Temperature Charts for Liquid Petroleum products (D34), (Courtesy of Paragon Engineering Ser-vice, Inc.).
crude oil
15450
3.7 C 77.1 API
C = − T
+ (3)
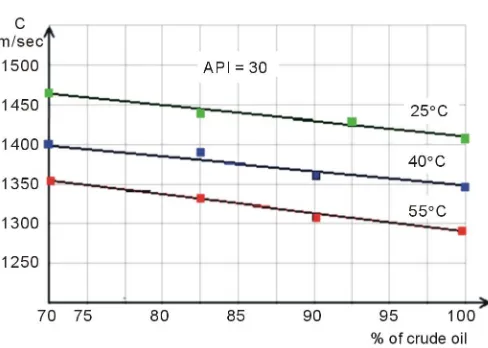
The dependence of the sound velocity versus temperature for oil with different API is presented in Figure 2. In the presence of water in of crude in the form of a water emulsion then the sound speed increases with an increasing of amount of water, Figure 3.
As follows from these graphs, the sound speed decreases almost linearly with decreasing % of water. It is in-teresting to compare the calculated data of sound speed with real measurements of sound speed in different types of crude. Direct measurements of sound speed are presented on Figure 4. For each of six tanksthe sound speed data has been measured in 6 - 8 entry points. Four tanks contained light oil and two tanks were filled with me-dium oil. Since the measurements were performed at different temperatures (16 - 21)˚C, the experimental data is recalculated to the same temperature of 20˚C using the formula (3) for oil with API0 40.
It is seen from this data that formula (3) is a quite satisfactory approximation for the evaluation of sound speed, but in practical conditions it is better to measure sound speed directly in the actual tank environment, be-cause possible errors of evaluated inclined distances can be meaningful.
2.3. Sound Attenuation and Absorption in Crude
The general weakening of the acoustic energy ofin sound waves propagating in crude (α∑-attenuation) is deter-mined not only by classical absorption but also by scattering of sound by various irregularities that are always present in crude oil. Such irregularities are dissolved gas bubbles, water droplets and solid particles of sand and other minerals. Therefore general attenuation is [2]
abs wio gas solids
α∑ =α +α +α +α (4)
where
αabs—absorption coefficient, which depends on f2,
αg, αw, αp,—coefficients of sound attenuation due to scattering from gas bubbles, water droplets and solid par-ticles, respectively.
[image:3.595.138.491.85.318.2]Figure 2.Sound speed in crude oil versus temperature for different API.
Figure 3.The speed of sound in the crude oil versus % of water content.
Figure 4.Experimental data of sound speed versus calculated value at T = 20˚C for API 40.
weakening of sound, and can be significant, if the operating frequency is the resonant frequency of the gas bub-bles. The level of scattering due to bubbles also depends on their concentration, bubble size, temperature,
pres-Sound Speed vs Temperature
1050 1100 1150 1200 1250 1300 1350 1400 1450 1500 1550
10 20 30 40 50 60 70 80 90
Temperature
S
ound S
pe
e
d
API = 25
API = 30
API = 35
API = 40
API = 45
S
ou
nd S
pe
[image:4.595.194.435.506.683.2]sure, frequency and type of oil. If it is assumed that in a crude tank, the relative concentration of the gas bubbles is not very big (τN < 10−5), where τN = τkN, then in accordance with [7] additional sound attenuation in oil
con-taining N bubbles of radius rkin 1 cm3 radius, is equal to:
6 2 0 bubble 2 2 10 2 2 0 3.12 10
1 1.21 10
Nf f f f τ β − − × = − + × (5)
where 4 π 3
3
N kN r Nk
τ =τ = , and resonance frequency of gas bubble is determined from relation 0 326
k
f r
≈
For the frequency range 100 - 200 kHz the largest contribution comes from bubbles with a radius of 3.26 (2−10 - 3−10) mm. For example, if a 1 cm3 volume contains one resonant gas bubble at 150 kHz, the additional attenua-tion will be about 0.015 dB/m, which is quite significant. It should also be noted that small bubbles can “live” in the viscous oil for a very long time since their ascent rate is very low. For example, the ascent rate of a bubble with diameter 50 micron in water is less than 0.0005 m/sec, and in oil with a kinematic viscosity of 5 - 7 cSt this rate can be 100 - 1000 times less. The presence of solid particles suspended in the crude oil also leads to an ad-ditional attenuation due to the friction, scattering, and internal losses. We have no experimental data on the con-centration of particles of various impurities in the crude oil and their size distribution. Therefore, for a rough es-timation of the attenuation one can use the empirical formula for water and little concentrated suspensions [8]
0.167
p P Ap p
α = (6)
where 3
part 4 πpart part
3
P = r Nρ The dependence of the Ap on frequency and size of the particles is shown in Figure
5
For example, for averaged particle with diameter of 30 microns, concentration of 0.025 to 0.7 kg/m3 and fre-quency 150 kHz the additional attenuation can be from (0.007 to 0.05) dB/m. Note that these irregularities are always present in the crude oil. Figure 6 shows the results of laboratory analysis of crude oil samples taken from 6 different storage tanks (different oil fields).
[image:5.595.196.429.474.696.2]From these data it follows that the real attenuation of sound waves in crude will be always more than pure absorption and this feature should be considered in the design of acoustic tools for correct selection of their op-erating frequency and source level. Figure 7 confirms this thesis.
Figure 5.The frequency dependence of the coefficient Ap for
Figure 6.Content of crude in 6 different storage tanks.
Figure 7.Attenuation on F = 150 kHz in pure oil and crude oil (experimental data).
2.4. Parameters of Sludge
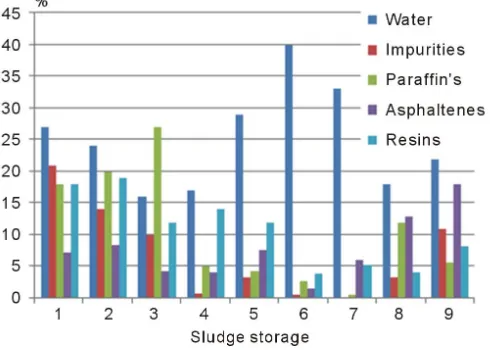
Knowledge of sludge parameters is necessary for the correct selection of carrier frequency and evaluation of energy balance for the acoustic profiling tool, since the coefficient of backscattering from sludge is a very criti-cal parameter depending on angle of illumination and differences in the acousticriti-cal impedances of oil and sludge. Oil sludge compositions are extremely varied and complex systems consisting of oil, water and mineral fraction (sand, clay, silt, etc., the ratio of which can vary over very a broad range. On average sludge can contain (by weight) oil (10 ... 60%), water (30 ... 85) % and solids (up to 45%). A more detailed analysis shows that the or-ganic part of sludge, except for free oil hydrocarbons, contains asphaltenes, paraffin and nonoror-ganic inclusions such as iron oxides, sulfides and so forth. Figure 8 presents the content of sludge from different storage tanks [6].
Viscosity and density for these samples are presented on Figure 9.
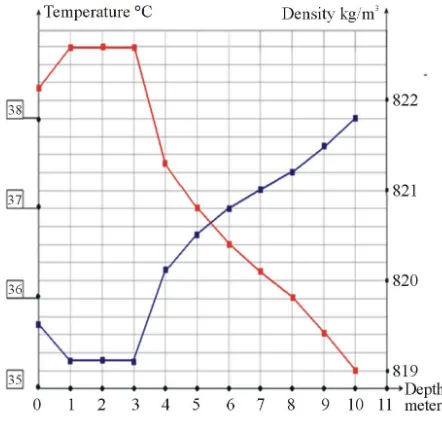
but with some percentage of different suspensions. It is practically impossible to detect this layer on the fre-quencies which are used for acoustic sludge profiling. The second layer is the “transition layer”. It is also sludge, but its viscosity and density are less than the third sludge layer. The thickness of the transition layer can range from a few millimeters to ten centimeters or more. The acoustic impedances and backscatter coefficients of the transition layer are not known. But the very important issue is that the presence of the transition layer, if this layer is detected, can be the source of additional errors of in estimation of the sludge volume. The existence of the transition layer is illustrated in Figure 10, which shows the results of direct measurements of the density of the crude oil. It is evident that there is a transition layer with a thickness of more than 10 cm.
Figure 8.Content of sludge in 9 sludge storage tanks.
[image:7.595.188.437.394.708.2]Figure 10.Transient layer.
The problem in detecting the transition layer is closely related to the values of acoustic impedances for sludge and crude oil. We can directly measure the acoustic impedance of crude oil using measurements of sound speed and density. The problem is how to measure sound speed in the sludge? Unfortunately such data is not available in published literature. The simplest way is direct measurement. However, the realization of such measurements needs to have an echo-sounder with a low operating frequency, since the absorption in sludge is very high due to the very high viscosity. Then knowing the height of the tank, the level of oil, depth of immersion of tool, sound speed in oil and density of the sludge it is possible to measure sound speed in sludge using measured time of flight of forecho-signals reflected from the metal bottom and sludge surface. However, the need to have an addi-tional lower-frequency measuring channel significantly complicates the equipment and increases its cost.
Therefore, we can proceed as follows. We can estimate the sound speed in sludge, using data on the density and viscosity of the sludge and comparing this with known experimental data for the refined petrochemical products of crude oil, which have similar viscosity and density to the analogous parameters of the sludge. Such products range between diesel oil and lubricating oils. Because the mentioned parameters are similar, it does not matter that chemically these substances are different. Experimental data for some petroleum products are pre-sented in Table 1
Experimental data for sound speed versus viscosity for these products and an approximation curve are pre-sented in Figure 11.
The approximation curve describes quite well the behavior of sound speed in high-viscosity oil products and it can be used for estimation of sound speed in sludge. Now, using the obtained data, we can estimate the acous-tic impedances of oil and sludge, and calculate the coefficients of reflections from sludge, which in turn will al-low the estimation of the levels of scattering echo signals and correct calculating the energy balance of the acoustic profiler.
2.5. Temperature Gradients
The temperature distribution inside the tank may not be uniform. Typically, vertical temperature gradients are the most significant, although in some conditions horizontal gradients can arise. The presence of vertical tem-perature gradients causes the refraction of sound waves, which in turn can lead to errors of measured slant ranges and, ultimately, errors of volume. Figure 12 shows measurements of the density and temperature of oil versus depth, for a small oil tank of about volume 3000 m3 and a height of 11 meters.
Table 1. Parameters of petrochemical products.
Oil product Density, (20˚C)
g/cm3
Sound speed m/sec
Oil 845 1366
2nd product 881 1450
3rd product 893 1474
4th product 907 1490
5th product 923 1509
Fuel oil 938 1513
Tar 988 1581
Figure 11. Experimental data on sound speed in petroleum products and approximation curve. (Data provided courtesy of G.M. Volk).
Figure 12.The vertical profile of temperature and density in 8 hours after filling the tank with heated oil.
3. Geometry of Measurements
[image:9.595.200.421.409.620.2]illuminated area becomes very small. Therefore generally acoustic profilers use an inclined array at a certain vertical angle. However, the vertical inclination of the array creates two negative effects. Inclined illumination causes a weak level of backscattering signals from the sludge surface and the character of backscattering be-comes close to isotropic, which in turn reduces the effectiveness of the correlation processing of complex broadband signals. The transmitter power and resulting source level is limited by the heat dissipation capability of the immersed array. The only way to increase the signal/noise ratio is to use complex signals with correlation processing. But the isotropic character of scattering leads to de-correlation of complex signals and gain of cor-relation processing becomes small compared with the radiation of a simple tone burst. There is no reliable data on backscattering levels of echo-signals from sludge. For rough estimations we will use published data for dif-ferent bottom types in fresh water [7], Figure 14.
[image:10.595.185.442.240.471.2]Because the surface of sludge is more similar to irregular silt the design of the acoustic profiler should mostly focus on plots 1 and 2, therefore the averaged backscattering level can be estimated as about -(25 - 30) db.
Figure 13. Ray traces for uniform and vertical temperature profiles.
[image:10.595.242.387.502.673.2]4. Accuracy of Measurements
What could be the real measurement error of the sludge volume? Despite the fact that the technical (system) ac-curacy of the profiling tool can be very high, the actual error of a measured sludge volume may not reflect this. The operating frequencies used in these systems generally lies in the range from 120 kHz to 200 kHz and slant ranges, which determine the local heights of sludge, may be estimated with a very high accuracy using short
pulses or complex signals. The range resolution for a simple pulse signal is equal to
2
C
R
τ
∆ = or *
2 C R F ∆ = ∆
for complex signal and may be adjusted from 0.5 cm to 2.0 cm, where C—the sound speed in oil, τ—pulse length, ΔF—bandwidth. The mean-square error of measurements of slant range depends on output signal/noise ratio,
0.5
S R
N δ ≈
. Therefore the relative error R R θ
δ ∆
= can be very small at high output signal/noise ratio, S/N.
However, this small relative error does not guarantee the same error of measured volume. There are two types of errors—systematical and random. The nature of systematical errors is the errors of positioning of the tool, in-correct information on the co-ordinates of entry points and so on. We will not consider them. The main source of errors is errors in the measured sound speed and reverberation effects.
4.1. Refraction Errors
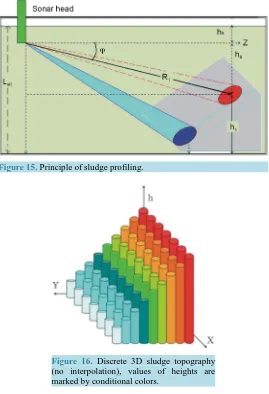
Let us review in short the principle of acoustic profiling to understand the influence of refraction errors, Figure 15.
Regardless of the type of array, it creates a narrow beam (or beams) which can scan in the vertical and hori-zontal planes. The width of beam determines the angle resolution and the covered partial area of the sludge sur-face. The principles of beamforming can be different—2D full sampled arrays, Mills cross, interferometry arrays and so on. Let us propose that the sludge surface has one reflecting point and the distribution of temperature in tank is uniform. Our goal is to estimate the height of this point. First of all we measure the slant distance to this point, knowing the time of flight τ of the echo signal.
1 1
2
oil
C
R = τ (7)
Because we know the vertical steering angle φ1 we can calculate ho as ho = R1Sin φ1 and the required height of sludge h1,
(
)
1 Sin 1
2
oil s
C
h = L−h −
τ
ϕ
(8)Acting similarly for all scanning horizontal and vertical angles we can define all theheights of a surface h(x,y). The result of such measurements is the cloud of points h(x,y) which describes the sludge surface in a discrete form, Figure 16. Interpolation procedures are then applied to get the final image of thesurface.
Note that thepartial volumes are presented as “cylinders”, though in reality they will have another form. The volume of sludge is the sum of all partial volumes but there is an unknown parameter—sound speed Coil..
Strictly speaking, system parameters such as phase shifts or time of delays which are used in beamforming procedures also depend on the speed of a sound. In particular, the volume of cylinder is equal to:
(
)
2 2
1 π 1 π Sin 1
2
oil s
C
V = r h = r L−h − τ ϕ
(9)
Total volume will be the sum of (9)
total 1 N i i V V =
=
∑
(10)It follows from (8) that errors of volume ∆V are proportional to errors of sound speed ΔCoil,
const oil oil C V V V C
Figure 15.Principle of sludge profiling.
Figure 16. Discrete 3D sludge topography (no interpolation), values of heights are marked by conditional colors.
Note ΔC can be positive or negative. However, sound velocity also depends on the temperature (3). Therefore, when measuring the sound speed we must also measure the temperature.
Roughly the accuracy of sound speed in real conditions can be +/‒ 2% - 3% and the accuracy of measured sludge volume directly depends on this accuracy.
Now let us consider themore complex case when oil has a vertical temperature gradient like thedependence in Figure 7.
Because of thenon-uniform distribution of sound speed with depth thesound rays will refract. The presence of refraction can affect theaccuracy of themeasurements of heights and consequently, the error of volume, Figure 17.
Let us suppose that we formed a vertical beam with angle α0. In some time we receive a reflected signal from distance R = C0t. C0—is the speed of sound we have measured at point A.
Because of refraction the vertical beam generated with vertical angle α0 will be bent and result in the distance R = Ct, and (C ≠ C0!).We will get the reflection from point B and the image of this point is true. In other words,
angle α is a true angle and angle α0 is the apparent angle. Therefore the height h0 is the apparent height. Its value is only true for a homogeneous environment. Since point B has a different height from point A, it means, that there is an error in the measurement of height h0.. An inhomogeneous environment will cause errors in the
ver-tical angle that will result in errors in the estimation of heights. The true height is equal to:
( )
SinFigure 17.Errors of measured height in a vertical plane.
and the apparent height is equal to
0 0Sin 0
h =C t α (12b)
where
C—some average sound speed on the line AO C0—sound speed in a point A
t—double time of flight from array up to reflecting point.
The true height h can be calculated if we can calculate time of flight along the refracted ray knowing sound speed profile and angle α0[7]
( )
( )
0 2 2 2 0 0 d 1 Cos h hn z z
t
C n z α
= ±
−
∫
(13)In Equation (13) all parameters are known except the true height.
Because of complex function of n(z) for real environments integral (13) can be calculated by numerical me-thods. There is only one simple case where we can calculate (13) analytically.
If n2
( )
z = +1 2aZ (14)and Cos2α0≈1 and Sin2α0≈α02
( )
2 0 02
a C t
h=h + (15)
Therefore the correction factor is equal to
( )
2 0 02
a C t
h h h
∆ = − = (16)
Note that the coefficient a can be positive or negative. Equation (16) is only true for small vertical angles. For arbitrary angles of vertical scanning
2 0 1 1 1 2 Kh h K = + −
(17) where
(
2)
0 0
2GC ctg 1
K
C α
= − (18)
The results of calculations using (16) and the vertical profile in Figure 13 are presented in Figure 18. Note that this data is only to illustrate the influence of refraction on the accuracy of measurements.
Figure 18. Errors on height versus seemed measured height at different angles of vertical scanning.
(
0)
– SL oil
H =L h ± ∆h .
From Figure 18 we can conclude that non-uniform distribution of temperature in the oil can lead to signifi-cant errors in measuring the form of a surface because of refraction. The error values depend on the vertical scanning angles sector and the values of gradients of temperature and sound speed.
4.2. Reverberation Errors
The second main source of errors is the reverberation of spurious signals received and generated by the main and side lobes of the transmitting and receiving arrays. These false signals appear as a result of the reflection of the pulses from metallic supports the roof, tank walls and various structures located on the bottom (heaters, pipes, etc.). Despite the fact that the arrays typically use apodization to decrease the side field, the levels of spu-rious side echo signals reflected from the metal structures can still exceed the useful weak echoes from sludge and, in addition, they can appear in unpredictable places. If such signals fall in the area of the sludge surface, they create additional “peaks” or “false” reflection points on the surface, which lead to an incorrect evaluation of heights and incorrect estimation of the volume. It usually leads to an over estimation of the sludge volume Fig-ure 19 shows an example of a two-dimensional distribution of intensity echoes (in in a tank with a diameter of 60 meters).
The sludge surface looks like a cloud of non-uniform brightness; it is outlined by a closed curved red line. The strong echoes like “dashes” visible on the surface of the sludge and beyond it are generated by the reflec-tions from the roof supports. Some of them are received by the main lobes of the array and some of them are generated by the side lobes. The presence of these signals leads to incorrect reproduction of the surface shape of the sludge; refer to the left image in Figure 20. It can be seen that the sludge surface has heights up to 6 m in some places, while the average height of sludge does not exceed 1.9 m. The presence of these spurious signals leads to an overestimation of sludge volume: 3262 m3 versus the real volume of 2764 m3.
This example implies that the development of acoustic sludge profiling systems should strive to minimize the level of side lobes in the arrays and use more sophisticated signal processing algorithms.
[image:14.595.207.419.84.330.2]Figure 19.2D distribution of intensities of echo-signals in tank.
Figure 20.Wrong and true image of sludge surface.
5. Conclusions
1). Considered features of sound propagation in the crude oil, located in large closed metal containers and their specific design can significantly affect both the structure of the arrays, and the signal processing algorithms, which may significantly differ from the usual methods of acoustic bathymetry in oceanography.
2). The description of the basic laws of propagation of acoustic signals in the crude oil and their dependence on various parameters can serve as a basis for the development of acoustic profiling systems, selection of the optimal frequency, size of the arrays and the required source level.
3). To minimize the possible errors in the calculated image of the sludge surface and its measured volume it is desirable to measure the vertical temperature profile and sound speed in all entry points.
4). In general, the signal processing algorithms should include procedures to compensate for refraction effects and suppression of false echo-signals caused by reverberation effects.
5). During inspection of crude oil tanks, the satisfaction of these conditions allow to obtain an error value of measured sludge volume in the range 3% to 5%.
References
[1] ASTM D341 (2003) Standard Test Method for Viscosity-Temperature Charts for LiquidPetroleum Products, USA.
[2] Kalivoda, R.J. (1995) Understanding the Limits of Ultrasonicsfor Crude Oil Measurement. www.engineerlive.com
[3] Wang, Z., Nur, A. and Batzle, M.L. (1988) Acoustic Velocities in Petroleum Oils. SPE Paper 15646, Proceedings 61st SPE Technical Conference.
[4] Коlobaev, P.A. (2000) An Experimental Research of Temperature Relation of Speed of Ultrasonics in a Crude Oil and Some Petroleum. The Transactions of the X Session of the Russian Acoustic Society, 2, 94-96.
[image:15.595.186.444.275.417.2]the Water Selected from Crude Oil and Density of This Water. Transactions of the XVI Session of Russian Acoustical Society, 34-35.
[6] Minnigalimov, R.Z. (2009) An Investigation of the Dependences of Dielectric Characteristics of Petroleum Slime. High Temperature, 47, 606-608. http://dx.doi.org/10.1134/S0018151X0904021X